Transcription
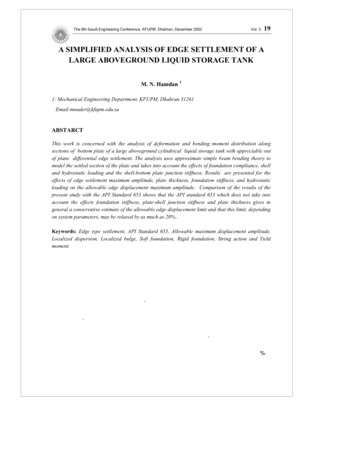
Advanced hemodynamicmonitoring, simplified.Smart. Innovation.ClearSight System
The ClearSight system is a simple,noninvasive solution that offers proactivedecision support to optimize perfusion.The versatile ClearSight system provides advanced hemodynamicparameters and continuous noninvasive blood pressure from asimple finger cuff with a convenient self-coiling mechanism.The ClearSight finger cuff is designed to provide consistent, highresolution measurements of arterial pressure. Continuous clarityoffered by the validated technology of the ClearSight system1 helpsyou proactively manage hemodynamic optimization to ensureadequate perfusion.Heart Reference Sensor (HRS)The ClearSight HRS automaticallycompensates for hydrostaticpressure changes due to heightdifferences between finger andheart. The HRS compensatesfor clinician repositioning of thepatient’s hand during a procedureor for patient movement.Advanced hemodynamicparameters Stroke Volume (SV) Systemic Vascular Resistance (SVR) Stroke Volume Variation (SVV) Mean Arterial Pressure (MAP) Cardiac Output (CO) Continuous NoninvasiveBlood Pressure (CNIBP)Extends hemodynamic monitoring.The ClearSight system gives you noninvasive access to automaticallycalculated hemodynamic parameters for a patient population,including patients in whom an arterial line would not typically beplaced.1-3Noninvasive hemodynamic monitoring offered by the ClearSightsystem enables proactive clinical decisions across the continuum ofcare, including moderate to high-risk surgery patients. It can also beutilized perioperatively to proactively manage patients’ changingclinical situations in the OR, ICU and even ED.A simple approach to continuousmonitoringA single ClearSight finger cuff can beused for up to 8 hours for accumulatedmonitoring of your patient. To increasecomfort, two ClearSight finger cuffsmay be connected simultaneously toalternate the measurement betweentwo fingers. This allows uninterruptedcontinuous monitoring up to 72 hours.
1Taking noninvasive simplicityto the next level.2Introducing a new design with a self-coiling mechanism withinthe interior of the cuff that wraps snugly around the patient’s finger.CC1105Versatile sizesSmall, medium and large cuffsaccommodate a range of patients.An easy-to-use sizing window ensurescorrect selection of the appropriate size.CC1106Advanced designAn innovative self-coiling mechanismwithin the interior of the cuff wrapssnugly around the patient’s finger.Alignment markers reduce variability in cuff application.Figure 1. Size the finger.Validated ClearSight technologyTo accurately mirror arterial line output,real-time finger pressure measurements areperformed 1000 times per second utilizingthe proven volume clamp method.4Figure 2. Select the finger cuff size.CC1119CC1098M3A4BCFigure 3. Apply the finger cuff.Helpful placement guidesIndicators inside the cuff denote location of photo diodes, to helpCC1120ensure correct positioning. External alignment markers guideplacement to simplify consistent positioning.At-a-glance confirmationAfter application, a color-coded sizing window on the cuff itselfconfirms if the appropriate size cuff is in place.Figure 4. Secure the finger cuff.5
SVV Slope IndicatorThe SVV Slope Indicator is a visual representation of theFrank-Starling curve used when assessing the Stroke VolumeVariation value. The indicator displays the current SVV valueand lantern which changes based upon set target ranges.An SVV value of 13% is displayed at approximately theinflection point of the curve, as shown in Figure 8-3.The indicator is displayed on the Physiology and HistoricPhysiology screens.Figure 8-3 SVV Slope IndicatorIf the underlying cause of hemodynamic instabilityis related to flow generation, continuousparameters can help you determine appropriatefluid therapy.Additionally, continuous monitoring of advancedhemodynamic parameters enables proactiveclinical decisions regarding appropriate treatmentto augment vascular volume, reduce anestheticadministration, or use vasopressors or inotropes.Continuous assessment of pressureand flow parameters offers proactivedecision support to help proactivelymanage the duration and severityof IOH episodes.4 The left bar appears after an historic physio record hasbeen created. To create an historic physio record, touchthe HGB, SpO2 or SvO2/ScvO2 parameter button andenter a value using the number pad. Before any values are entered for HGB, SpO2 or SvO2/ScvO2 the clock/waveform icon does not appear. Only theavailable continuous parameters are displayed.The Physio Relationship screen displays measuredparameters with connecting lines highlighting therelationship of the parameters to each other. It automaticallyupdates as parameter values change to display current values.Figure 8-5 Physio Relationship HistoricalData Screen Figure 8-4 Physio Relationship ScreenPhysio-RelationshipScreenContinuousand Historical ModesThe Physio Relationship screen has two modes: continuousand historical. When in continuous mode, derived values arealways displayed as unavailable.TissuePerfusionThe Historic Physio Relationship screen displays most ofthe parameters available on the system at a point in time.The screen displays lines connecting the parameters,highlighting the relationship of the parameters to eachother. The Historic Physio Relationship screen displays theconfigured (1-4) Key Parameters on the right hand side ofthe screen. There is a horizontal tab composite at the topthat allows the user to navigate through the database ofhistoric records. The record times correspond to derivedvalue calculations.Blood flow through the tissue(capillary blood flow) Early detection of hypotension by continuoushemodynamic monitoring might prompttimely therapy, thereby reducing intraoperativehypotension.5Proactively manage intraoperative hypotension(IOH). Clarity through advanced hemodynamicparameters CO, SV, SVV and SVR can help youdetermine if the cause of IOH is preload, afterload,or contractility.3 The horizontal lines are the same color as the line abovethem.Physio Relationship ScreenHypotension can lead to hemodynamic instability.The ClearSight system provides access toadvanced hemodynamic parameters, includingcontinuous noninvasive blood pressure (CNIBP),to allow you to evaluate hemodynamic instabilityand guide appropriate treatment.Episodes of hypotension may be decreasedthrough continuous monitoring. 4Cleveland Clinic researchers recently showedthat continuous noninvasive monitoring reducedthe amount of intraoperative hypotension bynearly half (P 0.039).52 The vertical lines below the parameter appear in the samecolor as the parameter lantern, except for the line belowSVV, which is the same as the parameter above it.5 The new physio record is filled with current continuousparameter data, the entered value and any derivedcalculated values (See “Physio Relationship Alarms/Targets and Historical Data Screens” on page 8-3).The user has the ability to enable or disable the display of theSVV Slope Indicator from the Monitor Screens SettingsMenu. The default setting is enabled. When the SVV filteringexceeded indicator is on, the system will not show the SVVlantern on the SVV indicator curve.Make proactive clinical decisionsbased on insights into pressure andflow parameters.1 The vertical lines above the parameters appear in the samecolor as the parameter lantern.Artery (PA )Vein (PV)TissuePerfusionPressure Pressure atarterial end (PA )Pressure at- venousend (P )VCardiac OutputSVHeart RateStroke VolumeSVPRELOADCONTRACTILITYAFTERLOAD
Manage the flow component ofperfusion to guide individualizedfluid management.When managing perfusion, stroke volume can be optimized usingthe patient’s own Frank-Starling curve.The patient’s location on the curve can be determined by measuring changes in SV in response to change inpreload using a bolus fluid challenge or passive leg raise (PLR).Dynamic and flow-based parameters are more informative than conventional parameters in determining fluidresponsiveness and may help guide individualized volume administration in patients and avoid excessive andinsufficient administration.5Additionally, stroke volume variation (SVV) has been proven to be a highly sensitive and specific indicatorfor preload responsiveness when managing volume. As a dynamic parameter, SVV has been shown to be anaccurate predictor of fluid responsiveness in loading conditions induced by mechanical ventilation.6-8Manage variability in volume administration.EV1000inClinicalPlatform NI Advanced FeaturesAdvanced hemodynamic parameters provided by the ClearSight system may be usedPerioperativeGoal-14-6Directed Therapy (PGDT) protocols to helpreducevariability in fluid administrationguide optimal Beforesufficient measurements have been taken, the The baselineandvalue is averaged from multiple readings.button can be touched to abort the test. A confirEnsure that the patient remains still and stays in the samevolume management in patients at risk ofCANCELdevelopingcomplications.mation popup window will appear. Touch Cancel Test toposition during this measurement period.return to the test configuration screen (New Test tab).The BaselineMeasurementscreenPGDT analytics software on the EV1000 clinicalplatform allows you to select,5 placeandtrack interventionsAfter sufficient measurements have been taken, thewill appear with a trend graph of dselected parameter and a countdownover time while providing key parameter trending data.analyze measured data before the full time of the test hasbeen reached touch END NOW.Frank-Starling relationship betweenpreload and stroke volume (SV)Stroke volumeHypo9 At the conclusion of the test, the change in the selectedParameter value as a response to the fluid challenge willbe displayed. See Figure 14-6. Touch the return icon toperform another test, or the home icon to return to themain monitoring screen.Hypertimer displaying the amount of timeremaining for the baselinemeasurement. To abort the baseline measurement, touch the CANCELbutton and return to the New Test screen.6 At the conclusion of the baseline measurement, a dashedwhite line will appear on the trend graph at a value representing a 10% increase from the baseline measurement.FluidtheResponsivenessTestTo remeasurebaseline value, touch RESTART.Assesswith7 To continueto the volumeFluid Bolus responsivenessMeasurement, administerthe fluidbolus and Legtouch RaiseSTART ONE8 A new countdown timer will appearto determine appropriate intervention.starting at the selected ChallengeSoftware% change in SV,Durationtime. Ensurecomputesthat thepatientSVI,remainsstillorduringthe keeps historical logCOCI andmeasurement period.of past FRTs. PreloadFigure 14-6 Fluid Responsiveness Test –Results ScreenFluid Bolus TestThe Fluid Bolus test is a sensitive method forassessing a patient’s fluid responsiveness. Duringthis test, a fluid bolus is administered to the patientand preload responsiveness may be assessed by tracking thevalue of SV, SVI, CO, or CI.1 Touch and highlight Fluid Bolus under the New Test tab.The New Test tab displays test configuration menuoptions.2 Select the Parameter to be analyzed: SV, SVI, CO, or CI.3 Select the Challenge Duration: 5 minutes, 10 minutes,or 15 minutes.4 Touch the Start Baseline button to begin the baselinemeasurement.Before sufficient measurements have been taken, theCANCEL button can be touched to abort the test. A confirmation popup window will appear. Touch Cancel Test toreturn to the test configuration screen (New Test tab).After sufficient measurements have been taken, theCANCEL button is no longer available. To stop the test andanalyze measured data before the full time of the test hasbeen reached touch END NOW.9 At the conclusion of the test, change in the selectedParameter value as a response to the fluid challenge willbe displayed. See Figure 14-6. Touch the return icon toperform another test, or the home icon to return to themain monitoring screen.Historical Test ResultsThe user can view previous test results on the HistoricalResults tab. A list of all fluid responsiveness tests for thecurrent patient is shown. Use the scroll buttons to highlight aspecific test and touch the Select button to view a test
Clinical decision support screens allowfor immediate recognition of rapidlychanging clinical situations.Big NumbersContinuous access to your choice of parameters on the EV1000clinical platform, when used with the noninvasive ClearSightsystem, enables Navigatingyou tomaintain your patientsin the optimal5-7the EV1000 Clinical Platform NIvolume rangereduce volume administration variability.CockpitandScreenThe big numbers screen displays parameters in a larger sizeThis monitoring screen, shown in Figure 5-11, displaysthan the other screens. This makes it easier for clinicians andglobes with the values of the parameter(s) being monitored.EV1000clinicalplatform.other personnel to see the values from a distance.They graphicallyindicate target, out of range and alarmvalues with needle indicators to show where the erfalls. In addition,the value within the patientglobe will status at a glance,when the supportparameter is alarming.and visualflashclinicalscreens allow for immediate recognitionThe Key Parameters display a more complex target and alarmand increasedunderstanding of rapidly changing clinical situations.indicator. The full display range of the parameter is used toEasy-to-use touchFigure 5-9selectionBig Numbers Monitoring Screenscreens allowof the parametersPhysiology ScreenThe Physiology screen displaysmost meaningfulfor monitored parameters usinga visual representation of the heart and circulatory system andtheir relevant measured volume.each clinicalsituation.Simplified graphicsoffer clear updatesof your patient’shemodynamic status.create a gauge from the graphical
continuous monitoring up to 72 hours. Heart Reference Sensor (HRS) The ClearSight HRS automatically compensates for hydrostatic pressure changes due to height differences between finger and heart. The HRS compensates for clinician repositioning of the patient’s hand during a