Transcription
› Fact SheetWhat does SAS Enterprise Miner do?It streamlines the data mining process so you can create accurate predictive anddescriptive analytical models using vast amounts of data. Our customers use this software to detect fraud, minimize risk, anticipate resource demands, reduce asset downtime, increase response rates for marketing campaigns and curb customer attrition.Why is SAS Enterprise Miner important?It offers state-of-the-art predictive analytics and data mining capabilities that enableorganizations to analyze complex data, find useful insights and act confidently to makefact-based decisions.For whom is SAS Enterprise Miner designed?It’s designed for those who need to analyze increasing volumes of data to identify andsolve critical business or research issues – and help others make well-informed decisions. This includes data miners, statisticians, marketing analysts, database marketers,risk analysts, fraud investigators, engineers, scientists and business analysts.SAS Enterprise Miner 13.1 Create highly accurate analytical models that enable you to predict with confidenceTurning increasing volumes of data intouseful information is a challenge for mostorganizations. Relationships and answersthat identify key opportunities lie buriedsomewhere in all of that data. Which customers will purchase whatproducts and when? Which customers are leaving and whatcan be done to retain them? How should insurance rates be set toensure profitability? How can you predict failures, reduceunnecessary maintenance and increaseuptime to optimize asset performance?To get answers to complex questionsand gain an edge in today’s competitivemarket, powerful advanced analyticsolutions are required. Discoveringpreviously unknown patterns can helpdecision makers across your enterprisecreate effective strategies. Those whochoose to implement SAS data mininginto their business processes will beable to stay competitive in today’sfast-moving markets.Benefits Understand key relationships and develop models intuitively and quickly. The graphical user interface makes it easy for analytic professionals to interact with informationat any point in the modeling cycle. Both analytical professionals and business analystsenjoy a common, easy-to-interpret visual view of the data mining process and can collaborate to solve the toughest challenges. Build better models more efficiently with a versatile data mining workbench. Aninteractive self-documenting process flow diagram environment shortens model development time. It efficiently maps the data mining process to produce the best possible results. Easily derive insights in a self-sufficient and automated manner. The SAS RapidPredictive Modeler enables business analysts and subject-matter experts with limitedstatistical skills to automatically generate models and act on them quickly. Analyticresults are provided in easy-to-understand charts for improved decision making. Enhance the accuracy of predictions to ensure the right decisions are made and thatbest actions are taken. Better-performing models enhance the stability and accuracyof predictions, which can be verified easily by visual model assessment and validationmetrics. Model profiling is also supported to provide an understanding of how thepredictor variables contribute to the outcome being modeled. Ease model deployment and scoring processes for faster results. SAS EnterpriseMiner automates the tedious process of scoring new data and provides completescoring code for all stages of model development. The scoring code can be deployedin a variety of real-time or batch environments. This saves time and helps you achieveaccurate results so you can make decisions that result in the most value.
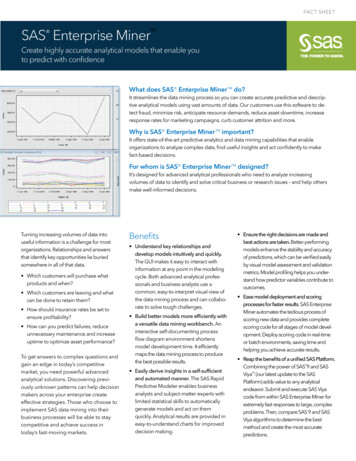
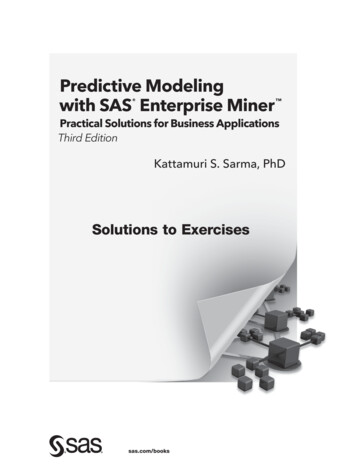
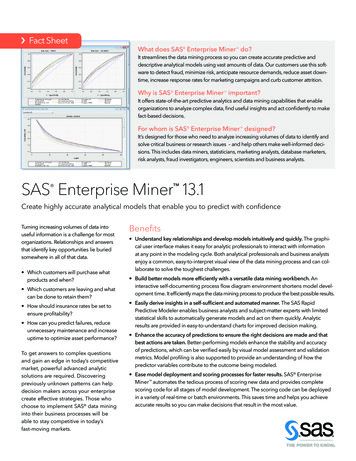
Product OverviewEveryone can benefit from incorporatinganalytics in a secure and scalablemanner. But this requires collaborationacross the organization and calls for apowerful, multipurpose data miningsolution that can be tailored to meetdifferent needs.While one analytical approach may workfine on one data collection, it may notperform well with new data sources orbe able to answer new businessquestions. This makes it crucial to havea wide selection of analysis tools athand. Different tools produce differentmodels, and only when you comparemodels side by side can you see whichdata mining approach produces thebest “fit.” If you start with a workbenchthat has limited analytical tools (e.g.,only regression or only decision trees),the end result could be a model withlimited predictive value.SAS Enterprise Miner is delivered as adistributed client/server system. Thisprovides an optimized architecture sodata miners and business analysts canwork more quickly to create accuratepredictive and descriptive models, andproduce results that can be shared andincorporated into business processes.To enhance the data mining process, thissoftware is designed to work seamlesslywith other SAS technologies, such as dataintegration, analytics and reporting.data mining package. Adding SAS TextMiner lets you analyze structured andunstructured data together for moreaccurate and complete results.Easy-to-use GUIAn easy-to-use, drag-and-drop interfaceis designed to appeal to analytic professionals. The advanced analytic algorithmsare organized under core tasks that areperformed in any successful data miningendeavor. The SAS data mining processencompasses five primary steps: sampling, exploration, modification, modelingand assessment (SEMMA). In each step,you perform an array of actions as thedata mining project develops. Bydeploying nodes from the SEMMAtoolbar, you can apply advanced statistics, identify the most significant variables,transform data elements with expressionbuilders, develop models to predictoutcomes, validate accuracy and generate a scored data set with predictedvalues to deploy into your operationalapplications.A quick, easy and self-sufficientway to generate modelsSAS Rapid Predictive Modeler automatically steps nontechnical users through aworkflow of data mining tasks (e.g.,transforming data, selecting variables,fitting a variety of algorithms andassessing models) to quickly generatepredictive models for a wide range ofbusiness problems. SAS Rapid PredictiveModeler is a SAS Enterprise Guide orSAS Add-In for Microsoft Office (MicrosoftExcel only) task and uses prebuilt SASEnterprise Miner modeling steps. Acollaborative approach allows modelsdeveloped using SAS Rapid PredictiveModeler to be customized by analyticprofessionals using SAS Enterprise Miner.Both classical and modernmodeling techniquesSAS Enterprise Miner provides superioranalytical depth with a suite of statistical,data mining and machine learningalgorithms. Decision trees, bagging andboosting, time series data mining, neuralnetworks, memory-based reasoning,hierarchical clustering, linear and logisticregression, associations, sequence andweb path analysis are all included. Andmore. The breadth of analytical algorithms extends to industry-specificalgorithms such as credit scoring, andstate-of-the-art methods such as gradientboosting and least angular regressionsplines.An integrated, complete view ofyour dataData mining is most effective when it ispart of an integrated information deliverystrategy – one that includes data gathered from hugely diverse enterprisesources. Call center logs, survey results,customer feedback forms, web data, timeseries data and transactional point-of-saledata can all be combined and analyzedwith the industry’s most sophisticatedFigure 1: Perform principal component analysis for dimension reduction, a frequent intermediatestep in the data mining process.
Sophisticated data preparation,summarization and explorationPreparing data is a time-consumingaspect of all data mining endeavors. Apowerful set of interactive data preparation tools is available for addressingmissing values, filtering outliers anddeveloping segmentation rules. Coredata preparation tools include fileimporting and appending, and mergingand dropping variables. Extensivedescriptive summarization features andinteractive exploration tools let evennovice users examine large amounts ofdata in dynamically linked, multidimensional plots. This produces quality datamining results tailored and optimallysuited to specific business problems.Business-based model comparisons, reporting and managementAssessment features let you comparemodels to identify the ones that producethe best lift and overall ROI. Modelsgenerated with different algorithms canbe evaluated consistently using a highlyvisual assessment interface. Data minerscan discuss results with business domainexperts for improved collaboration andbetter results. An innovative Cutoff nodeexamines posterior probability distributions to define the optimal actions forsolving the business problem at hand.Open, extensible design providesflexibilityThe customizable environment of SASEnterprise Miner provides the ability toadd tools and include personalized SAScode. Existing SAS models developedoutside of the SAS Enterprise Minerenvironment can be integrated easily intothe process flow environment whilemaintaining full control of each syntaxstatement. The Extension node includesinteractive editor features for training andscore codes. Users can edit and submitcode interactively while viewing the logand output listings. Default selection listscan be extended with custom-developedtools written with SAS code or XML logic,which opens the entire world of SAS todata miners.Parallelized grid-enabledworkbenchYou can now easily integrate R languagecode inside of a SAS Enterprise Minerprocess flow diagram. This enables youto perform data transformation andexploration as well as training andscoring supervised and unsupervisedmodels in R. You can then seamlesslyintegrate the results, assess your Rmodel and compare it to modelsgenerated by SAS Enterprise Miner.Scale from a single-user system to verylarge enterprise solutions with the Javaclient and SAS server architecture.Powerful servers can be dedicated tocomputing, while users move from officeto home to remote sites without losingaccess to mining projects or services.Many process-intensive tasks, such asdata sorting, summarization, variableselection and regression modeling, aremultithreaded, and processes can be runin parallel for distribution and workloadbalancing across a grid of servers orscheduled for batch processing.In-database and in-Hadoopscoring delivers faster resultsDistributable data miningsystem suited for enterprisesScoring is the process of regularlyapplying a model to new data forimplementation into an operationalenvironment. This can be tedious,especially when it entails manuallyrewriting or converting code, whichdelays model implementation and canintroduce potentially costly errors. SASEnterprise Miner automatically generatesscore code in SAS, C, Java and PMML.The scoring code can be deployed in avariety of real-time or batch environments within SAS, on the web, or directlyin relational databases or Hadoop.SAS Enterprise Miner is deployable via athin-client web portal for distribution tomultiple users with minimal maintenanceof the clients. Alternatively, the completesystem can be configured on a standalone PC. SAS Enterprise Miner supportsWindows servers and UNIX platforms,making it the software of choice fororganizations with large-scale datamining projects. Model result packagescan be created and registered to the SASMetadata Server for promotion to SASModel Manager, SAS Data IntegrationStudio (a component of SAS DataIntegration) and SAS Enterprise Guide.Open Source Integration nodeCombined with a SAS Scoring Accelerator (available for Hadoop, PivotalGreenplum, DB2, IBM Netezza, Oracle,Teradata and SAS Scalable PerformanceData Server), SAS Enterprise Minermodels can be published as databasespecific scoring functions for executiondirectly in the database. Results can bepassed to other SAS solutions fordeployment of data mining results intoreal-time operational environments.High-performance data miningA select set of high-performance datamining nodes is included in SAS EnterpriseMiner. Depending on the data andcomplexity of analysis, users may findperformance gains in a single-machineSMP mode. In the future, as you need toprocess big data faster, a separatelicensable product, SAS High-PerformanceData Mining, lets you develop timely andaccurate predictive models. High-performance data mining procedures areavailable for those who prefer a codingenvironment. Many options are providedfor complete customization of your datamining programs. For more details, visitsas.com/hpdatamining.
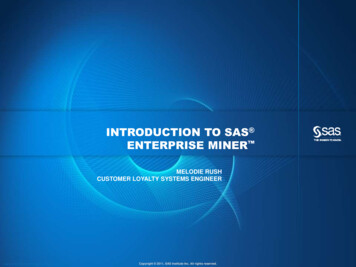
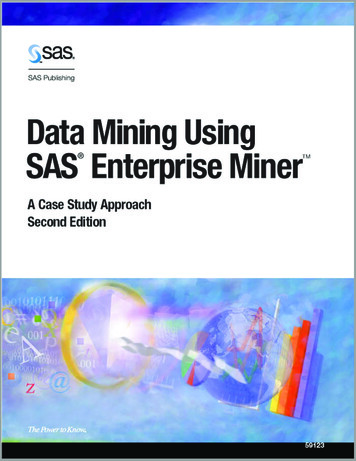
Key FeaturesIntuitive interfaces Easy-to-use GUI for building process flow diagrams: Build more, better models faster. Deliverable via the web. Access the SAS programmingenvironment. Provides XML diagram exchange. Reuse diagrams as templates forother projects or users. Directly load a specific data mining project or diagram, or choosefrom a Project Navigator tree thatcontains the most recent projectsor diagrams. Batch processing (program development interface): Encapsulates all features of theGUI. SAS macro based. Embed training and scoring processes into customized applications.Scalable processing Server-based processing. Grid computing, in-database andin-memory processing options. Asynchronous model training. Ability to stop processing cleanly. Parallel processing – run multipletools and diagrams concurrently. Multithreaded predictive algorithms. All storage located on servers.Accessing and managing data Access and integrate structuredand unstructured data sources,including time series data, marketbaskets, web paths and survey dataas candidate predictors. File Import node for easy access toMicrosoft Excel, comma-delimitedfiles, SAS and other common fileformats. Support for variables with specialcharacters. SAS Library Explorer and LibraryAssignment wizard.Figure 2: Within the SAS Enterprise Miner GUI, the process flow diagram is a self-documentingtemplate that can be easily updated or applied to new problems and shared with modelers orother analysts. Enhanced Explorer window toquickly locate and view tablelistings or develop a plot usinginteractive graph components. Drop Variables node. Merge Data node. Append node. Filter outliers: Apply various distributionalthresholds to eliminate extremeinterval values. Combine class values with fewerthan n occurrences. Interactively filter class andnumeric values. Metadata node for modifyingcolumns metadata such as role,measurement level and order. Integrated with SAS Data IntegrationStudio, SAS Enterprise Guide, SASModel Manager and SAS Add-Infor Microsoft Office through SASMetadata Server: Build training tables for mining. Deploy scoring code.Sampling Simple random. Stratified. Weighted. Cluster.Systematic.First N.Rare event sampling.Stratified and event-level samplingin Teradata 13.Data partitioning Create training, validation and testdata sets. Ensure good generalization of yourmodels through use of holdout data. Default stratification by the classtarget. Balanced partitioning by any classvariable. Output SAS tables or views.Transformations Simple: log, log 10, square root, inverse,square, exponential and standardized. Binning: bucketed, quantile and optimalbinning for relationship to target. Best power: maximize normality,maximize correlation with target andequalize spread with target levels. Interactions editor: define polynomialand nth degree interaction effects.
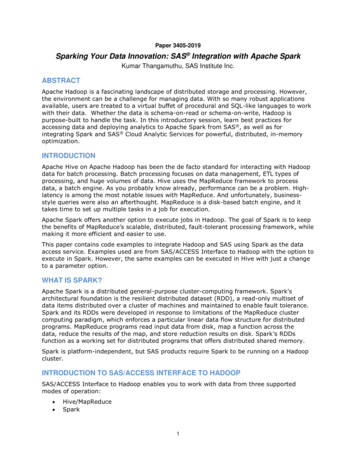
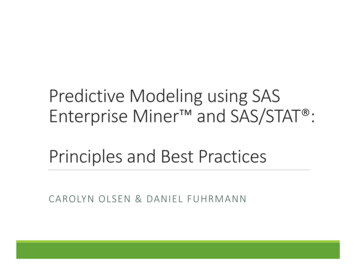
Interactively define transformations: Define customized transformationsusing the Expression Builder orSAS code editor. Compare the distribution of the newvariable with the original variable. Predefine global transformationcode for reuse.Interactive variable binning Quantile or bucket. Gini variable selection. Handle missing values as separategroup. Fine and coarse classing detail. Profile bins by target. Modify groups interactively. Save binning definitions.Rules Builder node Create ad hoc data-driven rules andpolicies. Interactively define the value of theoutcome variable and paths to theoutcome. Statistics breakdown for eachlevel of the class target.Bivariate statistics and plots: Ordered Pearson and Spearmancorrelation plot. Ordered chi-square plot with option for binning continuous inputsinto nbins. Coefficient of variation plot.Variable selection by logworth.Other interactive plots: Variable worth plot ranking inputsbased on their worth with thetarget. Class variable distributions acrossthe target and/or the segmentvariable.Scaled mean deviation plots.Graphs/visualization Batch and interactive plots: scatter,matrix, box, constellation, contour,needle, lattice, density and multidimensional plots; 3-D, pie and areabar charts; and histograms. Segment profile plots: Interactively profile segments ofdata created by clustering andmodeling tools. Easily identify variables thatdetermine the profiles and thedifferences between groups. Easy-to-use Graphics Explorerwizard and Graph Explore node: Create titles and footnotes. Apply a WHERE clause. Choose from color schemes. Easily rescale axes. Surface the underlying data fromstandard SAS Enterprise Minerresults to develop customizedgraphics. Plots and tables are interactivelylinked, supporting tasks such asbrushing and banding.Data replacement Measures of centrality.Distribution-based.Tree imputation with surrogates.Mid-medium spacing.Robust M-estimators.Default constant.Replacement Editor: Specify new values for classvariables. Assign replacement values forunknown values. Interactively cap extreme intervalvalues to a replacement threshold.Descriptive statistics Univariate statistics and plots: Interval variables: n, mean, median,min, max, standard deviation, scaleddeviation and percent missing. Class variables: number of categories, counts, mode, percent modeand percent missing. Distribution plots.Figure 3: Develop customized transformations using the interactive Transform Variablesnode Expression Builder.
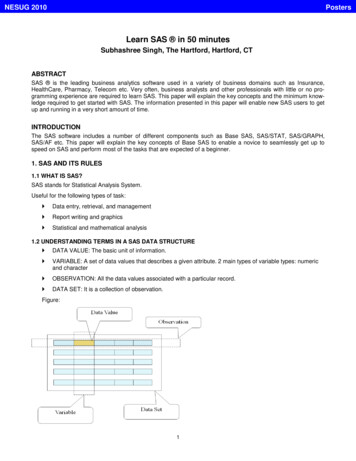
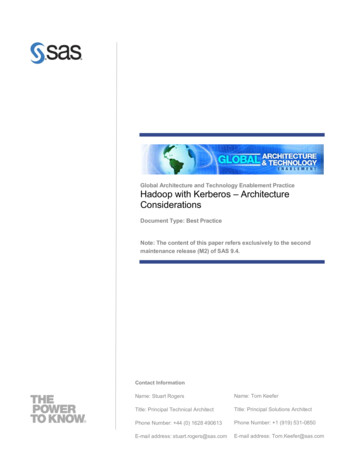
Data and plots can be easily copiedand pasted into other applicationsor saved as BMP files. Interactive graphs are automaticallysaved in the Results window of thenode.Clustering and self-organizingmaps Clustering: User defined or automaticallychooses the best clusters. Several strategies for encodingclass variables into the analysis. Handles missing values. Variable segment profile plotsshow the distribution of theinputs and other factors withineach cluster. Decision tree profile uses theinputs to predict cluster membership. PMML score code. Self-organizing maps: Batch SOMs with NadarayaWatson or local-linear smoothing. Kohonen networks. Overlay the distribution of othervariables onto the map. Handles missing values.Market basket analysis Associations and sequence discovery: Grid plot of the rules ordered byconfidence. Expected confidence versusconfidence scatter plot. Statistics line plot of the lift, confidence, expected confidence andsupport for the rules. Statistics histogram of the frequency counts for given rangesof support and confidence. Rules description table. Network plot of the rules. Interactively subset rules basedon lift, confidence, support, chainlength, etc. Seamless integration of rules withother inputs for enriched predictivemodeling.Figure 4: Use link analysis to evaluate relationships between nodes to visually discovernew patterns. Hierarchical associations: Derive rules at multiple levels. Specify parent and child mappingsfor the dimensional input table.Web path analysis Scalable and efficient mining of themost frequently navigated paths fromclickstream data. Mine frequent consecutive subsequences from any type of sequencedata.Link analysis Converts data into a set of interconnected linked objects that can bevisualized as a network of effects. Provides a visual model of how twovariables’ levels in relational data orbetween two items’ conoccurrence intransactional data are linked. Provides centrality measures andcommunity information to understandlinkage graphs. Provides weighted confidence statistics to provide next-best offer information. Generates cluster scores for datareduction and segmentation.Dimension reduction Variable selection: Remove variables unrelated totarget based on a chi-square orR2 selection criterion. Remove variables in hierarchies. Remove variables with manymissing values. Reduce class variables with alarge number of levels. Bin continuous inputs to identifynonlinear relationships. Detect interactions. Least Angle Regression (LARS)variable selection: AIC, SBC, Mallows C(p), crossvalidation and other selectioncriteria. Plots include: parameter estimates, coefficient paths, iterationplot, score rankings and more. Generalizes to support LASSO(least absolute shrinkage andselection operator). Supports class inputs and targetsas well as continuous variables. Score code generation. Principal components: Calculate Eigenvalues andEigenvectors from correlation andcovariance matrices.
Plots include: principal components coefficients, principalcomponents matrix, Eigenvalue,Log Eigenvalue and CumulativeProportional Eigenvalue. Interactively choose the numberof components to be retained. Mine selected principal components using predictive modelingtechniques.Variable clustering: Divide variables into disjoint orhierarchical clusters. Eigenvalue or principal components learning. Includes class variable support. Dendrogram tree of the clusters. Selected variables table withcluster and correlation statistics. Cluster network and R-squareplot. Interactive user override ofselected variables.Time series mining: Reduce transactional data intoa time series using severalaccumulation methods andtransformations.Analysis methods include seasonal,trend, time domain, and seasonaldecomposition.Mine the reduced time series usingclustering and predictive modelingtechniques. Macro variables to reference datasources, variables, etc. Interactive code editor and submit. Separately manage training, scoring and reporting code. SAS Output and SAS LOG. Create graphics.Consistent modeling features Select models based on either thetraining, validation (default) or testdata using several criteria such asprofit or loss, AlC, SBC, averagesquare error, misclassification rate,ROC, Gini, or KS (KolmogorovSmirnov). Incorporate prior probabilities intothe model development process. Supports binary, nominal, ordinaland interval inputs and targets. Easy access to score code and allpartitioned data sources. Display multiple results in one window to help better evaluate modelperformance. Decisions node for setting targetevent and defining priors andprofit/loss matrices.Regression Linear and logistic. Stepwise, forward and backwardselection. Equation terms builder: polynomials, general interactions, and effecthierarchy support. Cross-validation. Effect hierarchy rules. Optimization techniques include:Conjugate Gradient, DoubleDogleg, Newton-Raphson with LineSearch or Ridging, Quasi-Newtonand Trust Region. Dmine Regression node: Fast forward stepwise leastsquares regression. Optional variable binning todetect nonlinear relationships. Optional class variable reduction. Include interaction terms. In-database modeling for Teradata 13. PMML score code.Decision trees Methodologies: CHAID, classification andregression trees, bagging andboosting, gradient boosting,and bootstrap forest. Tree selection based on profitor lift objectives and pruneaccordingly. K-fold cross-validation. Splitting criterion: Prob Chi-squaretest, Prob F-test, Gini, Entropy andvariance reduction.SAS Code node Write SAS code for easy-to-complex data preparation and transformation tasks. Incorporate procedures from otherSAS products. Develop custom models. Create SAS Enterprise Miner extension nodes. Augment score code logic. Support for SAS procedures. Batch code uses input tables ofdifferent names and locations. Batch code now integrates project-start code that you can use todefine libraries and options. Easy-to-use program development interface:Figure 5: Integrate customized SAS code to create variable transformations, incorporateSAS procedures, develop new nodes, augment scoring logic, tailor reports and more.
Switch targets for designing multiobjective segmentation strategies. Automatically output leaf IDs asinputs for modeling and groupprocessing. Displays English rules. Calculates variable importance forpreliminary variable selection andmodel interpretation. Display variable precision values inthe split branches and nodes. Unique consolidated tree maprepresentation of the tree diagram. Interactive tree capabilities: Interactive growing/pruningof trees; expand/collapse treenodes. Incorporates validation data toevaluate tree stability. Define customized split points,including binary or multiwaysplits. Split on any candidate variable. Copy split. Tables and plots are dynamicallylinked to better evaluate the treeperformance. Easy-to-print tree diagrams ona single page or across multiplepages. Interactive subtree selection. User-specified display of text andstatistics in the Tree node. User-controlled sample size withininteractive trees. Based on the fast ARBORETUMprocedure. PMML score code.Neural networks Neural Network node: Flexible network architectureswith combination and activationfunctions. 10 training techniques. Preliminary optimization. Automatic standardization ofinputs. Supports direction connections. Autoneural Neural node: Automated multilayer perceptron building searches foroptimal configuration.Figure 6: Fit highly complex nonlinear relationships using the Neural Network node. Type and activation functionselected from four different typesof architectures. PMML score code. DM Neural node: Model building with dimensionreduction and function selection. Fast training; linear and nonlinearestimation.Partial Least Squares node Especially useful for extractingfactors from a large number ofpotential correlated variables. Performs principal componentsregression and reduced rankregression. User or automated selection of thenumber of the factors. Choose from five cross-validationstrategies. Supports variable selection.Rule induction Recursive predictive modelingtechnique. Especially useful for modeling rareevents.Two-stage modeling Sequential and concurrent modeling for both the class and intervaltarget. Choose a decision tree, regressionor neural network model for eachstage. Control how the class prediction isapplied to the interval prediction. Accurately estimate customervalue.Memory-based reasoning k-nearest neighbor technique tocategorize or predict observations. Patented Reduced DimensionalityTree and Scan.Model ensembles Combine model predictions toform a potentially better solution. Methods include: Averaging, Voting and Maximum.Open Source Integration node Write code in the R languageinside of SAS Enterprise Miner.
SAS Enterprise Miner data andmetadata are available to your Rcode with R results returned to SASEnterprise Miner. Train and score supervised andunsupervised R models. The nodeallows for data transformation andexploration. Generate model comparisons andSAS score code for supportedmodels. Incremental response/net liftmodels Net treatment vs. control models.Binary and interval targets.Stepwise selection.Fixed or variable revenue calculations.Net information value variableselection.User can specify the treatmentlevel of the treatment variable.User can specify a cost variable inaddition to a constant cost.Penalized Net Information Value(PNIV) for variable selection.Separate model selection optionsavailable for an incremental salesmodel. Hierarchical clustering using thesimilarity matrix with dendrogram results. Constellation plot for evaluatingthe clusters.Exponential smoothing: Control weights decay using oneor more smoothing parameters. Best-fitting smoothing method(simple, double, linear, dampedtrend, seasonal or Winters’method) is selected automatically.Dimension reduction: Supports five time series dimension reduction techniques:Discrete Wavelet Transform,Discrete Fourier Transform,Singular Value Decomposition,Line Segment Approximationwith the Mean, and Line Segment Approximation with theSum.Cross-correlation: Provides autocorrelation andcross-correlation analysis fortime-stamped data. The Time Series Correlationnode outputs time-domainstatistics based on whether autocorrelation or cross-correlation isperformed.Seasonal decomposition.Survival analysis Discrete time to event regressionwith additive logistic regression. Event probability for time effect ismodeled using cubic splines. Users can now enter the cubicspline basis functions as part ofthe stepwise variable selectionprocedure in addition to the maineffects. User-defined time intervals forspecifying how to analyze the dataand handle censoring. Automatically expands the datawith optional sampling. Supports non-time varying covariates. Computes survival function withholdout validation. Generates competing risks or subhazards. Score code generation with meanresidual life calculation. Users can enter the cubic splinebasis functions as part of the stepwise variable selection procedurein addition to the main effects. Incorporate time-varying covariatesinto the analysis with user-specifieddata formats, including standard,change-time and fully expanded. Users can specify left-truncationand censor dates.Time series data mining Time series data preparation: Aggregate, transform andsummarize transactional andsequence data. Automatically transpose thetime series to support similarityanalysis, clustering and predictivemodeling. Process data with or withoutTimeID variables. Similarity analysis: Useful for new product forecasting, patter
SAS Rapid Predictive Modeler is a SAS Enterprise Guide or SAS Add-In for Microsoft Office (Microsoft Excel only) task and uses prebuilt SAS Enterprise Miner modeling steps. A collaborative approach allows models developed using SAS Rapid Predictive Modeler to be customized by analytic p