Transcription
(2021) 16:109Wu et al. Chin se MedicineOpen AccessRESEARCHExploring biological basis of Syndromedifferentiation in coronary heart diseasepatients with two distinct Syndromesby integrated multi‑omics and networkpharmacology strategyGaosong Wu1† , Jing Zhao1†, Jing Zhao2†, Nixue Song3,4†, Ningning Zheng1, Yuanyuan Zeng2,Tingting Yao2, Jingfang Zhang2, Jieqiong Weng2, Mengfei Yuan2, Hu Zhou3,4, Xiaoxu Shen2*, Houkai Li1* andWeidong Zhang1,5*AbstractBackground: Traditional Chinese Medicine (TCM) is distinguished by Syndrome differentiation, which prescribes various formulae for different Syndromes of same disease. This study aims to investigate the underlying mechanism.Methods: Using a strategy which integrated proteomics, metabolomics study for clinic samples and network pharmacology for six classic TCM formulae, we systemically explored the biological basis of TCM Syndrome differentiationfor two typical Syndromes of CHD: Cold Congealing and Qi Stagnation (CCQS), and Qi Stagnation and Blood Stasis(QSBS).Results: Our study revealed that CHD patients with CCQS Syndrome were characterized with alteration in pantothenate and CoA biosynthesis, while more extensively altered pathways including D-glutamine and D-glutamatemetabolism; alanine, aspartate and glutamate metabolism, and glyoxylate and dicarboxylate metabolism, werepresent in QSBS patients. Furthermore, our results suggested that the down-expressed PON1 and ADIPOQ mightbe potential biomarkers for CCQS Syndrome, while the down-expressed APOE and APOA1 for QSBS Syndrome inCHD patients. In addition, network pharmacology and integrated analysis indicated possible comorbidity differencesbetween the two Syndromes, that is, CCQS or QSBS Syndrome was strongly linked to diabetes or ischemic stroke,respectively, which is consistent with the complication disparity between the enrolled patients with two different*Correspondence: jhxiaoxushen@163.com; hk li@shutcm.edu.cn;wdzhangy@hotmail.com†Gaosong Wu, Jing Zhao, Jing Zhao and Nixue Song contributed equallyto this work1Institute of Interdisciplinary Integrative Medicine Research, ShanghaiUniversity of Traditional Chinese Medicine, No. 1200 Cai Lun Road,Pudong New District, Shanghai 201203, China2Dongzhimen Hospital Affiliated to Beijing University of ChineseMedicine, No. 5 Haiyuncang, Dongcheng District, Beijing 100700, ChinaFull list of author information is available at the end of the article The Author(s) 2021. Open Access This article is licensed under a Creative Commons Attribution 4.0 International License, whichpermits use, sharing, adaptation, distribution and reproduction in any medium or format, as long as you give appropriate credit to theoriginal author(s) and the source, provide a link to the Creative Commons licence, and indicate if changes were made. The images orother third party material in this article are included in the article’s Creative Commons licence, unless indicated otherwise in a credit lineto the material. If material is not included in the article’s Creative Commons licence and your intended use is not permitted by statutoryregulation or exceeds the permitted use, you will need to obtain permission directly from the copyright holder. To view a copy of thislicence, visit http:// creat iveco mmons. org/ licen ses/ by/4. 0/. The Creative Commons Public Domain Dedication waiver (http:// creat iveco mmons. org/ publi cdoma in/ zero/1. 0/) applies to the data made available in this article, unless otherwise stated in a credit line to the data.
Wu et al. Chin Med(2021) 16:109Page 2 of 21Syndromes. These results confirmed our assumption that the molecules and biological processes regulated by theSyndrome-specific formulae could be associated with dysfunctional objects caused by the Syndrome of the disease.Conclusion: This study provided evidence-based strategy for exploring the biological basis of Syndrome differentiation in TCM, which sheds light on the translation of TCM theory in the practice of precision medicine.Highlights1. Our work was based on clinical samples rather than pure data analysis or animal models.2. We conducted multiple omics studies. Especially, as for metabolomics study, we performed both untargeted andtargeted metabolomics experiments.3. We performed network pharmacological study to cross-validated the results of multi-omics study. Although thedata sources of network pharmacology were completely unrelated with our omics data, they came to the same conclusion about the difference of the two Syndromes.4. In the network pharmacological study, we made efforts to collect and screen high-quality data. We collected datafrom multiple TCM databases and conducted drug likeness screening. Especially, we added quality markers of eachherb, whose pharmacological relevance had been validated. To enhance the reliability of targets, for each Syndrome,we only studied common targets of 3 different TCM formulae prescribed for this Syndrome.Keywords: Coronary heart disease, Syndrome differentiation, Traditional Chinese Medicine, Proteomics,Metabolomics, Network pharmacologyBackgroundTraditional Chinese medicine (TCM) has developed overthousands of years in China, in which the medication ismainly practiced in the form of TCM formula based onSyndrome (ZHENG in Chinese) differentiation by TCMphysicians [1, 2]. Syndrome differentiation (Bian ZhengLun ZHI in Chinese) means comprehensive analysis ofclinical information from standpoint of TCM, includingpulse manifestation, tongue appearances, clinical indicators, and symptoms. Usually, same disease diagnosed byorthodox medical methods could have different TCMSyndromes. For example, in TCM diagnosis, rheumatoidarthritis is classified as the types of cold Syndrome andheat Syndrome [3, 4], coronary heart disease is categorized as several Syndromes, including heart-blood stasis,Qi stagnation and blood stasis, Qi deficiency and bloodstasis, as well as Cold Congealing and Qi Stagnation [5].Hence different TCM formulae were prescribed for different Syndromes of the same disease. Correct TCMSyndrome differentiation is the most important basis forprescribing TCM formulae. A pioneer study has illustrated the features of hot and cold Syndrome of arthritisin the context of neuro-endocrine-immune network [4].However, it is still an enormous challenge for elucidatingthe scientific basis of TCM Syndrome differentiation inthe context of modern biomedical science.Coronary heart disease (CHD) lists the first positionin mortality in the world, which includes four classes,i.e. nonobstructive coronary atherosclerosis, unstable angina pectoris, stable angina pectoris, and acutemyocardial infarction [6]. Meanwhile, several types oftypical TCM Syndromes have been well-establishedin TCM theory, such as Cold Congealing and Qi Stagnation (CCQS), and Qi Stagnation and Blood Stasis(QSBS), etc. [5, 7]. Although the patient stratification ofCHD with different Syndromes is practical for “precisetherapy” with diversified formula in TCM, the scientificbasis for Syndrome differentiation of CHD is poorlyunderstood so far. Considering that a TCM formula isprescribed according to a specific Syndrome, we thinkthat the molecules and biological processes regulatedby the formula could be associated with dysfunctionalmolecules and biological processes caused by the Syndrome of the disease. Hence, investigating the mechanism of the TCM formula may facilitate the illustrationfor the scientific basis of TCM Syndrome differentiation. Network pharmacology has been widely andeffectively applied in the study for the mode of actionof TCM formulae [8–10]. In this sense, the strategyof systems biology is highly valued for its potential inelucidating the mechanism of TCM Syndrome by integrating multi-omics approaches and network pharmacology [5, 11–13]. For example, Ding et al. investigatedthe holistic mechanism of Ge-Gen-Qin-Lian decoction in LPS-induced acute lung injury mice by usinga systems biology strategy including transcriptomics,metabolomics and network pharmacology, in which anovel PI3K/Akt signaling pathway was predicted andvalidated [12]. Previously, we systematically exploredthe mechanisms underlying the 8 clinically used TCM
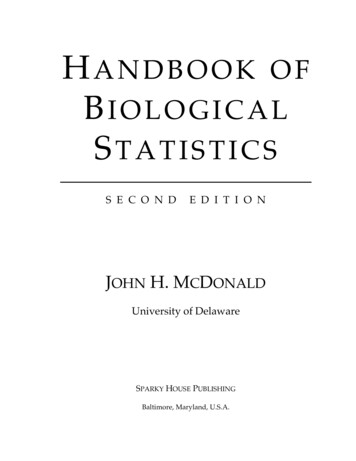
Wu et al. Chin Med(2021) 16:109formula for the treatment of CHD patients with different Syndromes by using network pharmacology andmachine learning [5]. In the study, a series of commonand Syndrome-related signaling pathways and molecular targets of CHD were determined. However, thecomputation-based analytic results were not experienced experimental validation.In our current study, an integrated multi-omics andnetwork pharmacology strategy was proposed for elucidating the scientific basis of patient stratification ofTCM Syndrome in a group of patients with CHD whowere also diagnosed as either CCQS or QSBS Syndrome by TCM physicians. Between August 2018 andDecember 2019, we collected serum samples of 111participants, including 44 CHD patients with CCQSSyndrome, 37 with QSBS Syndrome and 30 healthypeople from the Cardiology Clinic of DongzhimenHospital affiliated to Beijing University of ChineseMedicine and the neighboring communities in Beijing. The blood samples were then used in metabolomics and proteomics studies. Pathways involved inthe pathologic process of the two Syndromes were discovered by functional annotation of differential proteins and metabolites. For each of the two Syndromes,we selected 3 classic TCM formulae clinically used forPage 3 of 21the treatment of the Syndrome. The common putativetargets of the 3 formulae were considered as featuretargets of the Syndrome and used for network pharmacological study and integrated analysis with omicsdata. At last, we identified key biological processes andmolecules that may associated with the occurrence anddevelopment of the two Syndromes of CHD.Materials and methodsIntegrated multi‑omics and network pharmacologyresearch strategyThe workflow of the study is illustrated in Fig. 1. First,clinical CHD patients were enrolled who were diagnosedas either CCQS or QSBS Syndrome by TCM physicianssimultaneously. Serum samples of patients with eitherCCQS or QSBS and healthy controls were analyzed withmetabolomics and proteomics. Second, network pharmacology was performed based on 6 typical TCM formulaewhich were extensively used for the treatment of eitherCCQS or QSBS Syndrome of CHD patients in clinic.Third, a cross validation was performed between networkpharmacology and results from both metabolomics andproteomics to characterize the basis of both CCQS andQSBS Syndromes of CHD patients.Fig. 1 The flowchart of the integrated multi-omics and network pharmacology strategy of our current study
Wu et al. Chin Med(2021) 16:109Page 4 of 21ParticipantsDiagnosis of TCM syndromeThis study was conducted in compliance with the Declaration of Helsinki and the requirements of clinicaltrials by the Drug Administration Law of the People’sRepublic of China in Dongzhimen Hospital, Beijingbetween August 2018 and December 2019. The protocol and informed consent were reviewed and approvedby the Beijing University of Chinese Medicine ClinicalTrials and Biomedical Ethics Committee (No. DZMECKY-2019–121). Informed consent was obtained from allparticipants and their privacy rights were always preserved. All patients were enrolled by the CardiologyClinic of Beijing University of Chinese Medicine or thesurrounding communities in Beijing. Whether it meetsthe inclusion criteria (CCQS and QSBS Syndrome ofCHD) is determined by an expert (Xiaoxu Shen, ChiefPhysician of Cardiovascular Medicine Dept in Dongzhimen Hospital), with verification by two assistants(Yuanyuan Zeng and Jing Zhao).According to the “Guiding Principles for ClinicalResearch of New Chinese Medicines”, the diagnosticcriteria for Syndromes were determined as follows:Diagnostic criteria for CCQS Syndrome: primarysymptoms include chest tightness, chest pain. First setof secondary symptoms includes the condition or painaggravates on rainy days or cold, face pale, like warmthand fear of cold, cold limbs, cramps and pain. Secondset of secondary symptoms includes heart palpitations,fullness of the chest and flanks, fullness of the abdominal abdomen. The tongue is pale or dark, and thetongue coating is white. Late or tight pulse.Diagnostic criteria for QSBS Syndrome: primarysymptoms include chest tightness, chest pain. First setof secondary symptoms includes that the condition isrelated to emotions, emotional depression, irritability,sigh, and chest fullness; The second set of secondarysymptoms includes palpitations, rough, dry, and hyperkeratotic skin, sublingual varicose veins, dark purpleface and lips, dark purple tongue or petechiae, andastringent pulse.Those who have one of the primary symptoms, one ormore of the first and second set of secondary symptomsat the same time, and the tongue and pulse conditionsare consistent, can be diagnosed. In the diagnosis process, three researchers (at least one senior professionaltitle) independently differentiated syndromes at thesame time and then determined the types of syndromestogether.Diagnosis criteriaDiagnostic criteria for CHD referred to the “Diagnostic Criteria for Coronary Heart Disease” defined by theInternational Society of Cardiology and Associationand the World Health Organization in 1979: (1) With ahistory of typical angina pectoris or myocardial infarction, except for valvular heart disease, coronary embolism and cardiomyopathy; (2) Patients over the age of40 for men and over 45 for women, the ECG myocardialischemia in resting state, or the treadmill exercise test ispositive, without other reasons (various heart disease,autonomic dysfunction, significant anemia, obstructivelung Emphysema, taking digitalis, electrolyte disturbances); (3) Among the risk factors of coronary heartdisease, two of the three items of hypertension, diabetes and hyperlipidemia can be clinically diagnosed forcoronary heart disease. Or coronary angiography orcoronary CT scan shows that at least one main branchvessel has a stenosis greater than 50% to confirm thediagnosis of coronary heart disease. In this study wemainly selected patients with stable angina while satisfying the diagnosis of coronary heart disease. They arecharacterized by paroxysmal squeezing pain or suffocation in the anterior chest, mainly located at the backof the sternum, which can radiate to the anterior heartarea and left upper limb. The ulnar side usually occurswhen the labor load increases and lasts for a few minutes. The pain disappears after resting or using nitrateester preparations. The degree, frequency, nature, andpredisposing factors of pain episodes did not changesignificantly within weeks to months.Included criteriaPatients meeting the diagnostic criteria were potentially eligible for the study if they meet the followingcriteria: (1) age at 18 to 85 years old; (2) clearly diagnosed as angina pectoris, and are classified as CCQS orQSBS in the chest pain of TCM after the doctor’s differentiation witness; (3) the included patients have stablevital signs, clear consciousness, and certain expressionskills; (4) voluntary submission of written informedconsent prior to enrollment.Excluded criteriaPatients would be excluded if they meet one of the following criteria: (1) those who have had myocardialinfarction within 3 months or have undergone coronaryrevascularization; (2) patients with other serious heartdiseases: such as valvular heart disease, hypertrophiccardiomyopathy, severe arrhythmia (such as rapid atrialfibrillation, II–III degree atrioventricular block, etc.),severe cardiac insufficiency; (3) patients with severeliver and kidney dysfunction; (4) pregnant and lactating
Wu et al. Chin Med(2021) 16:109women; (5) those who use traditional Chinese medicinedecoctions and related preparations within 2 weeks; (6)those who have participated in other drug clinical trialswithin 2 weeks.Proteomics studySample preparationSerum proteins were prepared by in solution digestionmethod. All samples were randomly divided into 11experimental groups. A standard sample was added toeach experimental group and prepared at the same time.We processed one set of samples (including a standardsample) per day and all samples and standard sampleswere prepared within 11 days. In brief, lysis solution wasadded into the collected human serum samples. ThenDTT and IAA were added. After this procedure, weadded precipitation buffer and placed it in -20 refrigerator overnight. The cold concentrate containing proteinswas centrifugated and then removed the supernatant.Pre-cooled 100% acetone was added into the precipitated proteins and removed by centrifugating. Then precooling 70% ethanol was added into the proteins and theprocedure was same as before. The above two steps wererepeated twice. Proteins were resuspended with 100 mM NH4HCO3 solution and digested with trypsin (Promega,USA). Peptides were collected with 10 kDa filter (Millipore Corporation, USA).Protein digestionEqual volume of all human serum samples was pooled forthe generation of a spectral library. The pooled samplewas depleted by High-Select Top14 Abundant ProteinDepletion Resin (Thermo Fisher). The sample with abundant proteins removed was further digested by trypsinwith the in-solution digestion method. Digested peptides were desalted and fractionated through the highpH reverse phase liquid chromatography using a WatersXBridge BEH300 C18 3.5 μm 2.1 150 mm column onAgilent 1200 LC instrument using an 85-min gradient.Online nanoflow LC–MS/MS analysisEASYnLC 1000 HPLC system (Thermo Fisher Scientific)and Q Exactive HF mass spectrometer (Thermo FisherScientific) were used for LC–MS/MS analysis. The collected peptides were separated on a home-made column (75 200 mm, packed with 3.0 μm ReproSil-PurC18 beads, Dr. Maisch GmbH, Ammerbuch, Germany).Each fractionation of peptides for spectral library generation was analyzed with data dependent acquisition(DDA) mode and separated with a 120-min gradient.For DIA analysis, desalted peptides concentration wasmeasured by NanoDrop 2000 (Thermo Scientific). Thenpeptides were separated on a 70-min LC gradient. ThePage 5 of 21DIA acquisition scheme consisted of 32 variable windowsranging from 350 to 1600 m/z.Data analysisDDA data for spectral library generation were analyzedvia MaxQuant software (http:// maxqu ant. org/, version1.6.7.0). The results were imported into Spectronaut14.0 (Biognosys) for library generation. And the generated library contained 1,095 proteins and 11,871 precursors. For human serum, DIA data was processed withSpectronaut 14.0. Statistical analysis was performed inR software. Significantly differential proteins were determined using Student’s t-test with a p-value 0.05 and foldchange (FC) 1.1.Untargeted Metabolomics studySample preparationAn aliquot of 50 µl of thawed serum sample was deproteinized with 150 µl of MeOH: ACN (1:1, v/v) precooledto 20 . After vortex mixed for 30 s and sonication for10 min in an ice bath, samples were overnight at 20 to improve protein precipitation and then centrifuged at12 000 g for 15 min at 4 , 2 µl of supernatant was subjected to HPLC-QTOF-MS/MS analysis.HPLC‑QTOF‑MS/MS analysisSample analysis was performed on a Shimadzu Nexera XR LC-20AD HPLC system equipment with SCIEXTriple TOF 5 600 . In order to capture serum metaboliccharacteristics as comprehensively as possible, two different types of chromatographic columns [ACQUITYUPLC BEH amide column (2.1 150 mm, 1.7 µm) andACQUITY UPLC BEH C 18 column (2.1 100 mm,1.8 µm)] were used for untargeted metabolomics analysis.Data processing and analysisThe raw data were imported to the Progenesis QI forpeak alignment to obtain the peak area list and the identification result list. The nonparametric univariate method(Mann–Whitney-Wilcoxon test) was used to analysismetabolites that differed in abundance between the different subgroups corrected for false discovery rate (FDR)to ensure that the peak of each metabolite was reproducibly detected in the samples. Metabolites selectedas biomarker candidates for further statistical analysis were identified on the basis of variable importancein the projection (VIP) threshold of 1 from the tenfoldcross-validated OPLS-DA model, which was validatedat a univariate level with FDR 0.05. The online HDMBdata (https:// hmdb. ca/), LIPIDMAPS (https:// www. lipid maps. org/), KEGG (https:// www. kegg. jp/) and METLIN (https:// metlin. scrip ps. edu) were used to align themolecular mass data to identify metabolites.
Wu et al. Chin Med(2021) 16:109Page 6 of 21Targeted metabolomics studySample preparationChinese Medicine (ETCM) [16], Traditional ChineseMedicine Systems Pharmacology Database and AnalysisPlatform (TCMSP) [17], and the high-throughput experiment- and reference-guided database of traditional Chinese medicine (HERB) [18]. Diseases highly related withcoronary heart disease (CHD) were collected from DisGeNet database [19]. Drug classes for CHD related diseases and their Anatomical Therapeutic Chemical (ATC)codes, as well as drugs in these classes, were collectedfrom DrugBank database [20].An aliquot of 25 µl of thawed serum sample was added tothe pre-chilled 96-well plate, then added 100 µl of methanol containing internal standard (IS) vortex for 5 min,and finally centrifuged at 4000 g for 30 min at 4 . Thesupernatant (30 µl) was transferred into a new 96-wellplate containing 20 µl of derivatization reagent, and themixture was reacted at 30 for 60 min. After reaction,we added 350 µl 50% methanol solution precooled to -20 for 20 min, then centrifuged at 4000 g for 30 min at4 , the supernatant (135 µl) was transferred into a new96-well plate containing 15 µl of IS. Gradient dilutionsof the derivatized standard stock solution were added tothe left hole, and finally the plate was sealed for LC–MSanalysis.UPLC‑ESI–MS/MS analysisChromatographic analysis was performed using a WatersACQUITY I-Class UPLC equipped with an ACQUTIYUPLC BEH C18 column (2.1 100 mm, 1.7 µm). WatersXevo TQ-S triple quadrupole mass spectrometer wascombined with UPLC system via the electro-spray ionization (ESI) source in both positive and negative ionization modes. We performed accurate quantitative analysisof 306 metabolites (including 60 amino acids, 55 fattyacids, 41 organic acids, 39 bile acids, 25 carbohydrates,21 benzenoids, 20 carnitines, 9 indoles, 3 nucleosides, 9phenylpropanoic acids and 16 others) in this study.Data processing and analysisThe targeted raw data were processed through calibration curve of standards. Then, the raw data were analyzedby the iMAP software (Metabo-profile, Shanghai, China).Metabolites selected as biomarker candidates for furtherstatistical analysis were identified on the basis of variableimportance in the projection (VIP) threshold of 1.0 fromthe tenfold cross-validated OPLS-DA model, which wasvalidated at a univariate level with p value 0.05.More detailed process descriptions of proteomics andmetabolomics are provided in Additional file 1.Network pharmacological analysisData collectionFor each of the two TCM Syndrome of CHD, we selected3 formulae applied in clinic for the treatment of this Syndrome. The treatment of each formula to correspondingSyndrome was recommended in the Expert Consensusfor Chinese Medicine Diagnosis and Treatment of Stable Angina Pectoris of CHD [14] and also recorded inthe Chinese Pharmacopeia [15]. Active compounds ofeach herb in the formulae and their corresponding targets were collected from the Encyclopedia of TraditionalNetwork construction and analysisProtein–protein interaction networks were construction by GeneMania platform [21]. Metabolite-geneassociation networks were constructed by the “NetworkAnalysis” module of MetaboAnalyst platform [22]. Allnetworks were visualized and analyzed by Cytoscapesoftware [23].Functional annotation analysisFunctional annotation analysis for genes was conductedby DAVID [24] and STRING platform [25]. Functionalannotation analysis for metabolites and genes was performed by “Pathway Analysis” and “Joint-Pathway Analysis” module of MetaboAnalyst platform.ResultsCharacteristics of CHD patients with either CCQS or QSBSSyndromeA total of 111 participants, including CHD patients withCCQS Syndrome (n 44), QSBS (n 37) and healthycontrols (HC, n 30) were enrolled at the CardiologyClinic of Dongzhimen Hospital affiliated to Beijing University of Chinese Medicine or the surrounding communities in Beijing between August 2018 and December2019. The demographic and clinical biochemical indicators of the participants were listed in Table 1. There wereno significant differences in age, sex, BMI and laboratory data between CCQS and QSBS group. However,there were some disparities in the comorbidity of thetwo groups. CCQS group included higher percentageof patients with diabetes mellitus, whereas QSBS groupcontained higher percentage of patients with hypertension, hyperlipidemia, and cerebrovascular disease. Thedifferences may reflect the respective characteristics ofthe two Syndromes to some extent.It is noted that the levels of TC and LDL in bloodsamples from healthy controls were higher than CHDpatients, whereas high levels of LDL and TC have beenknown to be associated to CHD. However, these levels ofmost healthy controls were in the normal range, that is,LDL 3.62 mmol/L (SUR method), and TG 1.7 mmol/L(GPO-POD method). This bias could be due to the higher
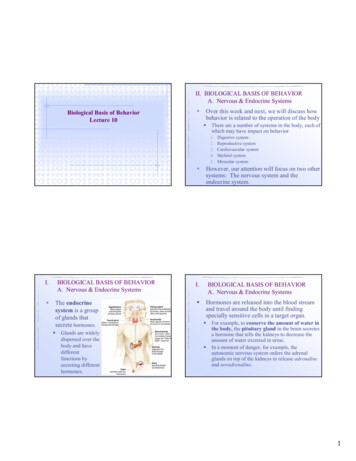
Wu et al. Chin Med(2021) 16:109Page 7 of 21Table 1 The demographic and clinical biochemical indicators of participantsHC (n 30)CCQS (n 44)QSBS (n 37)p values62.8 9.467.2 7.767.5 7.80.04821 (56.8)1.00024.7 2.924.1 3.925.2 3.30.367Diabetes mellitus1 (3.3)20 (45.5)15 (40.5) 0.001Hypertension5 (16.7)28 (63.6)28 (75.7) 0.001Hyperlipidemia4 (13.3)26 (59.1)24 (64.9) 0.001Cerebrovascular disease2 (6.7)4 (9.1)15 (40.5) 0.0015.2 1.04.4 14.3 0.90.0011.5 0.31.2 0.21.3 0.30.00545 5.90.53221.3 10.50.80063.6 16.50.6946.6 1.70.031.6 1.90.6665.9 1.90.315Basic informationAge (year)FemaleBMI (kg/m2)Arrhythmia17 (56.7)6 (20)25 (56.8)6 (13.6)6 (16.2)0.768Laboratory dataTC (mmol/L)TG (mmol/L)HDL (mmol/L)LDL (mmol/L)Albumin (g/L)ALP (U/L)ALT (U/L)AST (U/L)Creatinine (µmol/L)GGT (U/L)Glu (mmol/L)HCY (µmol/L)hs-CRP (mg/L)Total protein (g/L)Urea (mmol/L)Uric acid (µmol/L)1.4 0.93.1 0.844.0 2.189.9 24.720.4 10.924.1 5.161.8 11.325.6 16.95.8 1.217.3 13.51.9 2.174.4 4.65.2 1.0305 80.2Values were mean SD or %; p values determined by one-way ANOVA and χ2 testage of participants (most between 60 and 70), meanwhileparticipants in CHD group may have been given somelipid-lowering interventions.Proteomics profiling on CHD patients with either CCQSor QSBS syndromeIn order to study the proteomic characteristics, we usedthe data independent acquisition (DIA) method to analyze the serum samples. In total, 470 proteins were identified. Averagely, 353, 355 and 354 proteins were identifiedin CCQS, QSBS and HC group, respectively (Fig. 2A). Wealso detected protein intensities covering nearly 6 ordersof magnitude, with serum albumin being the most abundant one and macrophage receptor MARCO the lowestone (Additional file 1: Fig. S1A). Then correlation analysiswas performed between samples, in which the correlation coefficients between each two samples were higherthan 0.87, indicating high correlation (Additional file 1:Fig. S1B). Meanwhile, more than 95% of the proteinsquantified in standard samples had coefficient of variation (CV) below 10% (Fig. 2B).1.5 0.82.6 0.844.1 2.787.8 2022.2 1224.5 8.365 16.829.5 24.76.8 1.914.9 5.72 2.273.8 4.75.5 2318.4 79.91.6 0.70.7042.5 0.70.00286.4 31.60.87123.1 6.10.66529.2 17.40.71714.6 5.30.37773.4 6.20.778344.3 810.131Next, to figure out the proteomic profile differencesbetween CCQS and QSBS Syndrome, 388 proteins (missing values filled by R software) were included in subsequent analysis. Differential proteins (DPs) betweenCCQS and HC groups, as well as QSBS and HC groups(FC 1.1, Student’s t-test, p-value 0.05) were determined. There were 24 differential proteins betweenCCQS and HC groups, with 5 up-regulated and 19 downregulated (Fig. 2C). A total of 23 differential proteinswere determined between QSBS and HC groups, with 9up-regulated and 14 down-regulated (Fig. 2D). By intersection analysis, 7 proteins were common DPs of the twoSyndromes, while 17 and 16 proteins were specific DPsfor CCQS and QSBS Syndrome, respectively (Fig. 2E).We input DPs of the two Syndromes to GeneManiaplatform [21] to construct their protein–protein interaction (PPI) network, respectively. This platform usesthe label propagation algorithm to score each gene inthe entire human genomic-scale PPI network according to its links to all genes in the input list. Genes withhigher scores are functionally associated with the input
Wu et al. Chin Med(2021) 16:109Page 8 of 21Fig. 2 Analysis of the differential proteins (DPs) for the two classes of Syndromes. (A) The identified protein number in each group. (B) Coefficientof variation of proteins in Standard samples. The volcano plots of DPs between CCQS and HC group (C) or QSBS and HC group (D). (E) Overlapsbetween DPs of the two Syndromes. (F) Protein–protein interaction network for DPs of CCQS Syndrome. (G) Protein–protein interaction network forDPs of QSBS Syndrome. (H) KEGG pathways enriched with DPs and proteins in PPI networks for DPs of the two Syndromes. In F, G, Pink circles arecommon DPs of the two Syndromes, blue and orange circles are DPs specific for CCQS and QSBS Syndrome, respectively. Purple circles are proteinsfunctionally associated with the DPsgenes at higher extent, hence they are more likely to beaffected by the input genes. For each of the input lists,we added 10 other genes with the top-ranking scores toconstruct the P
positive, without other reasons (various heart disease, autonomic dysfunction, signicant anemia, obstructive lung Emphysema, taking digitalis, electrolyte distur-bances); (3) Among the risk factors of coronary heart disease, two of the three items of hypertension, diabe-tes and hyperlipidemia can be clinically diagnosed for coronary heart disease.