Transcription
12TH JACQUES POLAK ANNUAL RESEARCH CONFERENCENOVEMBER 10–11,2011Global Banking Glut and Loan Risk PremiumHyun Song ShinPrinceton UniversityPaper presented at the 12th Jacques Polak Annual Research ConferenceHosted by the International Monetary FundWashington, DC November 10–11, 2011The views expressed in this paper are those of the author(s) only, and the presenceof them, or of links to them, on the IMF website does not imply that the IMF, itsExecutive Board, or its management endorses or shares the views expressed in thepaper.
Global Banking Glutand Loan Risk Premium Hyun Song ShinPrinceton Universityhsshin@princeton.eduNovember 6, 20112011 Mundell-Fleming LectureConference DraftAbstractEuropean global banks intermediating US dollar funds are important in influencingcredit conditions in the United States. US dollar-denominated assets of banks outside theUS are comparable in size to the total assets of the US commercial bank sector, but thelarge gross cross-border positions are masked by the netting out of the gross assets andliabilities. As a consequence, current account imbalances do not reflect the influence ofgross capital flows on US financial conditions. This paper pieces together evidence froma global flow of funds analysis, and develops a theoretical model linking global banks andUS loan risk premiums. The culprit for the easy credit conditions in the United States upto 2007 may have been the “Global Banking Glut” rather than the “Global Savings Glut”. Draft of the Mundell-Fleming Lecture, prepared for the 2011 IMF Annual Research Conference, November10-11, 2011. I thank Viral Acharya, James Aitken, Carol Bertaut, Claudio Borio, Michael Chui, Stijn Claessens,Pierre-Olivier Gourinchas, Dong He, Haizhou Huang, Ayhan Kose, Ashoka Mody, Philipp Schnabl, AndrewSheng, Manmohan Singh and Hui Tong for comments on an earlier draft. I thank Daniel Lewis and Linda Zhaofor research assistance.1
1IntroductionReal estate booms riding on the back of rapidly increasing banking sector credit have rightlydrawn attention to the role played by permissive external financial conditions in the amplificationof the credit boom. Fluctuations in capital flows in recent years have ignited a lively debateon the nature of “global liquidity” and its transmission across borders, both for emerging andadvanced economies.The role of external financing conditions has been particularly relevant for the United States,with some attributing the permissive financial conditions in the United States during the middleyears of the last decade to the accumulated global current account imbalances and the “GlobalSavings Glut” emanating from emerging economies (Bernanke (2005)).Although the term “global liquidity” is often used in debates on external financial conditions,the precise definition has been more difficult to pin down. One task in this lecture will be toformulate a theoretical model of global liquidity and set it against the evidence from the globalflow of funds. It is fitting that we revisit the issue of global liquidity in this Mundell FlemingLecture. The conceptual leap in Fleming (1962) and Mundell (1963) was to elevate internationalcapital flows as a separate component of study, not merely as the residual to the outcome fromthe real side of the economy.There have been far-reaching structural changes in the operation of the global financialsystem since the late 1950s and early 1960s when the Mundell-Fleming model was formulatedand refined, and none more so than in cross-border banking. Given the importance of bankingsector portfolio decisions and the ensuing capital flows for the global financial system, it seemsa timely occasion to revisit some of the time-honored building blocks of the Mundell-Flemingmodel in the lecture that bears their names.In this lecture, I will put forward the hypothesis that cross-border banking and the fluctuatingleverage of the global banks are the channels through which permissive financial conditions aretransmitted globally.In formulating and exploring this hypothesis, the focus will be on the2
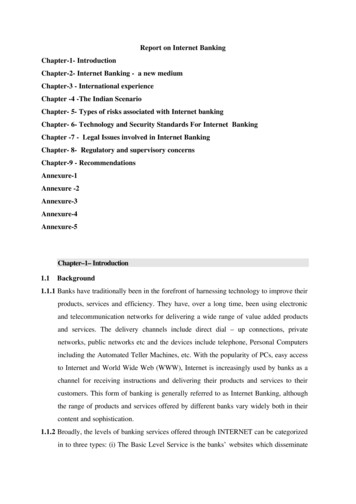
impact of global liquidity on the advanced economies, especially the United States and Europe.1My hypothesis is motivated by the evidence from an aggregate flow of funds analysis, buildingon the BIS banking statistics. The evidence points to the combination of two features that iscritically important for understanding recent events - the two elements being European banksand US dollar funding.First, we will see that the US-dollar denominated assets of banks outside the United Statesare comparable in size to the total assets of the US commercial banking sector, peaking at over 10 trillion prior to the crisis. The BIS banking statistics reveal that a substantial portion ofexternal US dollar claims are the claims of European banks against US counterparties.Second, on the funding side, we extend earlier studies that have shown how European globalbanks financed their activities by tapping the wholesale funding market in the United States2 .For instance, the interoffice accounts of foreign bank branches in the United States reveal thatforeign banks were raising large amounts of US dollar funding in the United States and thenchanneling the funds to head office. Through these and other means, the large gross claims ofEuropean banks on US counterparties are matched by their large gross liabilities to US-basedsavers.The broad picture that emerges of the role of European global banks in determining USfinancial conditions can be depicted in terms of the schematic in Figure 1. European banksdraw wholesale funding from the United States and then lend it back to US residents.Al-though European banks’ presence in the domestic US commercial banking sector is small, theirimpact on overall credit conditions looms much larger through the shadow banking system inthe United States that relies on capital market-based financial intermediaries who intermediatefunds through securitization of claims.The role of European global banks in determining US financial conditions highlights the1The impact of global liquidity on emerging and developing economies has been explored in Bruno and Shin(2011).2See, for instance, the BIS studies by Baba, McCauley and Ramaswamy (2009) and McGuire and von Peter(2009) on the use of US dollar wholesale funding by European global banks. Acharya and Schnabl (2009) reportthat European banks were sponsors for around 70% of the asset-backed commercial paper (ABCP) originatedprior to the subprime crisis.3
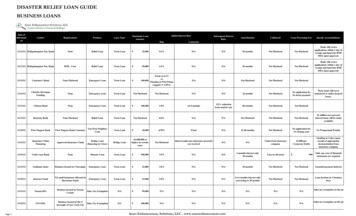
EuropeanGlobalBanksShadow bankingsystemUSBorrowersWholesalefunding marketUSBankingSectorUSHouseholdsborderFigure 1. European global banks add intermediation capacity for connecting US savers and borrowersimportance of tracking gross capital flows in influencing credit conditions, as emphasized recentlyby Borio and Disyatat (2011).In Figure 1, the large gross assets and gross liabilities of theEuropean banks net out, and are not reflected in the current account that tracks only the netflows.Net capital flows are of concern to policy makers, and rightly so. Persistent current accountimbalances hinder the rebalancing of global demand.Current account imbalances also holdimplications for the long-run sustainability of the net external asset position3 . The purpose ofthis lecture is to make the narrow claim that the current account may not be as informativeabout overall credit conditions as gross capital flows, and to propose a theoretical frameworkfor the claim.Figure 2 plots US gross capital flows by category of flows. An increase in US liabilities toforeigners is indicated by an upward-pointing bar (gross capital inflow), while an increase in USclaims on foreigners is indicated by a downward-pointing bar (gross capital outflow).4 While3See Lane and Milesi-Ferretti (2007) and Gourinchas and Rey (2007) and the post-crisis updated evidencein Gourinchas, Govillot and Rey (2010)4The line numbers in Figure 2 refer to the balance of payments table from the US Bureau of EconomicAnalysis: e/trad time series.xls4
Trillion Dollars2.0Liabilities: Foreign officialassets in United States (line 56)1.5Liabilities: Foreign claims onU.S. non-banks (line 68)1.0-0.5Liabilities: Foreign claims onU.S. banks and securitiesbrokers (line 69)Liabilities: Foreign privateholding of U.S. securities otherthan Treasurys (line 66)Assets: US holding of foreignsecurities (line 52)-1.0Assets: Claims of U.S. nonbanks on foreigners (line 000199919981997199619951994199319921991-1.5Assets: Claims of U.S. banksand securities brokers onforeigners (line 54)Figure 2. US gross capital flows by category (Source: US Bureau of Economic Analysis). Increase in USliability to foreigners is indicated by positive bar, increase in US claims on foreigners is indicated by negativebar. Only a subset of gross flows are included, so that flows do not sum to zero.official gross flows from current account surplus countries are large (grey bars), we see thatprivate sector gross flows are much larger. The downward-pointing bars before 2008 indicatelarge outflows of capital from the US through the banking sector, which then re-enter the UnitedStates through the purchases of non-Treasury securities. The schematic in Figure 1 is useful tomake sense of the gross flows.As we will see shortly, foreign banks’ US branches and subsdiaries drive the gross capitaloutflows through the banking sector by raising wholesale funding in the US through moneymarket funds (MMFs) and then shipping it to headquarters.Remember that foreign banks’branches and subsidiaries in the US are treated as US banks in the balance of payments, as thebalance of payments accounts are based on residence, not nationality.The gross capital inflows to the United States represent lending by foreign (mainly European)banks via the shadow banking system through the purchase of private label mortgage-backedsecurities and structured products generated by the securitization of claims on US borrowers. Inthis way, European banks may have played a pivotal role in influencing credit conditions in the5
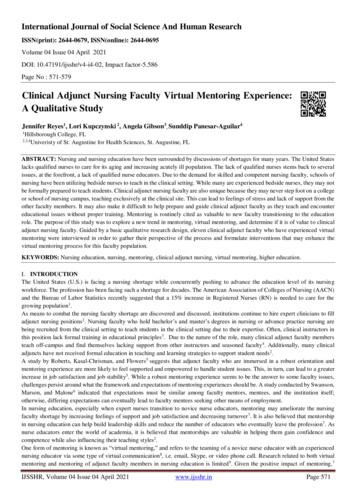
United States by providing US dollar intermediation capacity. However, since the eurozone hasa roughly balanced current account while the UK is actually a deficit country, their collectivenet capital flows vis-à-vis the United States do not reflect the influence of their banks in settingoverall credit conditions in the US. The distinction between net and gross flows is a classictheme in international finance5 , but deserves renewed attention given the new patterns of grosscapital flows due to global banking.This lecture comes in two parts. In the first part, I will piece together the evidence fromthe global flow of funds in drawing out the main hypothesis. The evidence comes from the BISbanking statistics, which is supplemented with other aggregate data from previous studies andthe Federal Reserve’s Flow of Funds data for the United States.The second part of the lecture develops a theoretical model of the impact of global bankingon US domestic credit conditions. The credit supply component of the model is the flip sideof a credit risk model where lending expands to fill up any spare balance sheet capacity whenmeasured risks are low. The balance sheet constraint binds all the time, so that in periods oflow measured risks, balance sheets must be large enough so that the risk constraint binds inspite of the low measured risks.In formulating the model of credit supply as the flip side of a credit risk model, the approachrests on the corporate finance of bank balance sheet management. In textbook discussions ofcorporate financing decisions, the set of positive net present value (NPV) projects is often takenas being exogenously given, with the implication that the size of the balance sheet is fixed.Leverage increases by substituting equity for debt, such as through an equity buy-back financedby a debt issue, as depicted by the left hand panel in Figure 3.However, the left hand panel in Figure 3 turns out not to be a good description of the waythat the banking sector leverage varies over the financial cycle. The distinguishing feature ofthe banking sector leverage cycle is that leverage fluctuates through fluctuations in the totalsize of the balance sheet with equity being the pre-determined variable. Hence, leverage and5See for instance Kindleberger’s 1965 Princeton Essay in International Finance (Kindleberger (1965)).6
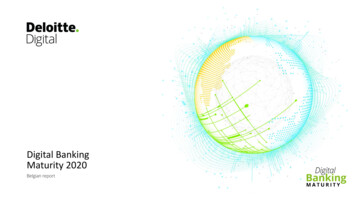
Mode 1: Increased leverage with assets fixedALAMode 2: Increased leverage via asset etsDebtDebtDebtAssetsDebtFigure 3. Two Modes of Leveraging Up. In the left panel, the firm keeps assets fixed but replaces equitywith debt. In the right panel, the firm keeps equity fixed and increases the size of its balance sheet.total assets tend to move in lock-step, as depicted in the right hand panel of Figure 3.6Banks and other financial intermediaries’ lending depends on their “balance sheet capacity”.Balance sheet capacity, in turn, depends on two things — the amount of bank capital and thedegree of “permitted leverage” as implied by the credit risk of the bank’s portfolio and theamount of capital that the bank keeps to meet that credit risk. Bank lending expands to fillup any spare balance sheet capacity when measured risks are low.Since the balance sheetconstraint binds all the time, lending expands in tranquil times in order that the risk constraintbinds in spite of the low measured risks.Borio and Disyatat (2011) have coined the term“excess elasticity” to describe the tendency of the banking system to expand when financialconstraints are relaxed.The consequences of excess elasticity can be seen in Figure 4 which plots the total assetsand risk-weighted assets of two typical European global banks - Barclays and Société Générale.Even as total assets were growing rapidly up to the eve of the crisis in 2007, the risk-weightedassets of the banks were growing moderately, reflecting the low levels of measured risks, andimplying low levels of equity capital on the banks’ balance sheets.More research is needed in order to answer two key questions. Why was it Europe that saw6Adrian and Shin (2008, 2010) discuss the evidence from US investment banks, while Bruno and Shin (2011)show in their empirical investigation of capital flows to emerging economies that non-US global banks behavesimilarly.7
Société Générale (1999 – 2007)Trillion EurosTrillion poundsBarclays (1992 – 2007)1.41.21.21.01.00.8Total Assets0.80.6Total 994199319920.0Figure 4. Total assets and risk-weighted assets of Barclays and Société Générale (Source: Bankscope)such rapid increases in banking capacity, and why did European (and not US) banks expandintermediation between US borrowers and savers? Two likely elements of the answer to bothquestions is the regulatory environment in Europe and the advent of the euro. The EuropeanUnion was the jurisdiction that embraced the spirit of the Basel II regulations most enthusiastically, while the rapid growth of cross-border banking within the eurozone after the advent ofthe euro in 1999 provided fertile conditions for rapid growth of the European banking sector.The permissive bank risk management practices epitomized in the Basel II proposals werealready widely practised within Europe as banks became more adept at circumventing the spiritof the initial 1988 Basel I Accord.Basel II was subsequently codified most thoroughly inthe European Union through the EU’s Capital Adequacy Directive (CAD).7 In contrast, USregulators have been more ambivalent toward Basel II, and chose to maintain relatively morestringent regulations (at least, in the formal regulated banking sector) such as the cap on bankleverage.In order to emphasize the link between the expansion of global banking and the risk management practices embodied in the Basel II regulations, the key element of the theoretical model7See Danielsson et al. (2001) for an early comment on the potential adverse impact of Basel II for financialstability. See also Shin (2010, chapter 10) for historical background.8
employed in this lecture will be the Vasicek (2002) credit risk model, which has served as thebackbone of the Basel capital rules.The central message of this lecture is that the current account may not be as informativeabout overall credit conditions as gross capital flows, especially gross capital flows generated bythe banking sector. If the claim is correct, then there are two important implications, one forpolicy makers and one for researchers. Policy makers on their guard against the build-up offinancial vulnerabilities cannot rely merely on monitoring the current account. Researchers, fortheir part, must take the financial system seriously when addressing overall financial conditions,rather than seeing the financial sector as just the residual of the real side of the economy. Inthis respect, researchers would do well to retrace the motivation for the work of Fleming (1962)and Mundell (1963), who elevated capital flows as a topic worthy of study in its own right. Wewill review some of the specific methodological lessons at the end of the lecture.The outline of the lecture is as follows. I begin in the next section by taking stock of theevidence from the BIS banking statistics on the global flow of funds.Section 3 presents theformal model of direct and intermediated credit where the main implications of the impact ofglobal banks on credit conditions are derived as consequences. The paper concludes with someobservations on the origin of the European banking crisis of 2011 and the likely impact of theEuropean crisis on global financial stability.2Global Flow of Funds PerspectiveLet us begin by examining the evidence for the role of global banks in determining US financialconditions. We will take a “flow of funds” approach by tracking gross flows in the economy,but from a global perspective. As stated at the outset, the two themes that emerge from theinvestigation is the role of European global banks as the protagonists in the transmission of globalliquidity and the US Dollar as the currency underpinning the global banking system. Takentogether, the two elements imply a pivotal role for European banks in determining financialconditions in the United States.9
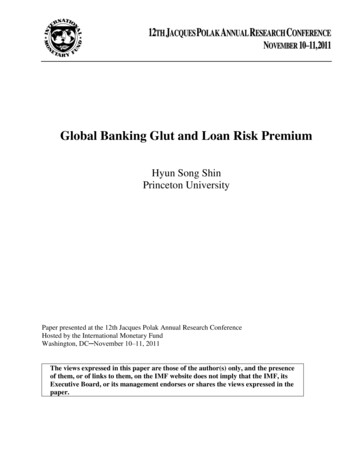
Trillion Dollars12.0U.S. dollar assets ofbanks outside US10.08.0Euro assets of banksoutside eurozone6.0Sterling assets ofbanks outside UK4.02.0Yen assets of banksoutside Japan0.0-2.0Yen liabilities of banksoutside Japan-4.0Sterling liabilities ofbanks outside UK-6.0-8.0Euro liabilities of banksoutside 2Mar.2002Jun.2001Sep.2000Dec.1999Mar.1999-12.0U.S. dollar liabilities ofbanks outside USFigure 5. Cross-border foreign currency assets and liabilities of BIS reporting banks by currency (Source: BISlocational banking statistics, Table 5A)Much of our evidence comes from the banking statistics of the Bank for International Settlements (BIS), and so some preliminary remarks are in order on how to read the numbers.8 TheBIS data come in two forms. First is the locational banking statistics, which are based on theprinciple of residence, and which are consistent with the residency principle underlying balanceof payments and national income statistics. Under the locational statistics, the branches andsubsidiaries of the global banks are classified together with the host country banks.The second type of data from the BIS are the consoldiated statistics, based on the nationalityof the parent bank. Within the consolidated banking statistics, foreign claims include the localclaims of branches and subsidiaries, while the international claims exclude local claims in local(i.e. host country) currency.Figure 5 is from the BIS locational banking statistics, and plots the total cross-border assetsand liabilities in foreign currency, classified according to currency.The top plot representsthe US dollar-denominated assets of BIS-reporting banks in foreign currency, and hence givesthe US dollar assets of banks outside the United States.8The bottom plot in Figure 5 givesSee BIS (2009) for details on the BIS banking statistics. See McGuire and von Peter (2009) for an exampleof how the BIS statistics can be used in combination to reconstruct aggregate cross-border banking positions.10
TrillionDollars11.02008Q110.0US charteredcommercialbanks' totalfinancialassets9.08.07.0US dollarassets ofbanks 22004Q12002Q42001Q32000Q21999Q12.0Figure 6. US dollar cross-border foreign currency claims and US commercial bank total assets (Source: Flow ofFunds, Federal Reserve and BIS locational banking statistics, Table 5A)the corresponding US dollar-denominated liabilities of banks outside the United States. It isimmediately clear from the Figure that the US dollar plays a much more prominent role incross-border banking than does the euro, sterling or yen.To gain some perspective on the size of the US dollar assets in Figure 5, we can plot thetotal assets series next to the aggregate commercial banking sector in the United States, whichis given in Figure 6. We see that US dollar assets of banks outside the US exceeded 10 trillionin 2008Q1, and briefly overtook the US chartered commercial banking sector in terms of totalassets. So, the sums are substantial. It is as if an offshore banking sector of comparable sizeto the US commercial banking sector is intermediating US dollar claims and obligations.Figure 7 is taken from the June 2011 issue of the European Central Bank’s Financial StabilityReview (ECB (2011)), and shows the US dollar denominated assets and liabilities of the eurozonebanks. The chart displays the typical combination of the large gross US dollar positions butsmall net positions that is the central theme in this lecture. The gross positions are very large- reaching nearly 5 trillion at their peak. However, the assets and liabilities mirror each otherclosely, so that the resulting net position is very small by comparison.11Since the balance of
Figure 7. US Dollar-denominated assets and liabilities of euro area banks (Source: ECB Financial StabilityReview, June 2011, p. 102)payments statistics only measure the net positions, accumulated current account positions willdo a poor job of reflecting the underlying gross positions. It is worth noting that Figure 7 dealswith the eurozone banks only. They leave out the UK and Swiss banks, which (as we see below)play a very substantial intermediating role for credit in the US.Figure 8 taken from Borio and Disyatat (2011) charts US gross capital capital flows by region,and gives further useful background to the chart on gross capital flows in Figure 2. Although thegross inflows from current account surplus countries such as China, Japan and the oil exportersare large, the largest inflows prior to the crisis came from Europe, as can be seen in the left handpanel of Figure 8. The right hand panel of Figure 8 shows the matching outflows to Europeprior to the crisis. In both panels, we see the flows reversing abruptly with the onset of thecrisis, as the European banking sector underwent rapid deleveraging.2.1Asset SideHaving documented the size of the US dollar-denominated positions of the global banks outsidethe United States, we now address how much of the US dollar denominated assets are claims12
Figure 8. US gross capital flows by region (Source: Borio and Disyatat (2011, graph 6)) Gross capital flowsare expressed as percentage of US GDPagainst US counterparties. Obtaining an answer to this question is important in ascertainingthe impact on credit conditions in the United States, rather than US dollar denominated lendingthat goes elsewhere in the world (for instance, to the emerging economies).The BIS consolidated banking statistics (Table 9D) provide insights on how much of theUS dollar denominated claims are actually claims on US borrowers. Figure 9 shows the foreign claims of BIS reporting banks on US counterparties, broken down by the nationality ofthe lending bank.We see that the UK and Swiss banks had very substantial claims on UScounterparties, large even compared to the French and German banks. Together, the Europeanglobal banks had claims of over 5 trillion against US borrowers at the peak of the credit boom.Some caution is necessary in interpreting these numbers. Figure 9 shows the foreign claimsof BIS reporting banks, and hence includes the dollar loans extended by US-based subsidiariesand branches.As such, Figure 9 is not strictly comparable to Figure 5, which is based onthe locational banking statistics. Indeed, it is notable that the consolidated exposures of BISreporting banks on US counterparties falls well short of the 10 trillion sum given by Figure 5,even including the assets of local subsidiaries and branches.The gap between the 10 trillion sum given by Figure 5 and the US exposures in Figure9 suggest that the 10 trillion figure may overstate the extent of the intermediation activityconducted by the European banks in connecting US savers and borrowers.13Another fix on
Trillion Dollars7.06.05.0Non-European BISreporting countries4.0Other European BISreporting countriesSwitzerland3.0United -Q42005-Q20.0Figure 9. Foreign claims of BIS reporting banks on US counterparties (Source:statistics, Table 9D)BIS consolidated bankinghow much of the 10 trillion is with US counterparties is given in Figure 10 from the BISlocational statistics (Table 6A) that shows the claims and liabilities of banks outside the US onUS counterparties. Even though this series includes claims in all currencies, the series peaksat 5.73 trillion,9 leaving a big gap compared to the 10 trillion figure.Part of the remainderof the 10 trillion sum may be accounted for by lending to emerging economies, but anotherpossibility (perhaps more plausible) is that the 10 trillion sum incorporates substantial doublecounting of US dollar exposures that are held between global banks. Yet another possibility isthat the holdings of offshore financial centers account for part of the gap. More disaggregateddata would help to resolve these questions. What is clear is that a very substantial portion ofthe 10 trillion dollar-denominated assets do not involve directly a US counterparty, highlightingthe importance of the US dollar as the currency that underpins the global banking system.Although the BIS banking statistics do not provide a detailed breakdown by the type ofasset held by the bank, data on holdings of US securities suggest that a substantial portion ofthe claims of European banks were US private label securities. Milesi-Ferretti (2009) draws on9The US dollar only series peaks at 4.8 trillion in 2008Q1, of which 1 trillion is the claim held by branchesof US banks on their parent. I am grateful to Carol Bertaut for pointing this out.14
Trillion Dollars7.06.0Claims of BISreporting banksoutside US onUScounterparties5.04.03.0Liabilities ofBIS‐reportingbanks outsideUS to 000-Q11999-Q11998-Q11997-Q11996-Q11995-Q10.0Figure 10. Claims and liabilities of BIS-reporting banks outside US on US counterparites (all currencies) (Source:BIS locational banking statistics, Table 6A)evidence from the US Treasury on foreign holdings of US securities to show that the bulk ofnon-government securities (and not guaranteed by the US GSEs such as Fannie Mae and FreddieMac) were held by European investors, while countries with large current account surpluses suchas China and Japan held mainly US Treasury securities or GSE securities.Taken together with the BIS data, the picture that emerges is of a substantial amount ofcredit being extended to US borrowers by the European banks, albeit indirectly through theshadow banking system in the United States through the purchase of mortgage-backed securitiesand structured products generated by securitization. Since erosion of lending standards is keyto the subsequent mortgage crisis, understanding the possible link between the erosion of lendingstandards and the expansion of credit is crucial. This task is taken up in the theory sectionbelow.The fact that the rapid expansion of credit through private label mortgage securitizationscame from European global banks puts the “Global Savings Glut” hypothesis into new focus.China, Japan and other current account surplus economies have often been cited as contributingto permissive financial conditions in the United States (Bernanke (2005))10 , but these countries10Closely related to the Global Savings Glut argument is the hypothesis that emerging economies lack highquality financial assets, and that the demand for high quality of assets by emerging economy residents results15
held mainly Treasury and GSE securities rather than the private label securities that providedfinancing for subprime mortages. Although GSEs channeled funding to the US housing marketalso, subprime lending was securitized mainly through private label (i.e. non-GSE) securitizations. Of the non-US intermediaries, it was the European banks that were exposed most to thesecurities and structured products associated with subprime.More recently, Bernanke, Bertaut, DeMarco, and Kamin (2011) and Bertaut, DeMarco,Kamin and Tryon (2011) have drawn attention to capital flows emanating from European investors, pointing to the need to modify the original Global Savings Glut hypothesis. They alsoconsider a mechanism whereby
foreigners is indicated by an upward-pointing bar (gross capital inflow), while an increase in US claims on foreigners is indicated by a downward-pointing bar (gross capital outflow).4 While 3See Lane and Milesi-Ferretti (2007) and Gourinchas and Rey (2007) and the post-crisis updated evidence in Gourinchas, Govillot and Rey (2010)