Transcription
National Future Extreme Heat Scenarios forAssessment of Climate Impacts on Public HealthNational Climate Assessment Center Call and Indicators Team MeetingWashington, DC – April 8-9, 2014Development of National Future Extreme HeatScenarios to Enable the Assessment of ClimateImpacts on Public HealthDale A. QuattrochiNASA Earth Science OfficeMarshall Space Flight CenterHuntsville, ALAndWilliam L. CrossonMohammad Z. Al-HamdanMaurice G. Estes, Jr.Universities Space Research AssociationNational Space Science & Technology CenterHuntsville, AL
National Future Extreme Heat Scenarios forAssessment of Climate Impacts on Public HealthProject Objective: To provide historical andfuture measures of climate-driven heat events toenable assessments of heat impacts on publichealth over the coterminous U.S. The project’s emphasis is on providing assessments of the magnitude,frequency and geographic distribution of EHEs to facilitate public healthstudies. We focus on the daily to weekly time scales on which EHEs occur, not ondecadal-scale climate changes. There is, however, a very strong connection between air temperaturepatterns at the two time scales and long-term climatic changes willcertainly alter the frequency of EHEs.
CDC WONDER Databases
CDC WONDER OUTPUT EXAMPLEUS Average Maximum Daily Air Temperature - 2000-2011
Definitions of Extreme Heat EventsWe define Extreme Heat Events (EHE) separately for each of three heat variables:1. Daily maximum temperature2. Daily maximum Heat Index3. Net Daily Heat Stress An EHE is defined when the variable exceeds the 95th percentile for twoconsecutive days. Percentiles are determined for each county based on 1981-2010 NLDAS datafor the ‘warm season’ of May-September.Other EHE definitions incorporate daily minimum temperatures or imposeabsolute thresholds, for example, requiring a daily maximum temperature of90 oF (32 o C), in addition to the relative (percentile) criteria.
Metrics of Excessive Heat1. Daily Maximum Air Temperature Daily maximum air temperature, the highest temperature recorded at an observationsite between midnight and midnight local standard time, is a traditional measure of heat,and one with which everyone is familiar.We used National Land Data Assimilation System (NLDAS) data to calculate daily maximumair temperature.T (oF)July 15, 2000
Metrics of Excessive Heat2. Heat Index (HI)HI (oF)We used NLDAS data to calculate daily maximum Heat Index (HI).Heat Index is only calculated for air temperatures above 80oF.July 15, 20007
Metrics of Excessive Heat3. Net Daily Heat Stress (NDHS)Net Daily Heat Stress is a new heat variable that gives an integrated measure ofheat stress (and relief) over the course of a day, defined as:NDHS Σ(HIi – HIhot) - Σ(Tcool - Ti)where the summations are over the hours in a day, but only positive terms areincluded. In other words, the first sum, the ‘heat stress’, is only calculated when HIi HIhot , where HIhot is a threshold above which HI is considered a stressor, set to 90oF.The second term, ‘heat relief’, is only computed when Ti Tcool, a temperature belowwhich relief from heat occurs, set to 75o F. This term is based on air temperaturesince HI is only defined when T 80o F.If heat relief is greater than heat stress, NDHS is set to 0.8
Metrics of Excessive Heat3. Net Daily Heat Stress (NDHS)NDHS (degree-hours)July 15, 20009
North American Land Data Assimilation System(NLDAS) North American Land Data Assimilation System (NLDAS)combines meteorological data from models with observationsfrom ground stations and satellites for the conterminous U.S. 1/8th degree (about 14 km) spatial resolution Available hourly Data available fromhttp://www.emc.ncep.noaa.gov/mmb/nldas/ Hourly air temperature and humidity data have been used tocreate grid-level daily maximum and minimum temperaturesand other heat-related variables. Gridded data have been aggregated to county level for linkagewith health data.
National Future Extreme Heat Scenarios for Assessment of Climate Impacts onPublic Health
GCMsWe obtained GCM output of monthly mean minimum and maximum dailytemperatures and monthly mean specific humidity.Source: Coupled Model Intercomparison Project (CMIP3) Multi-Model DatasetArchive at Program for Climate Model Diagnosis and Intercomparison (PCMDI).This activity was in support of the 4th Assessment Report (AR4).Scenarios:20th Century Climate for 1980 -1999SRES A2 (‘Business as Usual’) for 2030-2049 (‘2040’) and 2080-2099 (‘2090’)SRES A1B (‘Balanced Energy’) for 2030-2049 (‘2040’) and 2080-2099 (‘2090’)1.2.3.4.5.6.Model# Ensemble members usedCCSM3 (NCAR)2CSIRO-MK3.0 (Australia)2CSIRO-MK3.5 (Australia)3BCCR-BCM2.0 (Norway)1INM CM3.0 (Russia)1MIROC 3.2 Med. Res. (Japan)3Means of each variable were computed across ensembles, then across models.12
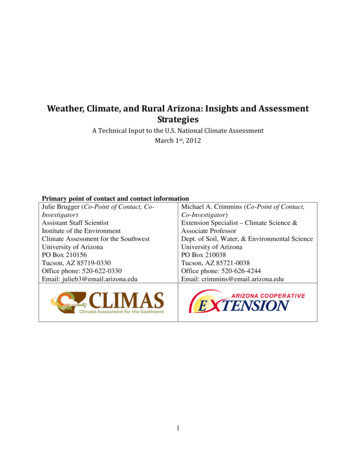
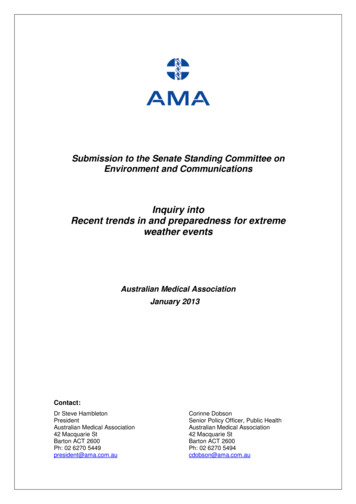
Frequency of Extreme Heat Days Annual variability over the U.S. is quite large. Over regions, variability is even greater in a relative sense.6000050000Net Daily Heat StressMax TempMax Heat Index4000030000200001000001999 2000 2001 2002 2003 2004 2005 2006 2007 2008 2009 2010YearNumber of DaysNumber of Persons Exposed6000Number of EHE Person-Days (Millions)Number of EHE County-Days7000050004000Net Daily Heat StressMax TempMax Heat Index30002000100001999 2000 2001 2002 2003 2004 2005 2006 2007 2008 2009 2010Year
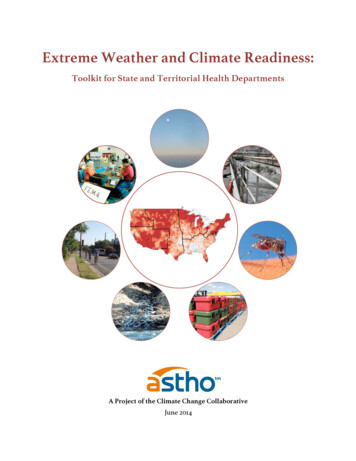
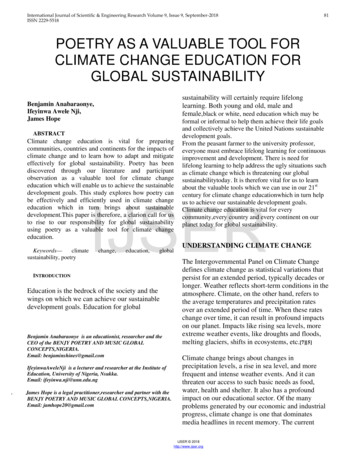
Death Rates on EHE Days and non-EHE Days700600Heat-Related Deaths per County per Day (*100,000)EHE daysNon-EHE daysDeaths on EHE dayshighest for NDHSdefinition, lowest formax T definition.500400Deaths on non-EHE daysalmost independent ofEHE definition.3002001000EHE TmaxEHE HImaxEHE NDHS
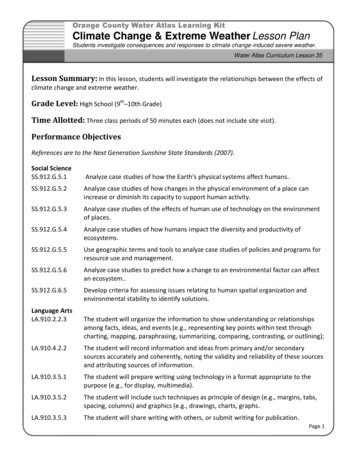
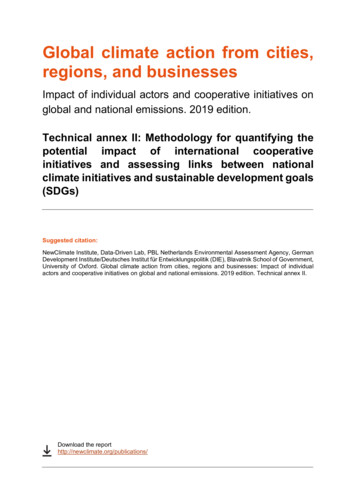
Comparison of EHE DefinitionsThe ratio of deaths per county per day on EHE days to deaths on non-EHEis a good indicator of the discriminating power of the EHE definition.9Ratio, Heat-Related Deaths, EHE Days to Non-EHE Days876543210EHE TmaxEHE HImaxEHE NDHS
Mean Maximum Temperature Difference - August2030-2049 minus 1980-1999, mean of all models, all ensemble members, A2 scenariooF4.93.21.4
Example of current and future climatesDaily maximum Heat Index, A2 scenarioHeat Index (oF)Heat Index 111 oFDaily maximumHeat IndexAugust 13, 2007Add 2040-1990 -climate (temperature & humidity) to obtain HI projections:Heat Index 121 oFDaily maximumHeat IndexAugust 13, 2007analogin 2041-2060 climate
May – September mean daily maximum temperaturesA2 Climate ScenariooF1981-20102031-20602081-2110
May – September mean total Net Daily Heat StressA2 Climate 0
May – September Mean Number of Extreme Heat Event DaysMaximum Temperature Definition - A2 Climate ScenarioNumber of days1981-20102031-20602081-2110Note: Since EHE days are based on days exceeding percentiles for the local climate, the number of EHEdays for the baseline period (1981-2010) is nearly uniform across the country, at about 6 days per year.Based on the Maximum Temperature EHE definition, the mean annual number of EHE days rises to 2040 for much of the country by mid-century , and to 50 – 100 by the end of the century.
May – September Mean Number of Extreme Heat Event DaysMaximum Heat Index Definition - A2 Climate Scenario1981-20102031-2060Number of days2081-2110Based on the Maximum Heat Index EHE definition, the mean annual number of EHE days rises to 3060 for much of the country by mid-century , and to 60 – 150 by the end of the century.
Population Projections on NLDAS GridCombine current gridded population estimates with county-level projections2010 PopulationNLDAS Grid2050 County Projections(EPA-ICLUS)2050 PopulationNLDAS Grid - A2 Scenario Population on the NLDAS grid were determined from 2010 U.S. Census Tract populations. County populations were determined by aggregating the NLDAS grid populations. The proportion of the county population within each NLDAS grid cell was computed by dividing thegrid cell population by the respective county population. Populations in 5-year intervals to 2100 were estimated using projected county populations from EPAICLUS (Integrated Climate and Land Use Scenarios), keeping in-county distribution constant. The A2climate scenario projections were used here. The 5-year projections were interpolated to create annual projections.
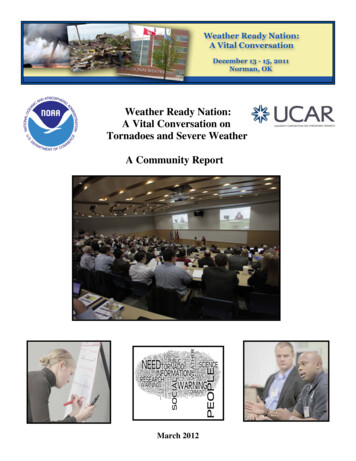
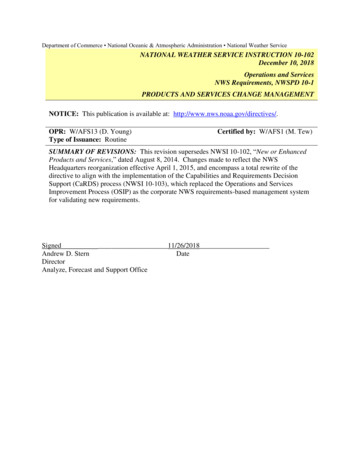
Population-Weighted Heat Wave Days Indexi.e. Mean Annual Number of Person-Days Experiencing Extreme HeatMean Annual Number of Extreme Heat Event Person-DaysDaily Maximum Temperature Heat Event Definition4.5E 104.5E 104.0E 104.0E 103.5E 103.5E 10End ofCentury3.0E 102.5E 102.5E 102.0E 101.5E 101.5E 10Mid-CenturyEnd ofCentury3.0E 102.0E 10Mid-Century1.0E 101.0E 105.0E 09Mean Annual Number of Extreme Heat Event Person-DaysDaily Maximum Heat Index Heat Event DefinitionBaseline Period5.0E 09Baseline Period0.0E 000.0E 001981-19901991-20002001-20102031-2040 2041-2050Decade4.5E 1-20102031-2040 2041-2050Decade2051-20602081-2090Mean Annual Number of Extreme Heat Event Person-DaysNet Daily Heat Stress (NDHS) Heat Event DefinitionEnd ofCentury4.0E 103.5E 103.0E 102.5E 102.0E 10Mid-Century1.5E 101.0E 105.0E 09Baseline Period0.0E 001981-1990 1991-2000 2001-2010 2031-2040 2041-2050 2051-2060 2081-2090 2091-2100DecadeThese graphs show the mean annual number of EHE person-days by decade for theContinental US, based on three EHE definitions.2091-2100
Products GCM-scale monthly climatologies of max/min air temperature andspecific humidity for the historical period 1981-2000, and futurechanges relative to this period. NLDAS-scale daily max/min temperatures, maximum heat indexand Net Daily Heat Stress for historical period. NLDAS-scale statistics over 20-year past and future periods of heatstress measures. County-level heat stress measures to enable assessments of heatimpacts on public health. Population-weighted NDHS for coterminous U.S.
Summary GCM monthly means of max/min air temperature and specific humidity fora historical period (1981-2000) and mid-century and late-century periodswere used together with NLDAS data to simulate realizations of future heatrelated metrics: daily max/min temperatures, maximum Heat Index andNet Daily Heat Stress over the CONUS. Summertime mean values of each heat metric are shown to increasesubstantially over the next century. Population data projected to 2100 were used to calculate populationweighted heat metrics. Three definitions of Excessive Heat Events were used to determine thenumber of heat wave days, on a CONUS grid, for the future climatescenarios. The number of heat wave days and the number of persons exposed toexcessive heat are expected to increase greatly over the next century.
Ongoing Research Incorporate county populations to evaluate EHE indicators on aper-exposure basis. Perform U.S. regional analyses to determine if different EHEdefinitions are more suited for certain regions. Perform analysis with additional EHE definitions, including somewith fixed thresholds of temperature and Heat Index. Include contributing death factors in analysis. Consider other causes of death that may be indirectly heatrelated, such as cardiovascular and respiratory causes.
National Future Extreme Heat Scenarios for Assessment of Climate Impacts on Public Health National Climate Assessment Center Call and Indicators Team Meeting . Washington, DC – April 8-9, 2014 . Development of National Future Extreme Heat Scenarios to Enable the Assessment