Transcription
ARMY RESEARCH LABORATORYFailure Analysis, Cadmium Brush Plate Qualification andSalt Fog Testing of the AH-64 Shock Strut Mount,P/N 7-311113409by Marc PepiARL-TR-2870Approved for public release; distribution is unlimited.November 200220030115 13?
NOTICESDisclaimersThe findings in this report are not to be construed as an official Department of the Army position unlessso designated by other authorized documents.Citation of manufacturer's or trade names does not constitute an official endorsement or approval of theuse thereof.Destroy this report when it is no longer needed. Do not return it to the originator.
Army Research LaboratoryAberdeen Proving Ground, MD 21005-5069ARL-TR-2870November 2002Failure Analysis, Cadmium Brush Plate Qualification andSalt Fog Testing of the AH-64 Shock Strut Mount,P/N 7-311113409Marc PepiWeapons and Materials Research Directorate, ARLApproved for public release; distribution is unlimited.
AbstractA failure analysis was performed on a shock strut mount from an AH-64 Apache attackhelicopter. It was concluded that the failure was attributed to stress corrosion cracking and/orcorrosion fatigue and had initiated at a region where the protective cadmium plating was wornaway in service. Based upon this conclusion, it was necessary to qualify two facilities (HunterArmy Air Field, Savannah, GA and Ft. Lewis, Dupont, WA) for the cadmium brush platingrework of these components found to have worn coatings during routine inspections. The U.S.Army Research Laboratory was involved in the qualification process for both facilities, and theresults of each quality audit are included. Finally, the results of salt fog testing of cadmiumbrush plated specimens, plated at the respective facilities, are also included, as well as acomparison of the grain size of the material in the failed component vs. the material from thestruts plated at each facility.11
ContentsList of FiguresvList of Tablesix1.Introduction12.Failure Analysis of an AH-64 Shock Strut Mount, Part 7-31111340912.1Background12.2Manufacturing Criteria22.3Miscellaneous22.4Applicable Specifications22.5AH-64 Shock Strut Mount22.6Visual Inspection/Light Optical Microscopy32.7Metallography92.8Electron Microscopy/EDS102.9Chemical Analysis212.10Hardness Testing212.11Discussion2.11.1 Maraging 300 Grain Size2.11.2 Effect of Grain Size on Mechanical Properties2.11.3 Effect of Grain Size on Resistance to SCC2.11.4 Vacuum-Deposited Cadmium Coating2.11.5 Hydrogen-Assisted Failures2.11.6 SCC and CF2.11.7 Titanium-Carbonitrides22222323242424242.12Failure References27in
Appendix A. Qualification of Hunter Army Air Field (HAAF), Savannah, GAfor Cadmium Brush Plating Rework of Shock Strut Mounts29Appendix B. Qualification of Ft. Lewis, Dupont, WA for Cadmium Brush PlatingRework of Shock Strut Mounts35Appendix C. Salt Fog Testing of Cadmium Brush Plated Specimens FromHunter Army Air Field (HAAF) and Ft. Lewis41Appendix D. Grain Size Comparison of Failed Strut Mount, Hunter ArmyAir Field (HAAF) Specimen and Ft. Lewis Specimen61Appendix E. U.S. Army Aviation and Missile Command (AMCOM)Deficiency Report Appendix F. Change of Manufacturer's Engineering Drawing69Report Documentation Page7jIV
List of FiguresFigure 1. Schematic of the strut mount attached to the helicopter and the location of failure3Figure 2. Fracture surface of the failed part in the as-received condition (mag. lx)4Figure 3. The fracture surface using oblique lighting. Note the shear lip separating theprimary and secondary cracks, as well as the beach marks (mag. 1.4x)4Figure 4. Intergranular morphology observed within primary crack using light opticalmicroscopy (mag. 30x)5Figure 5. Intergranular morphology observed within secondary crack using light opticalmicroscopy (mag. 30x)5Figure 6. The only evidence of the green epoxy primer was along this small section of theshoulder6Figure 7. The only evidence of cadmium on the failed part was in the threads, shownhere as a white, powdery corrosion product energy dispersive spectroscopy (energydispersive spectroscopy [EDS] confirmed the presence of cadmium) (mag. 1.5x)6Figure 8. Corrosion pits adjacent to the primary origin (mag. lOx)7Figure 9. Corrosion pits adjacent to the secondary origin (mag. lOx)7Figure 10. Group of pits observed along the spindle of the failed part. Pitting wasprevalent along the spindle region (mag. 25x)8Figure 11. Competing crack path adjacent to primary fracture surface. Note theintergranular nature of the crack, as well as the region of intergranular attack(mag. 15x)8Figure 12. Microstructure of the material showing aged, low-carbon martensite in thelongitudinal direction. Marble's Reagent (mag. 50x)9Figure 13. Microstructure similar to that in Figure 12 shown at higher magnificationand in the transverse direction. Marble's Reagent (mag. lOOx)10Figure 14. Microstructure of the material with grain size reticle overlay. The grainmeasured between nos. 2 and 3. Marble's Reagent (mag. lOOx)11Figure 15. Microstructure of the material with incremented reticle overlay. The grain sizemeasured between 0.005 and 0.01 in. Marble's Reagent (mag. lOOx)11Figure 16. Schematic of fracture features as determined through SEM. Numbers in boxescorrespond to figure locations12Figure 17. Morphology of the primary fracture surface. "Rock candy" was prevalentwithin this region (mag. lOOx)13Figure 18. Morphology of the secondary fracture surface. "Rock candy" was prevalentwithin this region (mag. lOOx)13Figure 19. Magnified view of the intergranular morphology showing secondary cracking(mag. 200x)14
Figure 20. Ductile morphology noted within shear lip between the primary and secondaryfracture (mag. 1500x)14Figure 21. Interface between the secondary fracture surface and the shear lip (mag. 50x)15Figure 22. Interface between the primary fracture surface and the transgranular/ overloadregion (mag. 50x)15Figure 23. Morphology of the surface on the same plane as the primary fracture surfacesubjected to fast-fracture, consisting of a transgranular/ ductile mode (mag. lOOOx)16Figure 24. Morphology of the surface on the same plane as the secondary fracture surfacesubjected to fast-fracture, consisting of a transgranular/ductile mode (mag. lOOOx)16Figure 25. Transgranular/ductile morphology at higher magnification (mag. 1800x)17Figure 26. Representative EDS spectra of the spindle of the failed part. No evidence ofcadmium was noted along the spindle1gFigure 27. Representative EDS spectra within the threads of the failed part. Cadmium wasnoted within the threads18Figure 28. SEM micrograph of polished and etched surface showing titanium precipitate(white arrow) within a grain boundary that was subjected to EDS (mag. 2000x)19Figure 29. EDS spectra showing evidence of titanium within the precipitate shown inFigure 28. Other elements constitute the alloy19Figure 30. SEM micrograph of intergranular morphology of the primary fracture,showing the titanium-carbonitride precipitate that was examined using EDS (Figure3Dv(mag. 1500x)[2QFigure 31. EDS spectra of the Ti (C, N) precipitate shown in Figure 30. Note the presenceof titanium, carbon, and nitrogen, as well as the alloying elements20Figure 32. SEM micrograph of intergranular morphology of the primary fracture, showinganother titanium-carbonitride precipitate (mag. 1300x)21Figure C-l. Intact shock strut mount shown in the as-received condition (reduced 75%)41Figure C-2. Fixtures used for the stress corrosion testing of bent beam specimens(reduced 64%)42Figure C-3. Grain size of a representative HAAF specimen (mag. lOOx)45Figure C-4. Grain size of a representative Ft. Lewis specimen (mag. lOOx)46Figure C-5. Montage of a typical fracture surface of a HAAF specimen (specimen no 1)(mag. 12x)47Figure C-6. Schematic illustrating a mapping of the fractographic features of the surfaceshown in Figure C-5. Boxes show locations of Figures C-7 and C-848Figure C-7. Intergranular morphology prevalent on the HAAF specimens, indicative of abrittle fracture (mag. 200x)48Figure C-8. Ductile morphology noted on the HAAF specimens, indicative of final fastfracture (mag. lOOOx)49Figure C-9. Montage of a typical fracture surface of a Ft. Lewis specimen (specimen no 3)(mag. 12x)'50VI
Figure C-10. Schematic illustrating a mapping of the fractographic features of the surfaceshown in Figure C-9. Boxes represent location of figures51Figure C-l 1. Transgranular fracture morphology prevalent on the Ft. Lewis specimens(mag. 500x)51Figure C-12. Intergranular attack noted at origin no. 1 of Ft. Lewis specimen no. 3(mag. lOOx)52Figure C-13. Intergranular attack noted at origin no. 2 of Ft. Lewis specimen no. 3(mag. lOOx)52Figure C-14. Intergranular attack noted at origin no. 3 of Ft. Lewis specimen no. 3(mag. 200x)53Figure C-l 5. Higher magnification of the intergranular attack noted at origin no. 1(Figure C-12) of Ft. Lewis specimen no. 3 (mag. 200x)53Figure C-l 6. Higher magnification of the intergranular attack noted at origin no. 2(Figure C-13) of Ft. Lewis specimen no. 3 (mag. 200x)54Figure C-17. Higher magnification of the intergranular attack noted at origin no. 3(Figure C-14) of Ft. Lewis specimen no. 3 (mag. 200x)54Figure C-l8. Mixed mode morphology (intergranular and transgranular) noted close toorigins within zone A Ft. Lewis specimen no. 3 (see Figure C-10) (mag. 300x)55Figure C-l9. Morphology noted further from origins (closer to final fast fracture region)within zone A Ft. Lewis specimen no. 3 (see Figure C-10) (mag. 200x)55Figure C-20. Ductile morphology observed in the final fast fracture region (zone B) ofFt. Lewis specimen no. 3 (see Figure C-10) (mag. 200x)56Figure C-21. Chart showing the effect of increased cobalt composition on thetime-to-failure of maraging 250 steel. Plot compares 8% cobalt, 2% cobalt,and cobalt-free maraging 250 steel. Tests were conducted in stagnant 3.5% NaClsolution for 1000 hr using proof-ring specimens58Figure D-l. Grain size of the failed strut mount with reticle overlay (mag. lOOx)61Figure D-2. Grain size from the intergranular fracture surface of the failed strut mount(mag. 200x)62Figure D-3. Grain size of the HAAF specimen with reticle overlay. Compare toFigure D-l (mag. lOOx)63Figure D-4. Grain size from the intergranular fracture surface of the HAAF SCCspecimen. Compare to Figure D-2 (mag. 200x)63Figure D-5. Grain size of the Ft. Lewis specimen with reticle overlay. Compare toFigure D-l (mag. lOOx)64Figure D-6. Grain size from the intergranular fracture surface of the Ft. Lewis SCCspecimen. Compare to Figure D-2 (mag. 200x)64vn
INTENTIONALLY LEFT BLANK.Vlll
List of TablesTable 1. Chemical composition (weight-percent)22Table 2. Hardness readings on spindle (Rockwell "C" scale)22Table 3. Hardness readings on metallographic samples (Rockwell "C" scale)23Table A-l. Calculated thickness and deflection of HAAF specimens30Table A-2. Specimen plating variables (HAAF)32Table B-l. Calculated thickness and deflection of Ft. Lewis specimens36Table B-2. Specimen plating variables (Ft. Lewis)37IX
INTENTIONALLY LEFT BLANK.
1. IntroductionThe U.S. Army Research Laboratory (ARL) was tasked by the U.S. Army Aviation and MissileCommand (AMCOM) to perform a failure investigation of an AH-64 Apache shock strut mount.This technical report summarizes the results of this analysis, as well as ARL's involvement inqualifying two Army facilities to cadmium brush plate worn strut mounts (Appendices A and B).Also included are the results of salt fog testing cadmium brush plated specimens from the twofacilities (Appendix C), and grain size comparison of various specimens (Appendix D).Appendix E includes an AMCOM Deficiency Report based on the results of ARL'sinvestigation, while Appendix F contains the updated Engineering Drawing, which included amaterial change and the addition of shot peening. The failure analysis report and appendices areentitled and dated as follows:Failure Analysis of an AH-64 Shock Strut Mount, Part 7-311113409 (Final version, 18May 1998);Qualification of Hunter Army Air Field (HAAF), Savannah, GA for Cadmium BrushPlating Rework of Shock Strut Mounts (17 June 1997);Qualification of Ft. Lewis, Dupont, WA for Cadmium Brush Plating Rework of ShockStrut Mounts (8 April 1998);Salt Fog Testing of Cadmium Brush Plated Specimens from HAAF and Ft. Lewis (6 July1998);Grain Size Comparison of Failed Strut Mount, HAAF Specimen and Ft. Lewis Specimen(26 October 1998);AMCOM Deficiency Report as a Result of ARL's Failure Investigation (22 January 1998);Change of Manufacturer's Engineering Drawing (undated).2. Failure Analysis of an AH-64 Shock Strut Mount, Part 7-3111134092.1BackgroundAMCOM requested that ARL and the Weapons and Materials Research Directorate (WMRD)perform a failure analysis of an AH-64 shock strut mount, which is a component of the mainlanding gear assembly. The right hand (R/H) mount, which secures the R/H landing gear trailingarm to the fuselage failed in flight. It was the first of these mounts to fail during flight. Stresscorrosion cracking (SCC), which initiates at the transition point between the base of theunderside of the shaft and the mount base, has been attributed to numerous failures of this item inthe past. This has been the result of cadmium wearing off and corroding away in service. The
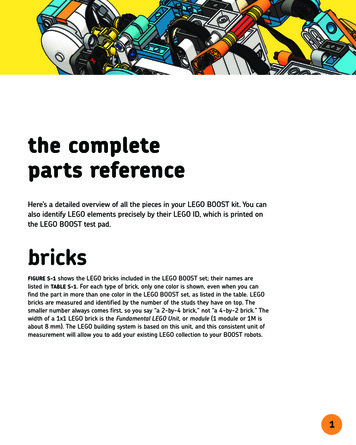
part under investigation failed after 1148 flight hours, and the gross weight of the aircraft at thetime of failure was 12,040 lb.2.2 Manufacturing CriteriaMaterial:18% Nickel Maraging Steel per Hughes Material Specification (HMS) 6-1081,300,000 psi grade.Strength:280,000 psi Ultimate Tensile Strength (UTS) required per specification HMS6-1081.275,000psi UTS required per MDHS drawing 7-311113409.Treatment:Annealed at 1500 F for 1 hr/in, cooled in air, then aged at900 F for 4-6 hr and cooled in air.Coating:Vacuum Cadmium Plating (Finish 61A per EPB 4-230; MIL-C-8837,Class 2 equivalent [1]), followed by Epoxy Primer per MIL-P-23377, Type I,Class 3 [2].2.3MiscellaneousAircraft Flight Hours:1148Intended Service Life: Unlimited2.4Applicable Specifications McDonnell Douglas Engineering Drawing No. 7-311113409 HMS 6-1081 McDonnell Douglas Bulletin EPB 4-230 McDonnell Douglas Process Specification HP 1-12.5AH-64 Shock Strut MountThe shock strut mount was fabricated in accordance with McDonnell Douglas EngineeringDrawing No. 7-311113409-2. The component is part of the main landing gear and is located onthe helicopter as shown in Figure 1. This figure also shows the location of the failure. Thecomponent is forged from Maraging 300 steel; and after heat treatment and final machining, it iscadmium coated using a vacuum deposition process. The part is subsequently painted using anepoxy primer. The failure of the part occurred at the radius separating the spindle from the baseof the component. This region is subjected to the loads generated by the aircraft performinglevel and running landings. ARL examined a similar part, in which the failure occurred at thesame location and was attributed to SCC and/or corrosion fatigue (CF) [3].
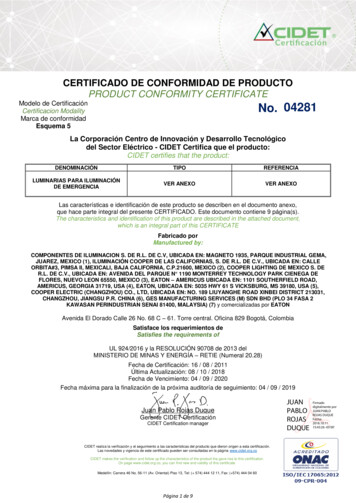
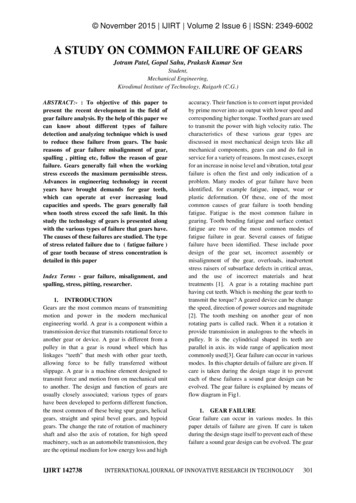
Figure 1. Schematic of the strut mount attached to the helicopter and the location of failure.2.6 Visual Inspection/Light Optical MicroscopyFigure 2 shows the fracture surface of the sectioned component in the as-received condition. Thepart failed at the machined radius of the spindle section. Figure 3 is a close-up of the fracturesurface using oblique lighting, showing the fracture features, such as shear lips and beach marks.Two distinct cracks were noted and labeled "primary" and "secondary," based upon the severityof corrosion on the fracture surface (the crack with the most severe corrosion was labeledprimary, while the other was labeled secondary). These two crack fronts initially propagated ondifferent planes and converged during fast fracture in the location shown in Figure 3. The size ofthe grains within these intergranular regions was so large that the resultant "rock candy"morphology was observed using light optical microscopy. Figures 4 and 5 show theintergranular morphology of the primary and secondary cracks, respectively. The green-coloredprimer was nonexistent along the length of the spindle, and the only evidence of the primercoating on the entire section was along the small portion of the shoulder shown in Figure 6.Visual evidence of the cadmium coating, as noted by white corrosion products, was onlyobserved along the threads, as shown in Figure 7, and was not present anywhere else on thefailed section. These coatings most likely wore off in service. The spindle itself showed areas ofheavy corrosion and pitting. Figure 8 shows the radius adjacent to the primary origin. Note thecorrosion pit that was only 0.031 in away from the fracture origin. Corrosion pits were alsoadjacent to the secondary origin, as shown in Figure 9. Corrosion pitting was prevalent along thespindle, and Figure 10 shows an example of a typical grouping of these pits within a corroded
Figure 2. Fracture surface of the failed part in the as-received condition(mag.-lx).crack front convergencebeach marksprimary crackshear lipsecondary crackFigure 3. The fracture surface using oblique lighting. Note the shear lip separating the primary and secondarycracks, as well as the beach marks (mag. 1.4x).
E2 S VBDHSV«HKJ VSH HTInaHftf M b9 HP V" n Hr -. Bl,-: i' V * :- r 'Ts-0ti M. -f;fT . T--. .* ' if;- . - * -? * m .Vfl -rf ., ». .A''«Kc 9-KJaflSJ B E « * Figure 4. Intergranular morphology observed within primary crack using lightoptical microscopy (mag. 30x).Figure 5. Intergranular morphology observed within secondary crack usinglight optical microscopy (mag. 30x).
Figure 6. The only evidence of the green epoxy primer was along this smallsection of the shoulder.Figure 7. The only evidence of cadmium on the failed part was in the threads,shown here as a white, powdery corrosion product energy dispersivespectroscopy (energy dispersive spectroscopy [EDS] confirmed thepresence of cadmium) (mag. 1.5x).
fracture surfacecorrosion pitc - lP?--.y Hmt--:* ":-*-' " -Zn"A- *-' * ' '" '"I-'s '* '-*' A? ?' ' . ; :; ;Fracture originFigure 8. Corrosion pits adjacent to the primary origin (mag. lOx).fracture surfacefracture origincorrosion pitsFigure 9. Corrosion pits adjacent to the secondary origin (mag. lOx).region. Also observed was a competing crack that was adjacent to the primary origin. Figure 11shows the intergranular nature of this crack. There was also evidence of intergranular attackalong this crack path. It was difficult to discern the exact location of the fracture origins;however, based upon the heavy corrosion in certain areas on both the primary and secondarycrack surfaces, the general location of the origins was surmised.
Figure 10. Group of pits observed along the spindle of the failed part. Pittingwas prevalent along the spindle region (mag. 25x). » a'- . Ä»*,'*:;Intergranular attackFigure 11. Competing crack path adjacent to primary fracture surface. Notethe intergranular nature of the crack, as well as the region ofintergranular attack (mag. 15x).
2.7MetallographyA section of material was taken approximately 3/4 in away from the fracture plane, such thatmetallographic examination could be performed. A transverse and longitudinal sample werepolished then etched with Marble's reagent (4-g CuSC 4, 20-mL HC1, and 20-mL deionizedwater). The structure was similar in both orientations and is shown in Figures 12 and 13. Thestructure was typical of Maraging 300 steel, consisting of an aged, low-carbon martensite. Inaddition, the material was fairly clean, exhibiting no gross defects or inclusions and containingno appreciable decarburization. However, the structure was not consistent with the priortreatment (annealed at 1500 F for 1 hr/in, cooled in air, then aged at 900 F for 4-6 hr andcooled in air). Section 3.4.1.3 of specification HMS 6-1081 requires a grain size of no. 7 or finerwith an occasional no. 5 unless otherwise specified for material up to 3 inches in diameter orsquare. The grain size was determined using four different methods: (1) American Society forTesting and Materials (ASTM) El 12 [4] charts overlaid onto photomicrographs at lOOx, (2)using a metallograph with grain size reticle, (3) by means of an incremented ruler reticle, and (4)examining SEM micrographs of the intergranular fracture. The grain size of this material wasFigure 12. Microstructure of the material showing aged, low-carbon martensitein the longitudinal direction. Marble's Reagent (mag. 50x).
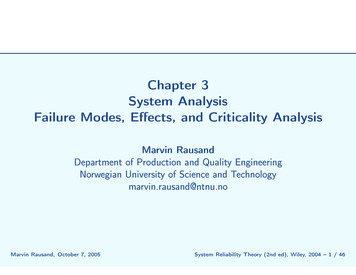
«3*3W&sM&iWM 'M,, ;?*? --';JSWM'Aw f M' flI" ; * lFigure 13. Microstructure similar to that in Figure 12 shown at highermagnification and in the transverse direction. Marble's Reagent(mag. lOOx).between nos. 2 and 3 at lOOx magnification using the ASTM El 12 charts over Figure 12. Toverify this, a photomicrograph was taken using a grain size reticle, as shown in Figure 14.Again, the size was between nos. 2 and 3. The ASTM El 12 charts indicate that the nominaldiameter of the average grain is between 0.005 and 0.007 in, respectively for a grain size ofnos. 3 and 2. A photomicrograph was subsequently taken of this structure at lOOx, using anincremented reticle (Figure 15). As shown, the grain appear to have diameters ranging from0.005-0.01 in, which correlated to the previous measurements. Subsequently, the intergranularfracture surface shown in Figure 18 (also see section 2.8) was also examined for grain size usingthe ASTM El 12 "Fracture Grain Size" method. This technique is typically used for highhardness, brittle steels with a predominantly martensitic structure, such as tool steels, highcarbon steels and martensitic stainless steels, and should be done with the specimen in the asquenched or lightly tempered condition. Even though the Maraging 300 steel is a low-carbonalloy, the results obtained compared favorably to those from the other three methods. FromFigure 18, the grain size ranged from -100-200 im, which correlated to a range of 0.004-0.008in.2.8 Electron Microscopy/EDSThe fracture surface of the component was subsequently examined using the scanning electronmicroscope (SEM) in order to determine the fracture morphology and fracture mechanism. Thefracture surface was -50% intergranular (the primary crack comprised 20%, while the secondarycrack was 30%). Figure 16 is a schematic showing the fractographic features of the surface. The10
Figure 14. Microstructure of the material with grain size reticle overlay. Thegrain measured between nos. 2 and 3. Marble's Reagent(mag. lOOx).Figure 15. Microstructure of the material with incremented reticle overlay.The grain size measured between 0.005 and 0.01 in. Marble'sReagent (mag. lOOx).11
crack front convergencesecondary crack plane (transgranular/ductile)'24 Iprimary crack plane(transgranular/ductile)23secondary originprimary crack (intergranular)secondary crack (intergranular)I 18Tnrnnprimary originshear lip2021Figure 16. Schematic of fracture features as determined through SEM. Numbers in boxes correspondto figure locations.morphology of the both the primary crack and the secondary crack was intergranular, as shownin Figures 17 and 18. Note the textbook "rock candy" morphology and the secondary crackingtypical of a brittle fracture. Figure 19 (taken within the secondary crack fracture surface) showsthis morphology at increased magnification. Note the evidence of micro-pores, which are typicalof 18% nickel maraging steel hydrogen-assisted failures [5]. These two crack fronts wereseparated by a shear lip, which failed in a ductile manner, as evidenced by the morphologyshown in Figure 20. Figure 21 shows the transition zone between the secondary crack and theadjacent shear lip that separated the two crack fronts. Figure 22 shows the transition zonebetween the primary crack and the transgranular/overload morphology. This was also typical ofthe transition zone between the secondary crack and the transgranular/overload region.Figures 23 and 24 show the transgranular/overload morphology that made up -45% of thefracture surface. Figure 25 shows this morphology at higher magnification. As shown, thissurface morphology represents very low cycle fatigue, in which the loading produces not onlythe transgranular morphology typical of fatigue, but also ductile dimples indicative of tensileoverload. No fatigue striations were discernible within the transgranular/overload regions. Anattempt was made to examine the fracture origins; however, the corrosion, as well as the natureof brittle failures, made it difficult to pinpoint the exact sites with 100% accuracy.12
Figure 17. Morphology of the primary fracture surface. "Rock candy" wasprevalent within this region (mag. lOOx).Figure 18. Morphology of the secondary fracture surface. "Rock candy" wasprevalent within this region (mag. lOOx).13
Figure 19. Magnified view of the intergranular morphology showing secondarycracking (mag. 200x).Figure 20. Ductile morphology noted within shear lip between the primary andsecondary fracture (mag. 1500x).14
Figure 21. Interface between the secondary fracture surface and the shear lip(mag. 50x).Figure 22. Interface between the primary fracture surface and the transgranular/overload region (mag. 50x).15
Figure 23. Morphology of the surface on the same plane as the primary fracturesurface subjected to fast-fracture, consisting of a transgranular/ductile mode (mag. lOOOx).Figure 24. Morphology of the surface on the same plane as the secondaryfracture surface subjected to fast-fracture, consisting of atransgranular/ductile mode (mag. lOOOx).16
Figure 25. Transgranular/ductile morphology at higher magnification(mag. 1800x).EDS was used in an effort to determine the presence of cadmium on the surface of the spindle.Exhaustive EDS spectra were generated along the spindle (and adjacent to the fracture origins),without revealing the presence of cadmium. Figure 26 is typical of the spectra generated in theseregions. In contrast, analysis of the threaded region (where white, powdery corrosion productswere noted) revealed the presence of cadmium as shown in Figure 27. The wear within thethreads may not have been as severe as along the spindle, such that the cadmium was stillsomewhat intact. This was evidence that the part had been cadmium coated at one time.Paragraph 3.3.3d of Process Specification HP 1-1, "Steel, Nickel-Base and Cobalt-Base Alloys,Heat Treatment of," states that maraging steel bars and forgings shall exhibit an aged martensiticstructure, fine grained, with no evidence of titanium-carbonitride at the grain boundaries. Themounted samples were repolished and etched with ferric chloride (5-g FeCi3, 50-mL HC1, and50 mL of distilled water) in order to reveal the austenitic grain boundaries. EDS wassubsequently used to determine the chemical composition of precipitates noted within the grainboundaries. Figure 28 shows an example of one of these precipitates (see white arrow). EDS ofthis precipitate (Figure 29) revealed a small amount of titanium, but no carbon or nitrogen.EDS was subsequently conducted on the intergranular fracture surface, in an attempt to locateTi (C, N) precipitates along the grain boundaries. Figure 30 shows a precipitate on a grainboundary of the "rock candy" surface that was analyzed. The resultant spectrum is displayed inFigure 31. Note the high level of titanium as well as the presence of carbon and nitrogen. Thiswas evidence of a titanium-carbonitride at the grain boundaries. Figure 32 shows an additionalprecipitate that revealed a similar spectrum.17
Sp«CLi«i«i: SpectrRrtny«:20koVTotal L,ount3 H4726.LinearAuto-vs 22600 KaljFcLfll/ BiKbl rL, ) T.Figure 26. Representative EDS spectra of the spindle of the failed part. No evidence of cadmiumwas noted along the spindle.SpPCt ruin:Ml XTHD5R»ngci20kcVTotal Counta-18476-LinearAuto-VS 29JITFigure 27. Representative EDS spectra within the threads of the failed part. Cadmium was notedwithin the threads.18
Gr boundariesFigure 28. SEM micrograph of polished and etched surface showing titanium precipitate (white arrow)within a grain boundary that was subjected to EDS (mag. 2000x).Spectrum: PEPS' I " i i I " i ' I iRange:10 TteV' I ' ' ' ' I ' ' ' ' I ' ' ' ' I ' ' ' ' I 'Total Counts 62651.' I ' " FeKal' I ' ' ' ' I 'Linear1Auto-VS 915I ' ' ' ' I ' ' ' ' I 'IKblBMünauiMiiuiirtiiH35m ' miI3-'Figure 29. EDS spectra showing evidence of titanium within the precipitate shown in Figure 28.Other elements constitute the alloy.19
Figure 30. SEM micrograph of intergranular morphology of the primaryfracture, showing the titanium-carbonitride precipitate that wasexamined using EDS (Figure 31) (mag. 1500x).Spectrum: SpectrumiRange:10keVTotal Counta ,6-ul62.LineareKaJT'M ' ! , lr ! ,- ' J :or'-K-'-ir-'-i'j-'-Tr*' !!VS.1000 ,,,,,,,l,i, ,„ir„,, r.,,,,ilr ,, Figure 31. EDS spectra of the Ti (C, N) precipitate shown in Figure 30. Note the presence oftitanium, carbon, and nitrogen, as well as the alloying elements.20
Figure 32. SEM micrograph of intergranular morphology of the primaryfracture, showing another titanium-carbonitride precipitate(mag. 1300x).2.9Chemical AnalysisA section of the shock strut mount was analyzed in order to determine the chemical compositionof the alloy. The material was required to conform to Specification HMS 6-1081. Thecomposition was determined by the Leco combustion method (carbon and sulfur) and inductivelycoupled argon plasma emission spectroscopy. The material met the requirements ofHMS 6-1081, as listed in Table 1.2.10 Hardness TestingRockwell hardness testing was conducted on the failed component, as well as the mountedsamples used for metallography. The part is required to exhibit a hardness between HRC 50-54,in accordance with HMS 6-1081. The average of six readings taken along the cylindrical
Marble's Reagent (mag. lOOx) 10 Figure 14. Microstructure of the material with grain size reticle overlay. The grain measured between nos. 2 and 3. Marble's Reagent (mag. lOOx) 11 Figure 15. Microstructure of the material with incremented reticle overlay. The grain size measured between 0.005 and 0.01 in. Ma