Transcription
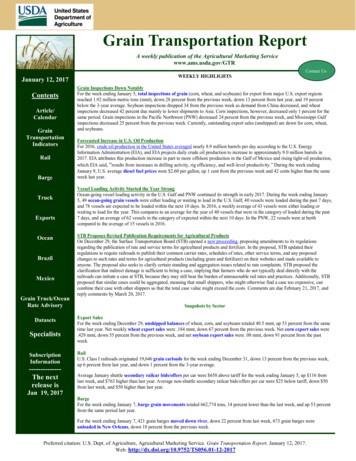
Grain Transportation ReportA weekly publication of the Agricultural Marketing Servicewww.ams.usda.gov/GTRJanuary 12, icatorsRailBargeTruckExportsOceanBrazilMexicoGrain Truck/OceanRate -------------The nextrelease isJan 19, 2017WEEKLY HIGHLIGHTSContact UsGrain Inspections Down NotablyFor the week ending January 5, total inspections of grain (corn, wheat, and soybeans) for export from major U.S. export regionsreached 1.92 million metric tons (mmt), down 28 percent from the previous week, down 13 percent from last year, and 19 percentbelow the 3-year average. Soybean inspections dropped 34 from the previous week as demand from China decreased, and wheatinspections decreased 42 percent due mainly to lower shipments to Asia. Corn inspections, however, decreased only 1 percent for thesame period. Grain inspections in the Pacific Northwest (PNW) decreased 24 percent from the previous week, and Mississippi Gulfinspections decreased 25 percent from the previous week. Currently, outstanding export sales (unshipped) are down for corn, wheat,and soybeans.Forecasted Increase in U.S. Oil ProductionFor 2016, crude oil production in the United States averaged nearly 8.9 million barrels per day according to the U.S. EnergyInformation Administration (EIA), and EIA projects daily crude oil production to increase to approximately 9.0 million barrels in2017. EIA attributes this production increase in part to more offshore production in the Gulf of Mexico and rising tight-oil production,which EIA said, “results from increases in drilling activity, rig efficiency, and well-level productivity.” During the week endingJanuary 9, U.S. average diesel fuel prices were 2.60 per gallon, up 1 cent from the previous week and 42 cents higher than the sameweek last year.Vessel Loading Activity Started the Year StrongOcean-going vessel loading activity in the U.S. Gulf and PNW continued its strength in early 2017. During the week ending January5, 49 ocean-going grain vessels were either loading or waiting to load in the U.S. Gulf, 40 vessels were loaded during the past 7 days,and 78 vessels are expected to be loaded within the next 10 days. In 2016, a weekly average of 43 vessels were either loading orwaiting to load for the year. This compares to an average for the year of 40 vessels that were in the category of loaded during the past7 days, and an average of 62 vessels in the category of expected within the next 10 days. In the PNW, 22 vessels were at berthcompared to the average of 15 vessels in 2016.STB Proposes Revised Publication Requirements for Agricultural ProductsOn December 29, the Surface Transportation Board (STB) opened a new proceeding, proposing amendments to its regulationsregarding the publication of rate and service terms for agricultural products and fertilizer. In the proposal, STB updated theirregulations to require railroads to publish their common carrier rates, schedules of rates, other service terms, and any proposedchanges to such rates and terms for agricultural products (including grain and fertilizer) on their websites and made available toanyone. The proposal also seeks to clarify certain standing and aggregation issues related to rate complaints. STB proposed theclarification that indirect damage is sufficient to bring a case, implying that farmers who do not typically deal directly with therailroads can initiate a case at STB, because they may still bear the burden of unreasonable rail rates and practices. Additionally, STBproposed that similar cases could be aggregated, meaning that small shippers, who might otherwise find a case too expensive, cancombine their case with other shippers so that the total case value might exceed the costs. Comments are due February 21, 2017, andreply comments by March 20, 2017.Snapshots by SectorExport SalesFor the week ending December 29, unshipped balances of wheat, corn, and soybeans totaled 40.5 mmt, up 53 percent from the sametime last year. Net weekly wheat export sales were .184 mmt, down 67 percent from the previous week. Net corn export sales were.429 mmt, down 55 percent from the previous week, and net soybean export sales were .08 mmt, down 91 percent from the pastweek.RailU.S. Class I railroads originated 19,646 grain carloads for the week ending December 31, down 13 percent from the previous week,up 6 percent from last year, and down 1 percent from the 3-year average.Average January shuttle secondary railcar bids/offers per car were 658 above tariff for the week ending January 5, up 116 fromlast week, and 763 higher than last year. Average non-shuttle secondary railcar bids/offers per car were 25 below tariff, down 50from last week, and 50 higher than last year.BargeFor the week ending January 7, barge grain movements totaled 662,774 tons, 14 percent lower than the last week, and up 53 percentfrom the same period last year.For the week ending January 7, 421 grain barges moved down river, down 22 percent from last week, 673 grain barges wereunloaded in New Orleans, down 18 percent from the previous week.Preferred citation: U.S. Dept. of Agriculture, Agricultural Marketing Service. Grain Transportation Report. January 12, 2017.Web: http://dx.doi.org/10.9752/TS056.01-12-2017
Feature Article/CalendarFourth Quarter Grain Inspections Reach Record LevelTotal inspections of grain (wheat, corn, and soybeans) shipped from major U.S. ports reached 48 millionmetric tons (mmt) during the fourth quarter of 2016, according to the Grain Inspection, Packers, andStockyards Administration (GIPSA) (see figure 1). Total grain inspections were 22 percent above the samequarter last year and 34 percent above the 5-year average. Demand for grain transportation remained strongfollowing a large fall harvest, which increased demand for grain transportation during the third quarter aswell. Total shipments of corn, soybeans, and wheat were up during the fourth quarter. Total exports ofgrain increased primarily to Asia and Latin America. Soybeans inspected for export to China (22.1 mmt)increased 20 percent from the fourth quarter of last year, accounting for 71 percent of total soybeaninspections.According to GIPSA, U.S. Gulf fourth-quarter grain inspections reached a record 28.2 mmt, up 22 percentfrom last year and 33 percent above the 5-year average (see figure 1). Fourth-quarter inspections of corn,soybeans, and wheat increased in the U.S. Gulf. Corn and wheat inspections in the Gulf jumped 59 and 40percent from the past year. Rail deliveries of grain to the U.S. Gulf increased 49 percent during the fourthquarter. Fourth-quarter barge grain movements on the Mississippi River were up 24 percent from the sametime last year. Ocean freight rates for shipping grain through the Gulf were above the fourth quarter of2015 and the third quarter of 2016, as demand for grain transportation shipped from the Gulf, and othermajor export regions remained steady.Fourth-quarter Pacific Northwest(PNW) grain inspections reached arecord 13.1 mmt, 22 percent above lastyear, and 41 percent above the 5-yearaverage. Fourth-quarter PNW corninspections were the highest since2013, increasing 472 percent from lastyear, and PNW soybean inspectionsincreased 15 percent for the sameperiod. Wheat inspections in the PNW,however, decreased 8 percent to 2.5mmt, primarily due to decreasedshipments to Asia. Rail deliveries ofgrain to the PNW increased 12 percentfrom last year during the fourthquarter. Similar to the Gulf, fourthquarter ocean freight rates for shippinggrain from the PNW were also abovethe third quarter of 2016 and the fourth quarter last year.Grain inspections for the Atlantic/Great Lakes region reached 2.7 mmt, up 25 percent above last year and32 percent above the 5-year average. Fourth-quarter corn, wheat, and soybean inspections rebounded in theAtlantic/Great Lakes region during the fourth quarter. Interior inspections of grain during the same periodreached 3.8 mmt, up 24 percent from last year, and 21 percent above the 5-year average. Fourth-quarterInterior corn and soybean inspections increased 16 and 30 percent from last year, as shipments to Asiarebounded. Interior wheat inspections jumped 44 percent from last year due primarily to increasedshipments to Mexico.Corn, Soybean and Wheat Inspections IncreaseTotal inspections of corn in all regions reached 11.1 mmt during the fourth quarter, a 68 percent jump fromlast year, and 37 percent above the 5-year average (see figure 2). PNW corn inspections jumped to 1.7mmt, as shipments to Asia rebounded. U.S. Gulf corn inspections totaled 7.3 mmt, up 59 percent from lastyear, and 36 percent above the 5-year average. Atlantic/Great Lakes corn inspections reached .289 mmt, up86 percent from last year, and 103 percent above the 5-year average. Interior corn inspections were up fromGrain Transportation Report2January 12, 2017
last year. The USDA’s World Agricultural Supply and Demand (WASDE) in December projects total cornexports for the 2015/16 marketing year to decrease 6 percent from 2014/15.Fourth-quarter wheat inspections reached 5.7 mmt, up 15 percent from last year and 10 percent above the5-year average (see figure 2). Gulf wheat inspections 2.3 mmt) increased 40 percent from the previous yearas shipments increased to Latin America and Africa. PNW wheat inspections reached 2.5 mmt, down 8percent from last year and 4 percent above the 5-year average. Fourth-quarter Atlantic/Great Lakes wheatinspections (.500 mmt) increased 58 percent from last year, and Interior wheat inspections (.397 mmt)increased 44 percent for the same period. For the 2016/17 marketing year, the USDA’s most recentWASDE report projects total wheat exports to increase 26 percent from the previous year.Fourth-quarter soybeaninspections reached arecord 31.2 mmt, up 13percent from last year, and37 percent above the 5-yearaverage (see figure 2).Inspections of soybeansshipped to Asia increased24 percent from last year.U.S. Gulf soybeaninspections reached 18.6mmt, up 10 percent fromlast year, and 36 percentabove the average. PNWsoybean inspectionsreached 8.9 mmt, 15percent above last year, and53 percent above the 5-yearaverage. The Atlantic- Great Lakes soybean inspections totaled 1.9 mmt, up 13 percent from last year, and21 percent above the 5-year average. Interior soybean inspections reached 1.7 mmt, up 30 percent fromlast year, and 19 percent above the 5-year average. Recent WASDE estimates project soybean exports forthe 2016/17 marketing year to increase 6 percent from the past year. Johnny.Hill@ams.usda.govGrain Transportation Report3January 12, 2017
Grain Transportation IndicatorsTable 1Grain Transport Cost Indicators 1TruckFor the week ending01/11/1701/04/17RailBargeUnit TrainS huttle1742682300%# D IV / 0 !174261232OceanGulfPacific17815712619 %- 1%-3 %1491591291Indicator: Base year 2000 100; Weekly updates include truck diesel ( /gallon); rail near-month secondary rail market bid and monthly tariff ratewith fuel surcharge ( /car); barge Illinois River barge rate (index percent of tariff rate); and ocean routes to Japan ( /metric ton)Source: T ransportation & Marketing Programs/AMS/USDATable 2Marke t Update : U.S. Origins to Export Position Price Spre ads ( /bushe d-2.04n/aNot e: nq no quot e; n/a not availableSource: T ransport at ion & Market ing Programs/AMS/USDAThe grain bid summary illustrates the market relationships for commodities. Positive and negative adjustments in differential between terminal and futures markets, and the relationship to inland market points, are indicators of changes in fundamental marketsupply and demand. The map may be used to monitor market and time differentials.Figure 1Grain bid SummaryGrain Transportation Report4January 12, 2017
Rail TransportationTable 3Rail Deliveries to Port (carloads) 1MississippiPacificAtlantic &Cross-Border3For the Week EndingGulfTexas GulfNorthwestEast GulfTotalWeek 6907,54111512/31/201612/24/20162016 YTD2015 YTD% change 30131120452,576355,632Last 4wks % 2015Last 4wks % 4 yrTotal 2015Total 201410212097,73698,42201/04/2017r12/28/2016r2017 YTDr2016 YTD2017 YTD as % of 2016 YTDLast 4 weeks as % of 20162Last 4 weeks as % of 4-year avg.2Total 2016Total 20151Data is incomplete as it is voluntarily providedCompared with same 4-weeks in 2015 and prior 4-year average.3Cross-border weekly data is approximately 15 percent below the Association of American Railroads' reported weekly carloads received by Mexican railroadsto reflect switching between KCSM and FerroMex.YTD year-to-date; p preliminary data; r revised data; n/a not availableSource: T ransportation & Marketing Programs/AMS/USDA2Railroads originate approximately 24 percent of U.S. grain shipments. Trends in these loadings are indicative ofmarket conditions and expectations.Figure /13Carloads - 4-week running averageRail Deliveries to PortPacific Northwest: 4 wks. ending 1/04--up 13% from same period last year; up 21% from 4-year averageTexas Gulf: 4 wks. ending 1/04--up 61% from same period last year; up 61% from 4-year averageMiss. River: 4 wks. ending 1/04--up 169% from same period last year; down 23% from 4-year averageCross-border: 4 wks. ending 12/31--up 2% from same period last year; up 20% from 4-year averageSource: T ransportation & Marketing Programs/AMS/USDAGrain Transportation Report5January 12, 2017
Table 4Class I Rail Carrier Grain Car Bulletin (grain carloads originated)For the week ending:12/31/2016EastWestCS XTNSBNS FKCSU.S . totalUPCanadaCNCPThis week1,6752,29010,6714104,60019,6463,1214,012This week last year1,9212,4769,4693234,28818,4772,7093,5312016 90234,7382015 899236,2632016 YTD as % of 2015 YTD911011101001121079299Last 4 weeks as % of 2015*102111107124120111103100Last 4 weeks as % of 3-yr 445267,7201,102,433Total 2015210,899236,263*T he past 4 weeks of this year as a percent of the same 4 weeks last year.**T he past 4 weeks as a percent of the same period from the prior 3-year average. YT D year-to-date.Source: Association of American Railroads (www.aar.org)Figure 3Total Weekly U.S. Class I Railroad Grain Car Loadings29,000For the 4 weeks ending December 31, grain carloadings were down 6 percent from the previous week, up 11percent from last year, and up 7 percent from the 3 -year average.Car or 3-year, 4-week averageCurrent 4-week averageSource: Association of American RailroadsTable 5Railcar Auction Offerings 1 ( /car)2For the week ending:1/5/2017Delivery r-16BNSF3CO T grain unitsCO T grain single -car 5151440016000no bids34no bids0-1no bids7no bids0-1UP4GCAS/Re gion 1GCAS/Re gion 2no bidsno bidsno bidsno bidsno bidsno bidsno bidsno bidsno bidsno bidsno bidsno bidsn/an/an/an/a1Auc tio n o ffe rings a re fo r s ingle -c a r a nd unit tra in s hipm e nts o nly.2Ave ra ge pre m ium /dis c o unt to ta riff, la s t a uc tio n3B NS F - C OT C e rtific a te o f Tra ns po rta tio n; no rth gra in a nd s o uth gra in bids we re c o m bine d e ffe c tive the we e k e nding 6/24/06.4UP - GC AS Gra in C a r Allo c a tio n S ys te mR e gio n 1 inc lude s : AR , IL, LA, M O, NM , OK, TX, WI, a nd Duluth, M N.R e gio n 2 inc lude s : C O, IA, KS , M N, NE, WY, a nd Ka ns a s C ity a nd S t. J o s e ph, M O.5R a nge is s ho wn be c a us e a ve ra ge is no t a va ila ble . No t a va ila ble n/a .S o urc e : Tra ns po rta tio n & M a rke ting P ro gra m s /AM S /US DA.Grain Transportation Report6January 12, 2017
The secondary rail market information reflects trade values for service that was originally purchased from the railroad carrier assome form of guaranteed freight. The auction and secondary rail values are indicators of rail service quality and demand/supply.14001200100080060040020001/5/2017BNS FUP 0- 50Non-S huttleS huttle 1,267 50ShuttleShuttle prior 3-yr avg. (same 0/2016-2006/2/2016Average premium/discount to tariff( /car)Figure 4Bids/Offers for Railcars to be Delivered in January 2017, Secondary MarketNon-ShuttleNon-Shuttle prior 3-yr avg. (same week)Average Non-shuttle bids/offers fell 50 this week, and are 50 below the peak.Average Shuttle bids/offers rose 116 this week and are at the peak.Non-shuttle bids include unit-train and single-car bids. n/a not available.Source: Transportation & Marketing P rograms/AMS/USDA1/5/2017Non-S huttleS huttleBNS FUPn/a- 100 900n/aShuttleShuttle prior 3-yr avg. (same rage premium/discount to tariff( /car)Figure 5Bids/Offers for Railcars to be Delivered in February 2017, Secondary MarketNon-ShuttleNon-Shuttle prior 3-yr avg. (same week)T here were no Non-Shuttle bids/offers last week. Average Non-Shuttle bids/offers this week are at the peak.T here were no Shuttle bids/offers last week. Average Non-Shuttle bids/offers this week are at the peak.Non-shuttle bids include unit-train and single-car bids. n/a not available.Source: Transportation & Marketing P rograms/AMS/USDAGrain Transportation Report7January 12, 2017
1/5/2017BNS FUPn/an/a 300n/aNon-S huttleS huttleShuttleShuttle prior 3-yr avg. (same verage premium/discount to tariff( /car)Figure 6Bids/Offers for Railcars to be Delivered in March 2017, Secondary MarketNon-ShuttleNon-Shuttle prior 3-yr avg. (same week)T here were no Non-Shuttle bids/offers this week.T here were no Shuttle bids/offers last week. Average Non-Shuttle bids/offers this week are at the peak.Non-shuttle bids include unit-train and single-car bids. n/a not available.Source: Transportation & Marketing P rograms/AMS/USDATable 6Weekly Secondary Railcar Market ( /car) 1Delivery periodFor the week 70n/an/an/an/an/a(100)n/an/an/an/an/aChange from same week hange from last week0n/an/an/an/an/aChange from same week 201650n/an/an/an/an/a1267900300(200)n/an/aChange from last week150n/an/an/an/an/aChange from same week nge from last week81n/an/an/an/an/aChange from same week 2016163n/an/an/an/an/aNon-shuttleBNSF-GFChange from last weekShuttleBNSF-GF1Ave ra ge pre m ium /dis c o unt to ta riff, /c a r-la s t we e kNo te : B ids lis te d a re m a rke t INDIC ATOR S o nly & a re NOT gua ra nte e d pric e s ,n/a no t a va ila ble ; GF gua ra nte e d fre ight; P o o l gua ra nte e d po o lS o urc e s : Tra ns po rta tio n a nd M a rke ting P ro gra m s /AM S /US DADa ta fro m J a m e s B . J o ine r C o ., Tra de we s t B ro ke ra ge C o .Grain Transportation Report8January 12, 2017
The tariff rail rate is the base price of freight rail service, and together with fuel surcharges and any auction and secondary railvalues constitute the full cost of shipping by rail. Typically, auction and secondary rail values are a small fraction of the fullcost of shipping by rail relative to the tariff rate. High auction and secondary rail values, during times of high rail demand orshort supply, can exceed the cost of the tariff rate plus fuel surcharge.Table 7Tariff Rail Rate s for Unit and Shuttle Train Shipme nts 1TariffJanuary, 2017rate/carFuelsurcharge Tariff plus surcharge per:bushel 2per carmetric tonPercentchangeY/Y3Origin region*Destination region*Wichita, KSSt. Louis, MO 3,770 35 37.79 1.034Grand Forks, NDDuluth-Superior, MN 4,143- 3 41.11 1.1216Wichita, KSLos Angeles, CA 6,950- 15 68.86 1.870Wichita, KSNew Orleans, LA 4,408 62 44.39 1.214Sioux Falls, SDGalveston-Houston, TX 6,686- 13 66.27 1.803Northwest KSGalveston-Houston, TX 4,676 68 47.11 1.283Amarillo, TXLos Angeles, CA 4,875 95 49.35 1.343Champaign-Urbana, ILNew Orleans, LA 3,681 70 37.25 0.950Toledo, OHRaleigh, NC 6,061 0 60.19 1.530Des Moines, IADavenport, IA 2,258 15 22.57 0.574Indianapolis, INAtlanta, GA 5,191 0 51.55 1.314Indianapolis, INKnoxville, TN 4,311 0 42.81 1.090Des Moines, IALittle Rock, AR 3,534 44 35.53 0.902Des Moines, IALos Angeles, CA 5,202 128 52.93 1.343Minneapolis, MNNew Orleans, LA 3,639 37 36.51 0.99-2Toledo, OHHuntsville, AL 5,051 0 50.16 1.370Indianapolis, INRaleigh, NC 6,178 0 61.35 1.670Indianapolis, INHuntsville, AL 4,529 0 44.98 1.220Champaign-Urbana, ILNew Orleans, LA 4,495 70 45.34 1.232Great Falls, MTPortland, OR 3,953- 9 39.17 1.070Wichita, KSGalveston-Houston, TX 4,071- 7 40.36 1.104Chicago, ILAlbany, NY 5,492 0 54.54 1.480Grand Forks, NDPortland, OR 5,611- 15 55.57 1.510Grand Forks, NDGalveston-Houston, TX 5,931- 16 58.74 1.600Northwest KSPortland, OR 5,643 112 57.15 1.563Minneapolis, MNPortland, OR 5,000- 19 49.47 1.260Sioux Falls, SDTacoma, WA 4,960- 17 49.09 1.250Champaign-Urbana, ILNew Orleans, LA 3,481 70 35.27 0.900Lincoln, NEGalveston-Houston, TX 3,700- 10 36.64 0.933Des Moines, IAAmarillo, TX 3,895 55 39.23 1.002Minneapolis, MNTacoma, WA 5,000- 18 49.47 1.260Council Bluffs, IAStockton, CA 4,740- 19 46.88 1.192Sioux Falls, SDTacoma, WA 5,600- 17 55.44 1.512Minneapolis, MNPortland, OR 5,650- 19 55.92 1.522Fargo, NDTacoma, WA 5,500- 15 54.47 1.482Council Bluffs, IANew Orleans, LA 4,525 81 45.74 1.242Toledo, OHHuntsville, AL 4,226 0 41.97 1.140Grand Island, NEPortland, OR 5,460 115 55.36 1.512Unit trainWheatCornSoybeansS huttle TrainWheatCornSoybeans1A unit train refers to shipments of at least 25 cars. Shuttle train rates are available for qualified shipments of2Approximate load per car 111 short tons (100.7 metric tons): corn 56 lbs./bu., wheat & soybeans 60 lbs./bu.3Percentage change year over year calculated using tariff rate plus fuel surchage75-120 cars that meet railroad efficiency requirements.Sources: www.bnsf.com, www.cpr.ca, www.csx.com, www.uprr.com*Regional economic areas defined by the Bureau of Economic Analysis (BEA)Grain Transportation Report9January 12, 2017
Table 8Tariff Rail Rate s for U.S. Bulk Grain Shipme nts to Me xicoDate: January, 2017OriginCommodity stateDestination regionWheatMTChihuahua, CIOKCuautitlan, EMKSGuadalajara, JATXSalinas Victoria, NLTariffrate/car1 7,459 6,638 7,180 4,258FuelPercentsurcharge Tariff plus surcharge per: change 4per car2 metric ton 3bushel 3Y/Y 0 76.21 2.070 49 68.32 1.862 260 76.01 2.075 29 43.80 1.193CornIASDNESDMOSDGuadalajara, JACelaya, GJQueretaro, QASalinas Victoria, NLTlalnepantla, EMTorreon, CU 8,187 7,580 7,909 6,635 7,268 7,180 203 0 99 0 97 0 85.73 77.45 81.82 67.79 75.25 73.36 2.18 1.97 2.08 1.72 1.91 1.86-1-3111-1SoybeansMONEIAKSBojay (Tula), HGGuadalajara, JAEl Castillo, JATorreon, CU 8,647 8,942 8,960 7,489 217 217 0 140 90.56 93.58 91.55 77.95 2.46 2.54 2.49 2.121-1-51SorghumNEKSNENECelaya, GJQueretaro, QASalinas Victoria, NLTorreon, CU 7,164 7,608 6,213 6,607 179 61 49 125 75.02 78.35 63.98 68.79 1.90 1.99 1.62 1.75-201-31Rates are based upon published tariff rates for high-capacity shuttle trains. Shuttle trains are available for qualifiedshipments of 75--110 cars that meet railroad efficiency requirements.2Fuel surcharge adjusted to reflect the change in Ferrocarril Mexicano, S.A. de C.V railroad fuel surcharge policy as of 10/01/20093Approximate load per car 97.87 metric tons: Corn & Sorghum 56 lbs/bu, Wheat & Soybeans 60 lbs/buPercentage change calculated using tariff rate plus fuel surchageSources: www.bnsf.com, www.uprr.com, www.kcsouthern.com4Figure 7Railroad Fuel Surcharges, North American Weighted Average 1 0.70Dollars per railcar mile 0.60January, 2017: 0.02, unchanged from last month's surcharge of 0.02/mile; down 1 cents from the January 2016 surcharge of 0.03/mile; and down 17 cents from the January prior 3-year average of 0.19/mile.3-Year Monthly Average 0.50Fuel Surcharge* ( /mile/railcar) 0.40 0.30 0.20 0.10 0.00- 0.10Weighted by each Class I railroad's proportion of grain traffic for the prior year.* Beginning January 2009, the Canadian Pacific fuel surcharge is computed by a monthly average of the bi -weekly fuel surcharge.**CSX strike price changed from 2.00/gal. to 3.75/gal. starting January 1, 2015.Sources: www.bnsf.com, www.cn.ca, www.cpr.ca, www.csx.com, www.kcsi.com, www.nscorp.com, www.uprr.com1Grain Transportation Report10January 12, 2017
Barge TransportationFigure 8Illinois River Barge Freight Rate 1,21200Weekly ratePercent of tariff1000For the week ending January 10: 20 percent higher than last week, 12percent higher than last year, and 26 percent lower than the 3-year average.3-year avg. forthe 602/23/1601/26/1602/09/1601/12/160Rate percent of 1976 tariff benchmark index (1976 100 percent); 2 4-week moving average of the 3-year average.Source: T ransportation & Marketing Programs/AMS/USDATable 9Weekly Barge Freight Rates: Southbound OnlyTwinCitiesMidMississippiLowerIllinoisRiverSt. 1/3/2017--320268213185235208235208188160 9.498.405.905.02Current week % change from the same week:Rate1Last year3-year avg. 031682April325 index (1976 270185168orRate percentof 1976 tariff benchmark 100 percent);2604-week movingaverage; ton 1952,000 pounds;195- closed for winterfloodingSource: T ransportation & Marketing Programs/AMS/USDA1Figure 9Benchmark tariff ratesTwin Cities 6.19Calculating barge rate per ton:(Rate * 1976 tariff benchmark rate per ton)/100Mid-Mississippi 5.32Illinois 4.64St. Louis 3.99Select applicable index from market quotes included intables on this page. The 1976 benchmark rates per tonare provided in map.Grain Transportation ReportCincinnati 4.69Cairo-Memphis 3.1411Lower Ohio 4.04January 12, 2017
Figure 10Barge Movements on the Mississippi River1 (Locks 27 - Granite City, IL)Soybeans For the week ending January 7: up 85 percent from last yearWheatand up 31 percent from the 3-yr avg.Corn3-Year Average1,0001,000 /1612/10/1612/24/1601/07/1701/21/1702/04/17200T he 3-year average is a 4-week moving average.Source: U.S. Army Corps of EngineersTable 10Barge Grain Movements (1,000 tons)For the week ending 1/07/2017Mississippi RiverRock Island, IL (L15)Winfield, M O (L25)Alton, IL (L26)Granite City, IL (L27)Illinois River (L8)Ohio River (L52)Arkansas River (L1)Weekly total - 2017Weekly total - 201612017 YTD2016 YTD2017 as % of 2016 YTD2Last 4 weeks as % of 2016Total 2016CornWheatS 0210n/a35234466343466343415311143,1781Weekly total, YT D (year-to-date) and calendar year total includes Miss/27, Ohio/52, and Ark/1; "Other" refers to oats, barley,sorghum, and rye.2As a percent of same period in 2016.Note: T otal may not add exactly, due to roundingSource: U.S. Army Corps of EngineersGrain Transportation Report12January 12, 2017
Figure 11Upbound Empty Barge s Transiting Mississippi Rive r Locks 27, Arkansas Rive rLock and Dam 1, and Ohio Rive r Locks and Dam 52For t he week ending January 7: 428t ot al barges, down 233 from theprevious week, and 10 percent lowert han t he 3-year avg.700Number of 2/10/1612/17/1612/24/1612/31/161/7/17100Miss. Locks 27Ark Lock 1Ohio Locks 52Source: U.S. Army Corps of EngineersFigure 12Grain Barges for Export in New Orleans Region1200For the week ending January 7: 421 grain barges moveddown river, down 22 percent from last week, 673 grainbarges were unloaded in New Orleans, down 18 percentfrom the previous 15Grain Barges Unloaded in New Orleans9/19/150Downbound Grain Barges Locks 27, 1, and 526/25/16Number of barges1000Source: U.S. Army Corps of Engineers and GIPSAGrain Transportation Report13January 12, 2017
Truck TransportationThe weekly diesel price pro
Dec 17, 2001 · last week, and 763 higher than last year. Average non-shuttle secondary railcar bids/offers per car were 25 below tariff, down 50 from last week, and 50 higher than last year. Barge For the week ending January 7, barge grain movements totaled 662,774 tons, 14 percent lower than the last week, and up 53