Transcription
European Food Research and Technology (2021) 03747-5ORIGINAL PAPERIdentification and quantification of dicarboxylic fatty acids in headtissue of farmed Nile tilapia (Oreochromis niloticus)Katja Lehnert1· Mamun M. Rashid2 · Benoy Kumar Barman2 · Walter Vetter1Received: 11 February 2021 / Revised: 29 March 2021 / Accepted: 3 April 2021 / Published online: 21 April 2021 The Author(s) 2021AbstractNile tilapia (Oreochromis niloticus) was grown in Bangladesh with four different feeding treatments as part of a project thataims to produce fish in a cost-effective way for low-income consumers in developing countries. Fillet and head tissue wasanalysed because both tissues were destined for human consumption. Gas chromatography with mass spectrometry (GC/MS) analyses of transesterified fatty acid methyl ester extracts indicated the presence of 50 fatty acids. Major fatty acidsin fillet and head tissue were palmitic acid and oleic acid. Both linoleic acid and polyunsaturated fatty acids with three ormore double bonds were presented in quantities 10% of total fatty acids in fillet, but lower in head tissue. Erucic acid levelswere below the newly proposed tolerable daily intake in the European Union, based on the consumption of 200 g fillet perday. Moreover, further analysis produced evidence for the presence of the dicarboxylic fatty acid azelaic acid (nonanedioicacid, Di9:0) in head tissue. To verify this uncommon finding, countercurrent chromatography was used to isolate Di9:0 andother dicarboxylic acids from a technical standard followed by its quantification. Di9:0 contributed to 0.4–1.3% of the fattyacid profile in head tissue, but was not detected in fillet. Fish fed with increasing quantities of flaxseed indicated that linoleicacid was the likely precursor of Di9:0 in the head tissue samples.Keywords Farmed fish · Nile tilapia · Fatty acid · Dicarboxylic acid · Azelaic acid · Countercurrent chromatographyIntroductionFish is a rich source of easily digestible proteins, omega-3fatty acids and essential micronutrients. Hence, variousdietary recommendations suggest the regular intake of 1–2servings of fish and seafood per week [1]. On average, about20 kg of fish per capita is annually consumed worldwide [2].To satisfy this high marked demand, aquaculture has significantly increased since the 1970s [2]. In 2018, the production volume of animals from aquaculture reached 82 milliontonnes worldwide, with 62.5% from inland aquaculture (51million tonnes). After carp (Cyprinidae), the production ofNile tilapia (Oreochromis niloticus) (8.3% of total finfishproduction in 2018) established as second largest mass offarmed finfish in the last decade [2]. Tilapia is mostly raised* Walter Vetterwalter.vetter@uni-hohenheim.de1Institute of Food Chemistry (170b), Universityof Hohenheim, 70593 Stuttgart, Germany2WorldFish Bangladesh and South Asia, House 42/A, RoadNo. 114, Gulshan‑2, Dhaka 1212, Bangladeshin Southeast Asia (with China being the biggest producer)and mainly farmed extensively to semi intensively [2].Nile tilapia was selected for the development of costeffective methods to improve the production and nutritionalquality of tilapia for low-income consumers in developingcountries [3, 4]. Suitable quality markers for nutritionalvalue are the content of polyunsaturated fatty acids (PUFAs)which include the essential fatty acids eicosapentaenoic acid(20:5n-3, EPA) and docosahexaenoic acid (22:6n-3, DHA)[1]. Moreover, in several cultures not only fillet, but alsohead tissue is consumed. We thoroughly analysed the fattyacid pattern of fillet and head issue of tilapia raised withdifferent feed. Initial screening resulted in the detection ofan uncommon fatty acid which indicated the presence ofthe dicarboxylic acid azelaic acid (HOOC–(CH2)7–COOH,IUPAC name: nonanedioic acid).The goal of this study was to verify the presence ofazelaic acid and to determine its concentrations in the fishsamples. To gain insights into its possible origins, fillet andhead tissue from fish raised by four different feed compositions were analysed for fatty acids. The data were usedto trace back the origins of this fatty acid. For this reason,13Vol.:(0123456789)
1772European Food Research and Technology (2021) 247:1771–1780azelaic acid and further dienoic fatty acids (DiFAs) wereisolated from a technical standard and purified by countercurrent chromatography (CCC). CCC is a (semi)preparativeall-liquid based sample preparation method preferably usedin natural product isolation [5]. Isolated compounds wereused for structure determination and the preparation of astandard mixture for GC/MS analysis.increasing amounts of flax seed powder and orange sweetpotato (Table 1). Fish were raised in cages for five months toan average weight of 300–350 g. Fillet and head tissue weretaken from five individuals per treatment. Fillet (n 20) andhead tissue (n 20) samples were freeze-dried and shippedto the partner laboratory in Germany for fatty acid analysis.Samples were kept frozen until analysis within a few weeksupon arrival.Materials and methodsFatty acid analysisChemicals and standardsFreeze-dried samples were homogenised with a laboratorymill (IKA basic, Staufen, Germany). Between 0.3 and 0.5 gfillet or head tissue was used for lipid extraction by meansof accelerated solvent extraction (Dionex ASE 350, ThermoFisher Scientific, Waltham/MA, USA) using the azeotropicmixture of cyclohexane and ethyl acetate (46:54, w/w) [8].The lipid extract was concentrated in a rotary evaporatorand adjusted to a defined volume. An aliquot (1 mL) wasused for the gravimetric determination of the fat content indry matter [6]. For fatty acid determinations, 0.2 mg lipidsand the internal standard DC-11:0 (ISTD I) were placed in a6 mL test tube. Transesterification was performed by adding2 mL methanol complemented with 1% sulphuric acid. Theresulting sample solution was heated to 80 C for two 2 hand afterwards cooled on an ice bath. Then, 2 mL n-hexane, 0.5 mL saturated sodium chloride solution and 0.5 mLdemin. water were added and the sample was thoroughlyshaken. After phase separation, the upper organic phase wasseparated [9]. Another internal standard (14:0-EE, ISTD II)was added before analysis by gas chromatography with massspectrometry (GC/MS) [6]. Measurements were carried outwith a 5890 series II/5972A GC/MS system equipped witha 7673 autoinjector (Hewlett-Packard/Agilent, Waldbronn,Germany). Helium (purity 99.9990%) was used as the carrier gas at a constant flow rate of 1 mL/min. An Rtx-2330fused silica column (60 m length, 0.25 mm i.d., 0.1 µm filmMethanol, n-hexane (both HPLC grade), cyclohexane (p.a.)and acetonitrile (99.5%, p.a.) were from Th. Geyer (Renningen, Germany). Ethyl acetate (p.a.) was from SigmaAldrich (Steinheim, Germany), sulphuric acid (96%,p.a.) and sodium chloride ( 99.5%, p.a.) from Carl Roth(Karlsruhe, Germany), azelaic acid (nonane-1,9-dioic acid,Di9:0) (purity 80%) and brassylic acid (tridecane-1,13-dioicacid, Di13:0) (purity 96.0%) were from TCI (Antwerpen/Belgium). Additional fatty acids as well as a 37 componentFAME mix were purchased from Supelco (Taufkirchen,Germany). The internal standards 10,11-dichloroundecanoic acid (DC-11:0) and myristic acid ethyl ester (14:0-EE)were synthesised in our research group [6]. Nitrogen (quality4.8) and helium (quality 5.0) were from Westfalen Company(Münster, Germany).Sample descriptionSamples were obtained during 2018 within the BMZ/GIZsupported AquaLINC (Aquaculture for Low Income Consumers) project [7] hosted by WorldFish. In this project,genetically improved farmed Nile tilapia (Oreochromisniloticus), hereafter tilapia, was grown in Bangladeshwith four different feed compositions (FC1-FC4) based onTable 1 Feed compositions(FC1–FC4) [%]a of the fourtreatments of farmed Niletilapia (Oreochromis niloticus)FC1Flax seed powderSweet potatoWheat flourMaizeRice polish-ADe-oiled rice bran (DORB)Di-calcium phosphateLimestone powderLysine 80.180.190.316.50.60.470.220.19Ingredients without changes in the four treatments are not listed
European Food Research and Technology (2021) 247:1771–1780thickness; Restek, Bellefonte, PA, USA) was installed in theGC oven. The GC oven was programmed as follows: after1 min at 60 C, the temperature was increased at 6 C/minto 150 C, then at 4 C/min to 190 C and finally at 7 C/min to 250 C (hold time 7 min). In selected ion monitoring(SIM) mode, m/z 74, m/z 79, m/z 81, m/z 87, m/z 88, m/z 101[10, 11] were recorded from 8 min (end of solvent delay) tothe end of the run (41.65 min). Ion abundance ratios andretention times were used for peak assignment. Final peakverification was performed by GC/MS operated in full scanmode (m/z 50–500). Injector and detector temperatures wereset at 250 and 280 C, respectively.Dicarboxylic fatty acid dimethyl esters (DiFA-diMEs)in fish samples were analysed with a 5890 GCDPlus/5971GC/MS system equipped with a 7673 autoinjector (Hewlett-Packard/Agilent, Waldbronn, Germany). A DB5-MS UIcolumn (30 m length, 0.25 mm i.d., 0.25 µm film thickness;Agilent, Waldbronn, Germany) was used in combinationwith the carrier gas helium (see above) and the followingtemperature program: After 1 min at 55 C, T was raised at10 C/min to 300 C (hold time 4 min). In full scan mode,m/z 50–500 was recorded throughout the run after a solventdelay of 7 min. GC/MS-SIM measurements were based onten m/z values, i.e. m/z 74 and m/z 87 for saturated FAME ingeneral, m/z 88 and m/z 101 for the internal standard FAEE[6] along with the [M–OMe] ([M-31] ) ions of DiFAdiMEs, namely m/z 171 (Di8:0-diME), m/z 185 (Di9:0diME), m/z 199 (Di10:0-diME), m/z 213 (Di11:0-diME),m/z 227 (Di12:0-diME) and m/z 241 (Di13:0-diME). DiFAdiMEs were quantified by means of m/z 74.Countercurrent chromatography (CCC) fractionsobtained from the injection of Di9:0-diME (see next section) were analysed on a 5890 GC/FID system (HewlettPackard/Agilent, Waldbronn, Germany) equipped with aDB5-MS UI column (30 m length 0.25 mm i.d. 0.25 µmfilm thickness; Agilent, Waldbronn, Germany). Peak areas,normalised by the internal standard, were used for creatingthe elution profiles. A DB5-MS UI column with the sameparameters and GC oven program as shown above was usedfor the measurements.Countercurrent chromatographic (CCC) fractionationof technical azelaic acid standard (purity 80%)Three solvent systems, i.e. acetonitrile/water 1:1 (v/v),n-hexane/benzotrifluoride (THF)/acetonitrile 20:7:13 (v/v/v)[12] and n-hexane/methanol/water 700:350:4 (v/v/v) [13]were initially selected for shake flask experiments according to Ito [14]. For this purpose, the technical azelaic acidstandard (80% purity) was twofold methylated to give Di9:0diME. An aliquot of technical Di9:0-diME (0.15 mg) wasadded to 1 mL of each separated phase of the solvent system and thoroughly shaken. After phase separation, aliquots1773of both fractions were taken and analysed by GC/FID andthe partition constant (KU/L value) was calculated from thepeak ratio. The technical Di9:0-diME standard featured fouradditional DiFA-diMEs those KU/L values were determinedas well.CCC separations were performed with an AECS Quikprep MK8 CCC instrument (AECS, Downend, UK)equipped with two coils each in two bobbins of 120 mLeach [15]. Coils 2 and 3 were selected (total volume 236 mL)[16] for separations in head-to-tail mode (lower phase servedas mobile phase) using the instrument s maximum rotationalspeed of 870 rpm. The solvent system n-hexane/methanol/water 700:350:4 (v/v/v) according to Kapp and Vetter [13]was selected for CCC separations. After equilibration of thesystem (17 mL displacement of stationary phase), 120 mgtechnical Di9:0-diME, dissolved in a mixture of 2 mL ofboth phases, was injected and the flow rate was set to 2 mL/min. Fractionation of 41 subsequent CCC fractions of 6 mLeach was started after 50 mL. The individual fractions wereconcentrated to 2 mL using a heating block maintained at40 C and a gentle stream of nitrogen and filled up to a volume of 5 mL in a volumetric flask. To remove traces of waterused in the solvent system an aliquot of 1 mL was filtratedthrough sodium sulphate. These fractions were analysed byGC/MS for peak identification followed by GC/FID analysisusing with the same conditions for generation of the elutionprofiles purity controls and quantitation.Results and discussionsFatty acid profile in fillet and head tissueLipid content in fillet (mean value of all treatments) was 7%in dry matter. Fifty-two fatty acids were detected and mostlyverified in the samples (Table S1). Discussion will be basedon the most relevant fatty acids while low abundant FA( 1% contribution to the fatty acid pattern) was summarisedas minor FAs (Table 2). The fatty acid pattern of fillet fromall treatments was dominated by 25–29% oleic acid (18:1n9) and 22.5–25.5% palmitic acid (16:0) (Table 2). Theseand further saturated and monoenoic fatty acids resulted ina shared contribution of on average 73% to the total fattyacids (Fig. 1a). The remaining share of 26% originated fromdienoic fatty acids ( 13%, Fig. 1a) with main contributionsof linoleic acid (18:2n-6; 12%) and PUFAs with more thantwo double bonds ( 14%), including 3.5% docosahexaenoicacid (DHA, 22:6n-3) (Fig. 1a; Table 2). Phytanic acid contributed with 0.1% to the total fat [11] (Table 2). Consideringthe food compositions of the individual treatments (Table 1),the most striking differences in fatty acid profiles were anincrease in the contributions of dienoic FAs (12.9–13.6%vs. 12.5% without flaxseed powder) and PUFAs with more13
1774Table 2 Fatty acid profile [%]of the most abundant fattyacids in fillet (left columns)and head tissue (right columns)of Nile tilapia (Oreochromisniloticus) raised with four feedcompositions (FC1–FC4, seeTable 1)European Food Research and Technology (2021) 247:1771–1780FilletLipid in DM [%]14:0Di8:016:0Phytanic -322:6n-3Minor FAs aSaturated FAsMonoenoic FAsDienoic FAsPolyenoic l contributions 1% to total fatty acids, i.e. saturated FAs (12:0, 13:0, 19:0, 20:0, 22:0 and 24:0),methyl branched FAs (i15:0, a15:0, i16:0, i17:0, a17:0, i18:0), monoenoic and dienoic FAs (14:1, 16:1,17:1, 22:1, 16:2, two 20:2 isomers and six unknown PUFAsthan two double bonds (12.5–18.9 vs. 10.7% without flaxseed powder, Table 2) with increasing shares of flax seedpowder in the feed (Fig. S1). Specifically, both the share ofα-linolenic acid (18:3n-3; ALA), i.e. the major constituentin flaxseed oil (40–60% of total fat) as well as docosahexaenoic acid (22:6n-3; DHA) increased from 2.3% (FC1, 0%flaxseed powder) to 8.0% (FC4, 10% flaxseed powder) and2.8% (FC1) to 4.9% (FC4), respectively. This trend was inagreement with the findings of Visentainer et al. [17]. Incontrast, the share of saturated fatty acids decreased slightlywhen more flax seed powder was applied with the feed(Table 2). Notably, the fillet samples also featured between0.4 and 0.5% erucic acid (22:1n-9, Table 2). Erucic acidis considered toxic to humans and a maximum tolerabledaily intake of 7 mg/kg body weight was recently proposedby the European Union [18]. Since fish is a known dietarysource of erucic acid [19, 20], the daily intake was calculated for body weights of 40 kg (children, 10 years old)13and 75 kg (adults), respectively, i.e. 280 and 525 mg erucicacid per day [20]. Based on a portion size of 200 g fillet,erucic acid concentrations were transferred on a wet weightbasis (Table S2). Based on the values, the mean intake viaconsumption of tilapia was 10–54 mg erucic acid. Accordingly, even the highest amount in an individual fish samplewas 230 mg erucic acid which is below the proposed TDIof erucic acid [18, 20].When compared with fillet, head tissue (mean value of alltreatments) showed a much higher lipid content (42% fat ofthe dry matter) and also a different fatty acid profile. Oleicacid (35%), palmitic acid (32%) and the share of saturatedand monoenoic fatty acids ( 83%) was more prominent thanin fillet (Table 2). Also, erucic acid (22:1n-9) was higherconcentrated in head tissue, with mean concentrations inthe four treatments of 100–210 mg/200 g fresh weight(Table S2) which is close to the proposed TDI of erucic acidfor young people and 50% of the proposed TDI of adults
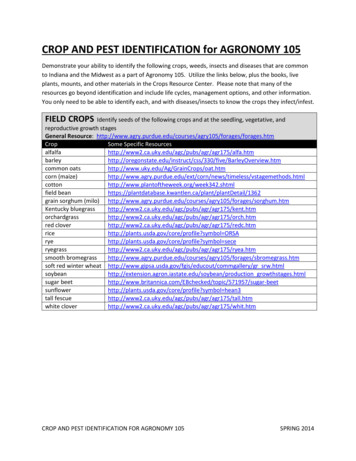
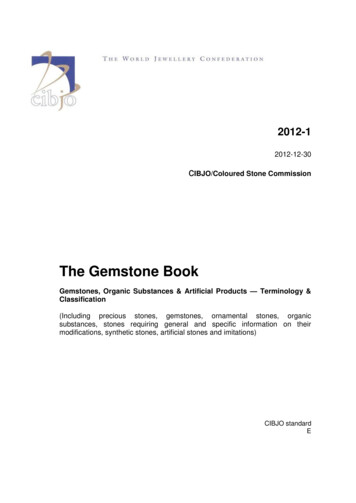
European Food Research and Technology (2021) 7:017:12526t 27[min]18:216:114:018:0ISTD II18:324.022.0Irel26.028.0Di9:0IrelISTD I30.032.0 t [min]b16:018:1Di8:01518:01716t [min]ISTD II14:016:1ISTD IFig. 1 Mean profile of fatty acid groups [%] in a fillet and b head tissue of Nile tilapia (Oreochromis niloticus) raised with four food compositions[18, 20]. In addition, 5% linoleic acid and only 2% PUFAswith more than two double bonds (DHA 1%) were presentwhile phytanic acid was not detected at all (Fig. 1b; Table 2).Most remarkably, the samples contained additional peaksthat were not detected in fillet samples (see next section).Identification of dicarboxylic acids in head tissueof tilapiaGC/MS chromatograms of the FAME solution obtained fromhead tissue extracts featured one additional peak between theretention time of 16:0-ME and 18:1n-9-ME (Fig. 2a). Thefull scan GC/MS spectrum indicated the presence of the(di-) methyl ester of azelaic acid (Di9:0-diME) due to itsgood match with the compound in the instrument s NISTlibrary of mass spectra. Characteristic GC/MS fragment ionsof Di9:0-diME were m/z 185 ([M-31] ), m/z 152 ([M-64] ,[M–2CH3OH] ), m/z 111 ([M-105] ), along with diagnostic fragment ions of saturated fatty acids, i.e. m/z 74 (basepeak) and m/z 87, as well as m/z 83 (Fig. 3) [10]. Presence ofDi9:0 (as dimethyl ester) in the head tissue samples could beverified by means of a commercial technical reference standard of Di9:0 (80% purity). Specifically, Di9:0-diME elutedbetween 17:0-ME and 17:1-ME from the polar Rtx-2330GC column (Fig. 2a). Actually, it showed the same retention16.018.020.022.024.026.0t [min]Fig. 2 GC/MS full scan chromatograms of the fatty acid methylesters prepared from the lipids of Nile tilapia head tissue extractmeasured on a a polar GC column (Rtx-2330) and b a nonpolar GCcolumn (DB-5)time as a standard of phytanic acid methyl ester (which wasnot present in the head tissue sample, see above). The longretention time was surprising because M of Di9:0-diME(m/z 216) is much lower than M of 17:0-ME (m/z 284) andphytanic acid-ME (m/z 326). Yet, switching to a nonpolarIrel74[M-64] 83152[M-105] 11187976090[M-73] [M-92] 143124120150[M-31] 185180210 [m/z]Fig. 3 GC/MS spectrum (full scan mode) of azelaic acid dimethylester (Di9:0-diME) in a Nile tilapia head tissue sample13
1776European Food Research and Technology (2021) 247:1771–1780DB-5 phase enabled a full GC separation of Di9:0-diMEfrom all conventional FAMEs in the fish samples, whichis in agreement with its lower molecular weight (Fig. 2b).Using this protocol, Di9:0-ME eluted much earlier, i.e. inthe tR range of 12:0-ME (M , m/z 214). Moreover, the earlyand noninterfered elution of DiFA-DiMEs on the nonpolar column allowed the additional detection of Di8:0-diMEat lower abundance (Fig. 2b, insert). Subsequently, a GC/MS-SIM run was programmed based on the characteristicions of DiFA-DiMEs (by shifting diagnostic fragment ionsof Di9:0-ME by Δ14 u in both directions, Table 3). Thistargeted GC/MS-SIM method enabled the detection of theDiFAs Di7:0-diME, Di8:0-diME, Di9:0-diME, Di10:0diME, Di11:0-diME, Di12:0-diME and Di13:0-diME inthe samples. Owing to the insufficient purity of the technical Di9:0 standard ( 80%, see “Materials and methods”)which contained lower shares of Di7:0-diME, Di8:0-diMEand Di10:0-diME to Di12:0-diME), an exact quantificationwas not possible at this point. Accordingly, the commercialDi9:0 standard was purified by means of countercurrentchromatography (CCC).Table 3 GC/MS data of thesaturated dicarboxylic fattyacid dimethyl esters Di7:0diME–Di13:0-diME withthe molecular- ion (usuallyundetected) along with thediagnostic fragment ions[M] [M-31] [M–CH3O] (identifica-tionion)[M-64] [M-73] [M–2CH3OH] [M–CH3OCO–CH2] [M-92] /[M-91] [M–2CH3OH–CO] /[M–CH3OH–CH3OCO] [M-105] 39153b157171185199213227241115129143157171185Not detectedVery low abundantTable 4 KU/L values of the dimethylated dicarboxylic acids (DiFAdiMEs) in the technical standard of azelaic acid dimethyl ester (purity80%) in three solvent systems (columns 2–4) and the correspondingShake flask experiments13An aliquot of the technical Di9:0 standard (purity 80%,along with homologues Di7:0, Di8:0, Di10:0, Di11:0,Di12:0) was methylated to give DiFA-diMEs which weresubjected to shake flask experiments [14]. Three biphasicsolvent systems were tested (see Materials and Methods).While KU/L values in acetonitrile/n-hexane and the BTF system were low and unsuited, the solvent system n-hexane/methanol/water 700:350:4 (v/v/v) [13] provided KU/L valuesof Di9:0-diME and three of the four homologues in the socalled sweet spot range of KU/L 0.4 2.5 [21] (Table 4).Moreover, the predicted elution profile (freeware: ProMISE—probabilistic model for immiscible phase separationsand extractions [22]) indicated a sufficient separation ofDi9:0-diME in head-to-tail mode using a flow rate of 2 mL/min (lower phase used as mobile phase).Accordingly, 120 mg of the impure technical Di9:0-diMEstandard was injected into the calibrated CCC system andfractionated as shown in the section Materials and diMEDi11:0-diMEDi12:0-diMEPurification of dicarboxylic fatty acids (DiFAs)by countercurrent chromatographyelution profile and isolation characteristics after separation with thesolvent system n-hexane/methanol/water 700:350:4 (v/v/v)CCC fractionation characteristics with n-hexane/methanol/water700:350:4 ile100:35:65n-hexane/metha- Elution time [min]nol/water700:350:4Elution volume [mL]Quantity [mg]Purity 9843–4649–5558–6479–8297–106121–130
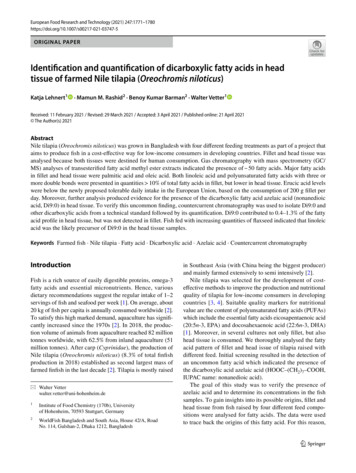
European Food Research and Technology (2021) 247:1771–17801777[%]aDi9:01.51.00.50.0Fig. 4 CCC elution profile of six dicarboxylic acids in the technicaldimethylated standard of azelaic acid (Di9:0-diME) of 80% purity.The elution profile was generated from normalised peak areas asdetermined by GC/FID. The flow rate was 2 mL/min and fractionswere taken every sixth minute after an offset of 25 minElution profiles were generated by means of normalisedpeak areas in the resulting GC/FID chromatograms of theindividual CCC fractions (Fig. 4). Next to the five DiFAdiMEs initially detected (Table 4), several CCC fractionsalso featured Di7:0-diME (see also above). Moreover, allsix DiFA-FAMEs were present in selected CCC fractionswith purities of 96–100%, respectively (Table 4). Hence,CCC fractionation not only allowed to detect Di7:0-diME,but also to isolate it in sufficient amounts and with highpurity (Table 4). Aliquots of the isolated individual DiFAdiMEs were mixed to give a quantitative mixture which waschecked by GC/FID for equal response. The resulting solution was used as external standard for quantitative analysisof DiFA-diMEs by GC/MS-SIM.Concentrations of dicarboxylated fatty acids(DiFA‑diMEs) in tilapia head tissueQuantitative GC/MS-SIM analysis on the nonpolar GCcolumn resulted in mean contributions of 0.4–1.4% Di9:0to the total fatty acids in head tissue (Fig. 5a). The secondmost abundant DiFA in the head tissue samples, Di8:0,contributed on average with 0.1–0.3% to the total fattyacids (Fig. 5b). Interestingly, the share of the most relevantDiFAs (Di7:0-Di11:0) steadily increased from FC1 to FC4(Table S3, Fig. S2).DiFAs are known degradation products of unsaturatedfatty acids formed by oxidative cleavage. Assumedly, theformation of DiFAs starts with peroxidation (Fig. 6) [23].Subsequent α-cleavage leads to an n-oxo-FA which then isoxidised to give a DiFA (Fig. 6). Three peroxidation processes could be involved, i.e. (1) autoxidation [23], (2) photooxidation with singlet oxygen and (3) enzymatic oxidation.In the case of monoenoic fatty acids, Di9:0 was found tobe formed from 18:1n-9 (oleic acid) and 16:1n-7 (palmitoleic acid) [23–25]. However, the amounts of 18:1n-9 would[%]bDi8:00.20.10.0Fig. 5 Concentrations of a Di9:0 and b Di8:0 in Nile tilapia headtissue (in % of total fatty acids) in dependence of the different treatments (feed compositions) with different shares of flaxseed powderand sweet potato (FC1: 0%, FC2: 5%, FC3: 7.5% and FC4: 10%,respectively)barely be changed by losses corresponding to the amount ofDi9:0 in the head samples. Autoxidation of monoenoic acidsshould lead to similar amounts of Di8:0 and Di9:0, photooxidation would generate similar amounts of Di9:0 and Di10:0,while enzymatic oxidation requires at least two double bondsin a FA (which is not the case in 18:1n-9). Similarly, 16:1n-7should also generate similar amounts as much lower concentrated than 18:1n-9 and very similar abundant in treatmentFC2–FC4, Fig. S2). Hence, no direct dependency betweenthe monoenoic fatty acids and the DiFAs could be established in the present samples.However, PUFAs showing the first double bond on C-9position like linoleic acid (18:2n-6) and α-linolenic acid(18:3n-3) can also be precursors of azelaic acid [26, 27].All three peroxidation processes will favor the formation ofthe saturated DiFA Di9:0 from both PUFAs. In agreementwith that the highest amounts of Di9:0 were determined inthe treatments with the highest shares of flax seed powderin the feed (FC3 and FC4, Fig. 5a). Moreover, the amountof flaxseed powder (and thereby the PUFAs) correlatedwith the amount of Di9:0 determined in head tissue (Fig.13
1778European Food Research and Technology (2021) 247:1771–1780immune-related genes [36] and described in Arabidopsis[37]. Furthermore, DiFAs are used as an agent for the therapy of acne in cosmetics [38].ConclusionsIn contrast to the corresponding fillet samples, DiFAs werepresent in all heads tissue samples of tilapia. Although theirformation could not be fully clarified, lipid oxidation ofPUFAs were found to be the most relevant precursors, withpossible impact of microorganisms. Although oral administration indicated that acelaic acid is a nontoxic substance,which is excreted via urine [36], more data on the occurrence of dicarboxylic acids (DiFAs) in head or rather braintissue in fish would be important. The methods shown inthis article, including the isolation of reference standards byCCC, application of a targeted GC/MS-SIM method and thelast but not least, the use of a nonpolar GC stationary phasewill be beneficial to reach this goal.Fig. 6 Proposed mechanism of the formation of Di9:0 initiated bylipid oxidation of a fatty acid showing the first double bond in C-9position. Several other products are formed, but only the decisive wayis shown. a Radical formation on C-11 is followed by b attack of oxygen on C-9 leading to the hydroperoxide. Finally, c α-cleavage on theleft hand side (leads to the aldehyde on C-9 which is d oxidised) togive Di9:0S1, S2). Unfortunately, feed samples were not available foranalysis. However, Di9:0 was not detected in tilapia fillet,which pointed rather to the formation of Di9:0 in head tissuealthough a selective transfer and enrichment in this tissuecould not be fully ruled out.Previous reports on azelaic acid (Di9:0) and other DiFAsin fish are scarce. This could be due to the fact that headtissue is not commonly analysed and that DiFAs were notdetected in fillet. Yet, DiFAs were previously detected inskin mucus of fish [28]. It was noted that it is producednaturally by Pityrosporum ovale, a yeast that lives on skin[29, 30]. Also, Candida tropicalis, a ubiquitous yeast, is aknown producer of azelaic acid [31]. This pointed towardsthe involvement of microorganisms in the formation ofDiFAs, which are likely more present in head tissue thanin fillet. In addition, Di9:0 was shown to occur naturally inwhole grain cereals such as barley [32] and sorghum [33,34] as well as in red and green seaweed [35]. Also in theseexamples in the literature, involvement of microorganismsin the formation of DiFAs cannot be ruled out. Di9:0 wasshown to be involved in the immune-signal pathway, calledsystemic acquired resistance (SAR) triggering the AZI1enzyme to prime plants for salicylic acid accumulation and13Supplementary Information The online version contains supplementary material available at https://d oi.o rg/1 0.1 007/s 00217-0 21-0 3747-5.Acknowledgements This pro
an uncommon fatty acid which indicated the presence of the dicarboxylic acid azelaic acid (HOOC–(CH 2) 7 . increasing amounts of ax seed powder and orange sweet potato (Table 1). Fish were raised in cages for ve months to . retention times were used for peak assignment. Final peak ve