Transcription
UnderstandingScoresUPDATED WITH SCORE CONVERSIONS2018
Contact UsAbout the College BoardThe College Board is a mission-driven not-for-profit organizationthat connects students to college success and opportunity.Founded in 1900, the College Board was created to expandaccess to higher education. Today, the College Board’smembership is made up of over 6,000 of the world’s leadingeducational institutions and is dedicated to promoting excellenceand equity in education. Each year, the College Board helpsmore than seven million students prepare for a successfultransition to college through programs and services in collegereadiness and college success—including the SAT and theAdvanced Placement Program . The organization also serves theeducation community through research and advocacy on behalfof students, educators, and schools. For further information, visitcollegeboard.org.About the PSAT/NMSQTThe Preliminary SAT/National Merit Scholarship Qualifying Test(PSAT/NMSQT ) is cosponsored by the College Board and NationalMerit Scholarship Corporation (NMSC). It is administered for theCollege Board and NMSC by Educational Testing Service (ETS).About the National MeritScholarship ProgramThe PSAT/NMSQT is the route of entry to the National Merit Scholarship Program, an academic competition conductedby National Merit Scholarship Corporation (NMSC). Requirementsfor participation, steps in the competition, and awardsoffered are explained in the PSAT/NMSQT Student Guide andon NMSC’s website.Further information is provided in the Guide to the National MeritScholarship Program. Questions about the scholarship program notanswered in the published materials should be directed to NMSC:National Merit Scholarship Corporation1560 Sherman Avenue, Suite 200Evanston, IL S FORSTUDENTS AND PARENTSpsathelp@info.collegboard.org866-433-7728 1-212-713-8105 (International)8 a.m. to 7 p.m. ET, Mon.–Fri.GENERAL CONTACTSPSAT/NMSQTP.O. Box 6720Princeton, NJ 08541-6720CONTACTS FOR SAT (7728) 1-212-237-1335 (International)8 a.m.–8 p.m. ET, Mon.–Fri.
The PSAT/NMSQTand the SAT Suiteof AssessmentsThe SAT Suite of AssessmentsThe SAT Suite of Assessments is an integrated system oftests that includes the SAT (for students in grades 11 and 12),the PSAT/NMSQT and the PSAT 10 (for grades 10 and 11),and the PSAT 8/9 (for grades 8 and 9).The tests measure the same skills and knowledge in gradeappropriate ways. They work together to show collegereadiness over time so educators, students, and parents canmonitor student progress. Their content reflects the kind ofmeaningful, engaging, and challenging work that studentsfind in the best middle school and high school coursestaught today.What the PSAT/NMSQT MeasuresThe PSAT/NMSQT measures the skills and knowledge thatresearch shows are the most important for success in collegeand career. The Reading Test measures comprehension andreasoning skills and focuses on close reading of passagesin a wide array of subject areas. The Writing and LanguageTest measures a range of skills, including command ofevidence, expression of ideas, and the use of standardEnglish conventions in grammar and punctuation. The MathTest covers a range of math practices, with an emphasis onproblem solving, modeling, using tools strategically, and usingalgebraic structure.How the PSAT/NMSQT Is ScoredStudents receive a total score that is the sum of their scoreson the two sections (Evidence-Based Reading and Writingand Math).To calculate section scores, we first compute the student’sraw score—the number of questions correctly answered—foreach section. Nothing is deducted for incorrect answers or forunanswered questions.Next, we convert each of the raw section scores to a scaledscore of 160 to 760. This conversion process adjusts forslight differences in difficulty among versions of the test andprovides a score that is consistent across different versions.The scaled scores are the scores provided on score reports.How You Can Use theStudent Score ReportThe student score report clearly summarizes a student’scurrent achievement levels and encourages next steps toincrease college and career readiness. You can help studentsby going over their score reports and helping them understandwhat their scores mean. Here’s how.TALK WITH STUDENTS ABOUT COLLEGE READINESSFor each section, the score report includes an indicatorthat shows whether the student’s score meets the gradelevel benchmark. These benchmarks allow students andeducators to understand how students are progressing towardcollege readiness.§ If a student is meeting the benchmark for a section,remind them to continue to take rigorous courses andwork hard to stay on track for college success.§ If a student is not meeting the benchmark for a section,connect them to classroom work that is focused onareas that need improvement. Khan Academy can helpsupplement this work.1
USE STUDENT SCORES TO IDENTIFY STRENGTHSAND WEAKNESSES§ Use test scores, as well as the cross-test scores andsubscores online, to evaluate a student’s relativestrengths and weaknesses and to determine which skillsneed practice.§ Use the red/yellow/green coding on section scores toevaluate how your student is performing relative to otherstudents who are meeting or exceeding the benchmark.w Highlight the areas in green as the student’sstrengths.w Prioritize areas in the red range for additional workand practice.HELP STUDENTS DECIDE ON NEXT STEPS§ Work with your students to think of ways to developeach of the skills you have identified for focus andimprovement.§ Encourage students to go online for more details and tolink their College Board account to Khan Academy for afree, personalized study plan.For further guidance on interpreting score reports, see theProfessional Development modules for K–12 educators atsat.org/educators.Score-Reporting FeaturesOn pages 14–15 of this booklet, you’ll find an annotatedsample score report that includes detailed explanations of theinformation that students receive about their college readinessskills. Students can access their online reports to obtain moreinformation and guidance, including free, personalized KhanAcademy instruction and practice based on their results.NOTE: Score reports for schools testing on Saturday,October 13, or participating in the test administration study orresearch group won’t include question-level details.The online reporting portal at k12reports.collegeboard.orgoffers you an array of powerful tools to assess your students’progress and plan instruction that delivers what they need. Thetools include:§ Flexible reports that can be sorted and filtered by keydemographics.§ Instructional planning support using test subscoresin specific content areas, benchmarks, informationfor cross-subject tasks, and data for prescribinginterventions when students are behind or ahead.§ Question Analysis Report that helps educators connectsubscores to state standards, analyze students’strengths and weaknesses, learn which mistakeswere the most common, and look for opportunitiesto reinforce skills. (The Question Analysis Reportwon’t be available to schools participating in the testadministration study or research group or to schoolstesting on Saturday, October 13.)§ Access to the AP Potential tool to pinpoint studentswho are likely to succeed in more challenging courses.2
PSAT/NMSQTScoresTotal ScoresSubscoresONLINE AND PAPER SCORE REPORTSONLINE SCORE REPORT ONLYThe total score is the sum of the two section scores; its rangeis 320–1520.Section ScoresONLINE AND PAPER SCORE REPORTSYour students receive scores in the range of 160–760 foreach of two sections. The Evidence-Based Reading andWriting section score combines the scores for the ReadingTest and the Writing and Language Test. The Math sectionscore is derived from the Math Test score, including thecalculator and no-calculator portions.Test ScoresONLINE AND PAPER SCORE REPORTSThe range for the following test scores is 8–38:§ Reading§ Writing and Language§ MathCross-Test ScoresONLINE SCORE REPORT ONLYThe range for cross-test scores is also 8–38. These scoresrepresent student performance on select questions acrossthe three tests and show a student’s strengths in thefollowing domains:Subscores in the range of 1–15 offer feedback on studentperformance in the following skill areas:§ Command of Evidence§ Words in Context§ Expression of Ideas§ Standard English Conventions§ Heart of Algebra§ Problem Solving and Data Analysis§ Passport to Advanced MathScore RangesONLINE SCORE REPORT ONLYA student’s ability is better represented by score ranges thanpoints. Score ranges are derived from the standard error ofmeasurement and show how much a student’s scores wouldlikely vary if they took a different administration of the testunder identical conditions.From recent administrations of the PSAT/NMSQT, theseranges are approximately:§ Total: 40 points§ Section: 30 points§ Test scores, subscores, and cross-test scores: 2 points§ Analysis in History/Social StudiesSelection Index§ Analysis in ScienceONLINE AND PAPER SCORE REPORTSReported on a scale ranging from 48 to 228, the SelectionIndex score is calculated by doubling the sum of the Reading,Writing and Language, and Math Test scores. See page 10 formore information.3
Score Scalesand Score ChangesUsing PSAT/NMSQT Scoresto Project SAT ScoresThe SAT Suite—from the PSAT 8/9 through the SAT—uses acommon score scale for the total, section, test, and crosstest scores. The ranges reported for each assessment reflectgrade-level appropriateness within the common scale. Thus,while the total range for the SAT is 400–1600, the total rangefor the PSAT/NMSQT is 320–1520.This common score scale means that a student who took thePSAT/NMSQT and received a Math section score of 500 wouldbe expected to also get a 500 on the SAT or the PSAT 8/9 ifthey had taken either of those tests on that same day; a scoreof 500 represents the same level of academic achievementon all three assessments.This also means that student growth across the SAT Suite iseasy to determine. If a student takes the PSAT/NMSQT thisyear and receives a 500 Math section score, and then takesthe SAT next year and earns a 550 Math section score, thatstudent has shown a growth of 50 points, which likely resultedfrom hard work both in and out of school.The total, section, test, and cross-test scores have beenvertically scaled to allow the accurate measurement ofgrowth from test to test. Encourage students to focus on thesection scores if they are curious about the growth they canexpect to see in their scores over the next year. They shouldlook at the set of projected score ranges we have provided(only in online score reports) for students that reflect typicalgrowth. Of course, a student’s individual growth will beshaped by the courses taken and by the practice the studentundertakes between assessments.4Subscores (available online only) aren’t on a vertical scale,and therefore comparing performance year after year shouldbe based on relative performance rather than by calculatingstudent growth across tests.Students who wish to improve their performance on the SATshould follow these guidelines:§ Develop academic skills through challengingcoursework.§ Read extensively and develop strong writing skills.§ Engage in deliberate practice in the three math areasthat are emphasized the most in the assessments.§ Take practice tests and upload their results toKhan Academy for free, personalized practice of theskills they need to improve. To learn more, go topsat.org/practice.
Benchmarks andRed/Yellow/Green PerformanceThe PSAT/NMSQTGrade-Level BenchmarksThe SAT Suite offers grade-level benchmarks that canbe used to gauge whether students are on track forbecoming college ready each year in grades 8–12. Gradelevel benchmarks represent the section scores on eachassessment that students should meet or exceed to beconsidered on track to be college ready.The PSAT/NMSQT reports separate benchmarks for 10th and11th graders to help them understand their level of readinessfor college and career training programs. The benchmarkshelp educators better understand how many students andalso which students are on track to have the skills necessaryfor college-entry, credit-bearing courses. Equipped with thisinformation, educators can support students who need extrahelp while there is still time for improvement. Teachers canalso accelerate the progress of students who meet or exceedthe benchmarks.RECOMMENDED USESGrade-level benchmarks can help educators:§ Identify students who are on track for success incollege and career readiness.§ Identify students who may need extra supportwhile there is still time for improvement.§ Find students who may be ready for morechallenging coursework.Grade-level benchmarks shouldn’t be used to assignacademic tracks, to discourage students from pursuingcollege, or to keep students from participating in challengingcourses. Rather, the benchmarks are intended to help allstudents better prepare for life after high school.What the Benchmarks MeanThe College and Career Readiness Benchmarks for thecurrent SAT predict a 75% likelihood of achieving a C orhigher in related first-semester, credit-bearing collegecourses. The benchmarks are set at the section level, so thereis a benchmark for Evidence-Based Reading and Writing anda benchmark for Math.Score reports for the PSAT/NMSQT, PSAT 10, and PSAT 8/9include grade-level benchmarks based on how students growfrom year to year toward the SAT benchmarks.PSAT/NMSQT Grade-Level BenchmarksEvidence-BasedReading and WritingMath10th GradePSAT/NMSQT43048011th GradePSAT/NMSQT460510Additional Information Providedto Help You Understand ProgressToward College ReadinessThe student score report provides further context forunderstanding scores by showing a color-coded bar chartfor the section scores. Students who met or exceeded thebenchmark will be in the green portion of the score band.If students didn’t meet the benchmark but were close(within one year’s growth), their scores will be in the yellowportion. Students who have a score indicating more than ayear’s growth below the grade-level benchmark will have ascore in the red portion of the score band. Additionally, foreach of the test scores and subscores, we have provided acolor-coded guide to a student’s relative strengths (green)and weaknesses (red).5
PercentilesA student’s percentile rank represents the percentage ofstudents who score equal to or lower than their score. Forexample, if a student’s score is in the 75th percentile, 75%of a comparison group achieved scores at or below thatstudent’s score. Two types of percentile ranks, comparingstudent scores to two different reference populations, areprovided in this publication for both total and section scores.Nationally representative percentiles are derived from aresearch study of U.S. students in the 10th or 11th grade andare weighted to represent all U.S. students in those grades,regardless of whether they typically take the PSAT/NMSQTor the PSAT 10.User group percentiles are based on the actual scores ofstudents who took the PSAT/NMSQT and the PSAT 10 in thepast three school years.Percentiles for Total Scores10TH GRADEPERCENTILESPERCENTILESTotal ScoreNationallyRepresentativeSamplePSAT/NMSQTand PSAT 10UserNationallyRepresentativeSamplePSAT/NMSQTand PSAT 10User152099 99 99 99 1510150014901480147014601450144099 99 99 99 99 99 99 111099 99 9999138099 99 991410140099 99 99 139099 99 99 143014201360611TH 19089888786848399 99 99 99 99 9999 99 99 99 9999 8988878685848399 99 908988878685848382817978777574727069
Percentiles for Total Scores (continued)10TH GRADEPERCENTILES11TH GRADEPERCENTILESTotal ScoreNationallyRepresentativeSamplePSAT/NMSQTand PSAT 10UserNationallyRepresentativeSamplePSAT/NMSQTand PSAT 414129610TH ERCENTILES11TH GRADEPERCENTILESTotal ScoreNationallyRepresentativeSamplePSAT/NMSQTand PSAT 10UserNationallyRepresentativeSamplePSAT/NMSQTand PSAT 9101445StandardDeviation17018016819737
Percentiles for Section Scores10TH GRADEEvidence-BasedReading and WritingMathEvidence-BasedReading and TILESSection ScoreNationallyRepresentativeSamplePSAT/NMSQTand PSAT 10UserNationallyRepresentativeSamplePSAT/NMSQTand PSAT 10UserNationallyRepresentativeSamplePSAT/NMSQTand PSAT 10UserNationallyRepresentativeSamplePSAT/NMSQTand PSAT 10User76099 99 99 99 99 99 99 99 75099 99 99 99 99 99 99 9974099 99 99 9999 9999 9873099 99 999999 99999772099 99 999999 9899967109999999999 9798967009999999899 464839313733460811TH GRADE4949495242334036
Percentiles for Section Scores (continued)10TH GRADESection Score44043042041040039038011TH GRADEEvidence-BasedReading and WritingMathEvidence-BasedReading and SAT/NMSQTand PSAT 40363126231915PSAT/NMSQTand PSAT 35312826232016PSAT/NMSQTand PSAT SQTand PSAT 39
NMSCSelection IndexThe National Merit Scholarship Program is an annualacademic competition among high school students forrecognition and college scholarships. The program isconducted by National Merit Scholarship Corporation(NMSC), a not-for-profit organization that operates withoutgovernment assistance.The NMSC Selection IndexReported on a scale ranging from 48 to 228, the SelectionIndex score is calculated by doubling the sum of the Reading,Writing and Language, and Math Test scores. For example, aReading score of 23, a Writing and Language score of 20, anda Math score of 26.5 would result in a Selection Index score of139 [2(23 20 26.5)].How NMSC Uses the Selection IndexNMSC uses the Selection Index score to designate groupsof students to receive recognition in the National MeritScholarship Program. Entry to NMSC’s competition forscholarships to be offered in 2020 is determined by students’responses to program entry questions on the 2018PSAT/NMSQT answer sheet. Both the printed PSAT/NMSQTstudent score report and the online report show the student’sSelection Index, the student’s responses to entry items,and whether the student meets participation requirements.Currently, about 1.6 million test takers meet requirements toenter NMSC’s competition each year. Almost all entrants arein their third year (grade 11, junior year) of high school.Of the 1.6 million NMSC program entrants, about 50,000will earn 2018 PSAT/NMSQT scores high enough to qualifythem for recognition. These students will be notified of theirstanding through their high schools in September 2019.Students who qualify to continue in the competition forscholarships to be offered in 2020 must then meet academicand other requirements specified by NMSC to be consideredfor awards.10A detailed description of the National Merit ScholarshipProgram is published in the Guide to the National MeritScholarship Program, mailed to high school principalseach fall. For students and parents, information about thecompetition is given in the PSAT/NMSQT Student Guideand at www.nationalmerit.org.For inquiries about any aspect of the National MeritProgram—including entry requirements, the selectionprocess, and awards to be offered—contact NMSC directly:www.nationalmerit.org847-866-5100National Merit Scholarship Corporation1560 Sherman Avenue, Suite 200Evanston, IL 60201-4897
Answer KeyWednesday, Oct. 10, Test FormReadingTestSECTION 11AWriting andLanguage TestSECTION CTION 2347SECTION 1CB6SECTION 334DWriting andLanguage Test125ReadingTestDDBMath Test –No Calculator123Wednesday, Oct. 24, Test BCCBNOTE: For schools participating in the testadministration study or research groupin fall 2018, correct answers will not beprovided. Correct answers will also not beprovided for the Saturday, Oct. 13, test form.BD14413/5, 2.610/3, 15/4,25/6, 3.33, 3.75,4.16, 4.17Math Test –CalculatorC333998, 9B38814B2837A712D36C96A26348B512C32D7SECTION 94B1C16172D11BCBBCCDA24A282930111314BADC5151/3, .333175/2, 2.51616Math Test –CalculatorSECTION TE: For more detailed information aboutscores, visit psat.org/resources.BAABCBD24A2325BC26D2824302/5, 21B10B20AD15184ADD162SECTION 38D1314Math Test –No Calculator31D6510011
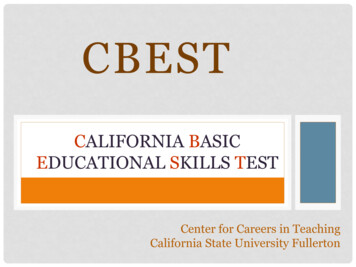
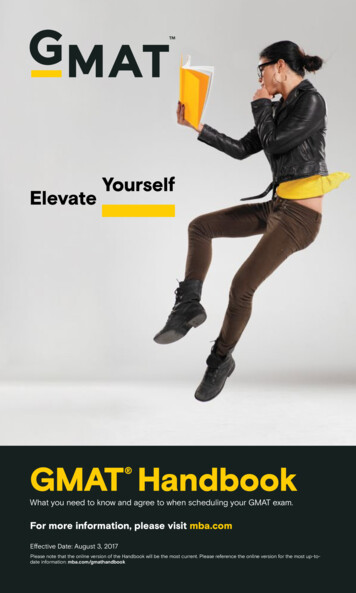
ScoreConversionWednesday, Oct. 10 Test FormRaw Score(# of correctanswers)ReadingTest Score473837.5453736.5484644Score conversions show how raw scores are converted intotest scores, cross-test scores, and subscores.IMPORTANT TO NOTE§ The section score for the Evidence-Based Reading andWriting section is calculated by adding the ReadingTest score to the Writing and Language Test score andmultiplying that figure by 10.§ The section score for the Math section is calculated bymultiplying the Math Test score by 20.§ There is no advantage or disadvantage in taking anyparticular test form.§ On every test, certain scores are not available, and arereferred to as “score gaps.” Score gaps emerge as aresult of a statistical process called equating in which thenumber of questions answered correctly and the difficultyof the questions are both considered when scoringacross the different tests taken nationwide. Although theCollege Board works to develop tests with the same levelof difficulty, the questions in them differ and thereforesome can be slightly easier or harder than others. Thiscan influence the placement of the score gaps throughoutthe scaled score range. With equating, test scores areequivalent and valid, regardless of when students testedor the level of difficulty of the test they 12019181716151413121110987654NOTE: Score conversions will not beavailable for the Saturday, October 13 testform or for schools participating in the testadministration study or research group.123210Writing andLanguageTest 098MathTest 41312111098
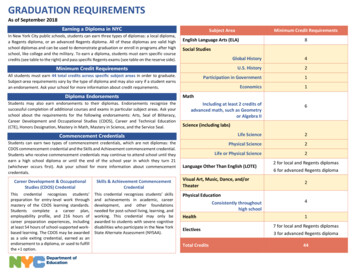
Wednesday, Oct. 24 Test FormRaw Score(# of correctanswers)ReadingTest ting andLanguageTest 113.512111010.598.5910889MathTest Score9.5813
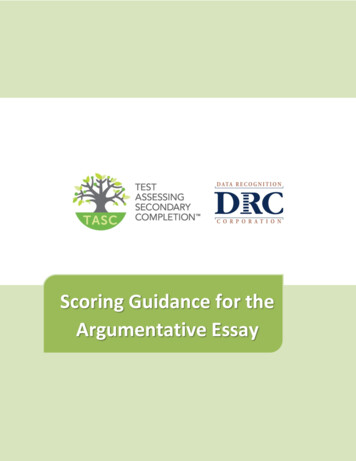
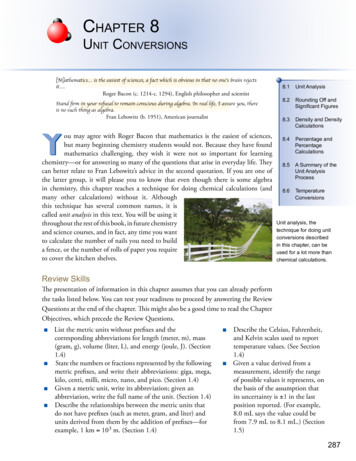
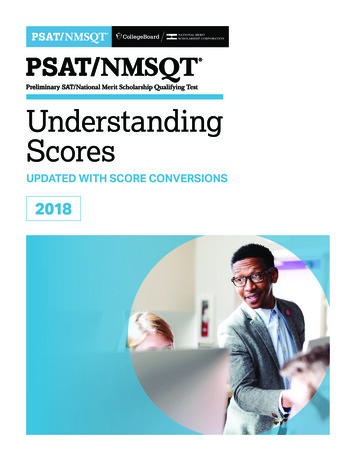
The PSAT/NMSQTScore ReportA Case Study: Ima B. Student’s PSAT/NMSQT Score ReportTake a look at Ima B. Student’s sample score report below and on the next page. Use the corresponding information to help youinterpret your student’s PSAT/NMSQT Score Report.What are Ima’s scores?YOUR SCORE TODAYYour Total Score960You are in theHi, Ima320 to1520Your Full Score Report960percentile51st320 to15201520?QuestionLevel DetailSeeSubscoresStrengths ou scored equal to or higher than 51% of studentsGo online for your full reportYour Evidence-BasedReading andWriting Score430You are in the31stYourMath Score530160 to760percentileYou are in the160 to76069thpercentile530430160760160760THE BENCHMARK IS 510THE BENCHMARK IS 460Your score shows thatyou’re almost on trackto be ready for college,but you need to keepbuilding your skills.Your score shows thatyou’re on track to beready for college.Your Test Scores*Reading2320 130 ptsMath8 to 38Writing and Language8 to 3826.58 to 38* Additional detailed scores, like test scores,provide students with a deeper understandingof their performance. Test scores are alsoused to calculate your NMSC Selection Index. 2018 The College Board. College Board, AP, SAT, and the acorn logo are registered trademarks of the College Board. BigFutureis a trademark owned by the College Board. PSAT/NMSQT is a registered trademark of the College Board and National MeritScholarship Corporation. National Merit and the corporate “Lamp of Learning” logo are federally registered service marks ofNational Merit Scholarship Corporation. All other marks are the property of their respective owners. Visit the College Board on theweb: collegeboard.org. You can also visit National Merit Scholarship Corporation at www.nationalmerit.org.Khan Academy is a registered trademark in the United States and other jurisdictions.Ima B. Student2018, 11th GradeScore Report14Ima,this was your scorewhen you tookthe test; it is not ameasure of how faryou can grow!Students with scoreslike yours increasedtheir performance fromthe PSAT/NMSQT tothe SAT by 130 pointsafter 10 or more hours ofpersonalized practice onKhan Academy .Ima’s Evidence-Based Reading andWriting score is 430, and her Mathscore is 530. In Evidence-BasedReading and Writing, Ima’s score isapproaching the benchmark, butshe is not quite on track for collegereadiness. In Math, however, Ima isexceeding the benchmark and is ontrack. Test scores, cross-test scores,and subscores can give Ima a betterunderstanding of areas to work on.What are Ima’s scorepercentiles?Since Ima is in the 11th grade, thepercentiles compare her scores withthose of all 11th graders in the nation.Ima scored as well as or better inEvidence-Based Reading and Writingthan 31% of a nationally representativegroup of juniors. In Math, she scoredas well as or better than 69% of anationally representative group ofjuniors. Additional percentiles areavailable in Ima’s online score report.How can Ima seeher full report?Ima can visit psat.org/myscore tosee her full score report, learn howto prepare for the SAT, and see herpotential for AP coursework.
What are Ima’s next steps?When Ima accesses her full score report atpsat.org/myscore, she’ll also be able to connect to free,personalized practice on Khan Academy, see her potentialfor AP coursework, and use the college- and careerplanning resources at BigFuture .YOUR PATH TOMORROWHere’s what else iswaiting for you online:139Will Ima be able to enter theNational Merit Scholarship Program?NMSC uses a Selection Index score based on PSAT/NMSQT scores asan initial screen of students who enter its scholarship programs. TheSelection Index score is double the sum of your Reading, Writing andLanguage, and Math Test scores.Eligibility InformationHow can Ima learn from her answers?Using her score report with her PSAT/NMSQT test booklet,Ima can see the actual questions, correct answers, anddifficulty level alongside her own answers. She can useher online score report to review the questions sheanswered incorrectly or omitted, and to see detailed answerexplanations.NOTE: For students at schools participating in the testadministration study or research group or testing onSaturday, October 13, the actual questions, answers, andanswer explanations won’t be provided, and the score reportwon’t include the correct answer CorrectAnswers1OmittedAnswersWRITING AND LANGUAGE44TotalQuestions26IncorrectA
Oct 10, 2018 · PSAT/NMSQT and the SAT Suite of Assessments The SAT Suite of Assessments is an integrated system of tests that includes the SAT (for students in grades 11 and 12), the PSAT/NMSQT and the PSAT 10 (for grades 10 and 11), and the PSAT 8/9 (for grades 8 and 9). The tests measure