Transcription
Advanced Analyticswith Power BI1
Data is everywhere. The world contains an astronomical amountof data, an amount that grows larger and larger each day. Thisvast collection of information has changed the way the worldinteracts, uncovered breakthroughs in medicine, and revealednew ways to understand trends in business and in our daily lives.With the increasing availability of data comes new challenges andopportunities as business leaders seek to gain important insightsand transform information into actionable and meaningful results.As data becomes more accessible, manipulating vast amounts ofavailable data to drive insights and make business decisions canbe a challenge. Business leaders at every level need to becomedata literate and be able to understand data and analyticalconcepts that may have previously seemed out of reach, includingstatistical methods, machine learning, and data manipulation. Withthis spread of data literacy comes the powerful ability to makeeducated business decisions that rely on the smart use of data,rather than on an individual’s opinions. In the past, these tasks wereextremely complex and would be handed off to engineers. With thetools that exist today, business leaders are able to dive into theirown analytics and uncover powerful insights.Microsoft Power BI brings advanced analytics to the daily businessdecision process, allowing users to extract useful knowledge fromdata to solve business problems. This white paper will cover theadvanced analytic capabilities of Power BI, including predictiveanalytics, data visualizations, R integration, and data analysisexpressions.2
Table of contentsAdvanced analytics in Power BI.4Predictive analytics with AzureR integrationQuick Insights featureSegmentation and cohort analysis.9Data grouping and BinningData streaming in Power BI .11Real-time dashboardsSetup of real-time streaming data setsVisualizations in Power BI.12Community-sourced visualizationsR visualizationsCustom visualizationsData connection and shaping.14Azure servicesDirectQueryData fetching with the R connectorData shaping in Power Query with RData Analysis Expressions.17Conclusion.18
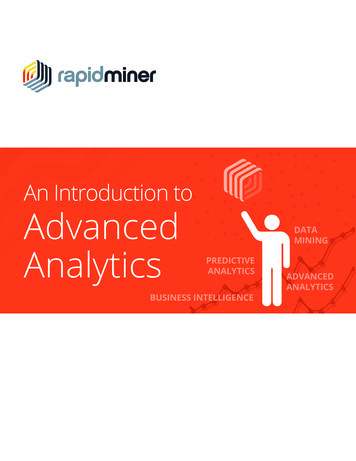
Advanced analytics in Power BIPredictive analytics with AzureImagine if you could review the latest output of yourorganization’s fraud model on demand, or analyze thesentiment of social media users who tweet or post aboutyour products. Power BI brings the predictive power ofadvanced analytics to allow users to create predictivemodels from their data, enabling organizations to makedata-based decisions across all aspects of their business.Through machine learning, computers are able to actwithout being explicitly programmed. Instead, they canteach themselves to grow and change when exposedto new data. Once the work of science fiction, machinelearning is rapidly becoming part of our daily lives—through practical speech recognition programs, moreeffective web searches, and even self-driving cars. UsingAzure Machine Learning Studio, users can quickly createpredictive models by dragging, dropping, and connectingdata modules. Power BI then allows users to visualize theresults of their machine learning algorithm.From azure-ml/ 4
To accomplish this in Power BI, first use R to extract datafrom Azure SQL that has not yet been scored by the machinelearning model. Next, use R to call the Azure MachineLearning web service and send it the unscored data. Writethe output of the Azure Machine Learning model back intoSQL and use R to read scored data into Power BI. Then,publish the Power BI file to the Power BI service. Finally,use the Personal Gateway to schedule a refresh of the data,which triggers a scheduled rerun of the R script and bringsin the new predictions.From azure-ml/ 5
R integrationR, a programming language used by statisticians, datascientists, and data analysts, is the most widely usedstatistical language in the world. R integration in Power BIbrings this language into all stages of generating insights.Using the R connector, users can run R scripts directly inPower BI and import the resulting data sets into a PowerBI data model.R in Power Query performs advanced data cleansing andpreparation asks, such as outlier detection and missingvalues completion. R visuals in Power BI allow you tovisualize data by gaining endless flexibility and advancedanalytics depth. Once the visuals are created, you canshare the R visuals in your reports and on your dashboard,where they are interactive and cross-filterable.Check out the R showcase for amazing examples of whatcan be done with R in Power BI.Power BI users do not need to have a background inworking with R to leverage everything that R can do, suchas prediction, clustering, association rules, and decisiontrees. R custom visuals allow users to apply the power ofR without writing one line of R. Just import a custom Rvisual to your report, and drag your data to update yourreport.From powerbi-desktop-r-scripts/ Because R is run directly in the Power BI service, reportsusing R can be shared with and viewed by anyone—evenif they don’t have R installed.Learn more:R connectorR in Power QueryR visuals in Power BIR showcaseR custom visuals6
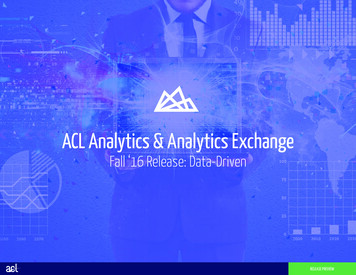
Quick Insights featureThe Quick Insights feature in Power BI is built on a growingset of advanced analytical algorithms, developed inconjunction with Microsoft Research, which allows users tofind insights in their data in new and intuitive ways. With asimple click, Quick Insights in Power BI searches differentsubsets of your data set while applying a set of sophisticatedalgorithms to discover potentially interesting insights. PowerBI scans as much of a data set as possible in an allottedamount of time.To use Quick Insights in Power BI, follow these steps.1. In the left navigation pane under Data sets, select theellipses (.), and then choose Quick Insights.2. Power BI uses various algorithms to search for trends inyour data set.3. Within seconds, your insights are ready. SelectView Insights to display visualizations.Or, in the left navigation pane, select the ellipses (.) andthen choose View Insights.NOTE: Some data sets are unable to generate insightsbecause the data isn’t statistically significant. To learnmore, see Optimize your data for quick insights.7
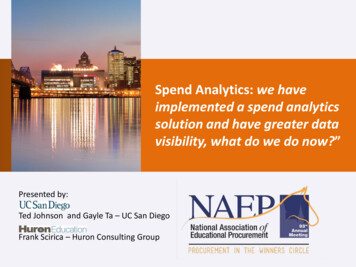
4. The visualizations display in a special Quick Insightscanvas with up to 32 separate insight cards. Each cardhas a chart or graph, plus a short description.Learn more:Quick insights with Power BITypes of Quick Insights8
Segmentation and cohort analysisSegmentation and cohort analysis is a simple, yet powerful,way to explore data and identify deviations from the norm.Segmentation and cohort analysis is simply the act ofbreaking down or combing data into meaningful groups,and then comparing those groups to identify meaningfulrelationships in your data. It is typically used to develop ahypothesis about your data and identify areas for furtheranalysis. Power BI has several tools to help this process,including clustering, grouping, and binning.Clustering allows you to use machine learning algorithms toquickly find groups of similar data points in a subset of yourdata. After you have created a cluster field of data, customvisuals in Power BI allow further analysis and evaluation ofthe clusters. For example, you could use the cluster columnand each of the associated measures in a radar chart to seethe aggregate of each measure for each cluster. You couldalso use the cluster column and one of the measures in a boxand whiskers plot to see the distribution of values for thatmeasure in each cluster. This can help you determine theminimum, maximum, and median values for that measurewithin each cluster.Learn more:Clustering9
Data grouping and BinningSometimes, two categories of data points within a field arebetter talked about together and should be grouped into asingle category. Grouping data points this way can help moreclearly view, analyze, and explore data and trends in visuals.While grouping applies to category fields, binning appliesto continuous fields such as date fields and numeric fields.Power BI recognizes these as continuous fields and bringsup a dialog box that allows you to bin the results bysetting the size of each bin.Typically applied in the explore phase of an analysis project,grouping manually aggregates data points into groups. Thesegroups become part of the data model and automaticallyapply to new or refreshed data.Learn more:Grouping and binning10
Data streaming in Power BIReal-time dashboardsSetup of real-time streaming data setsPower BI lets you easily display and analyze your realtime data, empowering your organization to gain instantinsights from time-sensitive information. Monitor socialmedia campaigns as they go viral. Display streamingvideo on your dashboards. Bring your dashboards to lifewith IoT sensor readouts. The rich functionality of PowerBI, combined with the velocity of real-time data, willtransform the way you do business.With Power BI real-time streaming, you can streamdata and update dashboards in real time. Any visualor dashboard that can be created in Power BI can alsobe created to display and update real-time data andvisuals. The devices and sources of streaming data canbe factory sensors, social media, service usage metrics,and anything else from which time-sensitive data canbe collected or transmitted. Streaming data can beconsumed two ways in Power BI: as tiles with visuals fromstreaming data, or as data sets created from streamingdata that persist in Power BI.Real-time data is all around us, and Power BI features aredesigned to help you get to that data with minimum setupcost. Integration with streaming data providers such asAzure Event Hub, PubNub, and Temboo allows Power BIto get to your real-time data—no matter where it lives.In addition, Power BI allows you to dive deep into yourreal-time data through integration with Microsoft AzureStream Analytics and Azure Machine Learning. Predictiveintelligence can help you take proactive action to stayon the right course, and stream analytics can shape andaggregate your data. Data streams are stored in the cloudfor historical analysis and visualization.Learn more:Real-time streaming in Power BI11
Visualizations in Power BIData visualizations allow you to interact with your data tofind business insights. Power BI lets you choose from a list ofavailable visualizations, add a custom visualization that youcreate yourself, or select from our expanding list of availablevisualizations in the community gallery.Community-sourced visualizationsPower BI has a visuals gallery with many useful visualizationscreated by both the community and Microsoft, which youcan download and use in your Power BI reports. To add acommunity-sourced visualization to your report, visit thevisuals library on the Power BI site. On the Welcome to PowerBI custom visuals page, browse the gallery. Select a visual tileto see more information about that visual, and download thevisual that you want to use.Learn more:Download a custom visual from the galleryAdd a custom visualization to a Power BI reportR visualizationsThe R Showcase in Power BI allows you to create new oruse existing advanced analytics in R visualizations throughthe community R Script Showcase to leverage R scripts inPower BI.Using the R Showcase, you’ll be able to apply complexalgorithms, visualizations, scripts, and more with just aclick. You don’t even need to know anything about R touse the R custom visuals. Just import an R custom visual toyour report, drag the data, and the R power will be appliedwithout writing one line of R code.To use the R Script Showcase in your reports, visit thecommunity page of the Power BI website. Click the R ScriptShowcase link, and then select and download the reportyou would like to use.Learn more:R Script Showcase12
Custom visualizationsCustom visualization in Power BI allows you to create fullcustom visuals to add to reports or submit to the PowerBI community for others to use. You can create a customvisual using Power BI developer tools, which let you designand test a custom visual by writing custom visual TypeScriptcode and creating CSS.Once you’ve tested your custom visual, you can export itto your Power BI dashboard, or submit it to the Power BIvisuals gallery.Learn more:Power BI Custom Visuals Gallery13
Data connection and shapingAzure servicesWith Azure services and Power BI, you can turn your dataprocessing efforts into analytics and reports that providereal-time insights into your business. Whether your dataprocessing is cloud-based or on-premises, straightforward orcomplex, single-sourced or massively scaled, warehoused orreal-time, Azure and Power BI have the built-in connectivityand integration to bring your business intelligence effortsto life. A multitude of Azure connections are available, andthe business intelligence solutions you can create with Azureservices are as unique as your business. You can connect justone Azure data source, or a handful, and then shape andrefine your data to build customized reports.Power BITo use an Azure connection in your Power BI dashboard,select an Azure data source in the Get Data dialog to bringin a wide variety of sources.Power BILearn more:Azure and PowerBIStream Analytics & Power BI14
DirectQueryDirectQuery allows you to build visualization over very largedata sets, where it would otherwise be unfeasible to importall of the data. Traditionally, un
Power BI has a visuals gallery with many useful visualizations created by both the community and Microsoft, which you can download and use in your Power BI reports. To add a community-sourced visualization to your report, visit the visuals library on the Power BI site. On the Welcome to Power BI custom visuals page, browse the gallery. Select a visual tile to see more information about that .