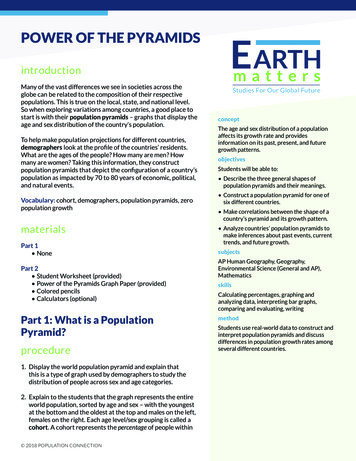
Transcription
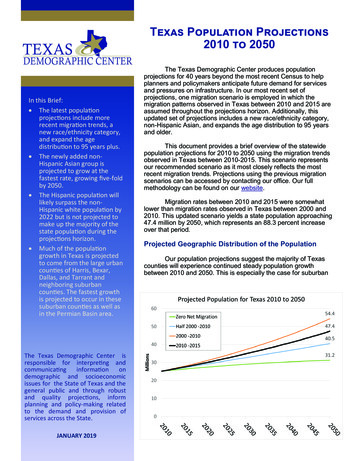
Texas Population Projections2010 to 2050In this Brief: The latest populationprojections include morerecent migration trends, anew race/ethnicity category,and expand the agedistribution to 95 years plus. The newly added nonHispanic Asian group isprojected to grow at thefastest rate, growing five-foldby 2050. The Hispanic population willlikely surpass the nonHispanic white population by2022 but is not projected tomake up the majority of thestate population during theprojections horizon. Much of the populationgrowth in Texas is projectedto come from the large urbancounties of Harris, Bexar,Dallas, and Tarrant andneighboring suburbancounties. The fastest growthis projected to occur in thesesuburban counties as well asin the Permian Basin area.The Texas Demographic Center isresponsible for interpreting andcommunicatinginformationondemographic and socioeconomicissues for the State of Texas and thegeneral public and through robustand quality projections, informplanning and policy-making relatedto the demand and provision ofservices across the State.JANUARY 2019The Texas Demographic Center produces populationprojections for 40 years beyond the most recent Census to helpplanners and policymakers anticipate future demand for servicesand pressures on infrastructure. In our most recent set ofprojections, one migration scenario is employed in which themigration patterns observed in Texas between 2010 and 2015 areassumed throughout the projections horizon. Additionally, thisupdated set of projections includes a new race/ethnicity category,non-Hispanic Asian, and expands the age distribution to 95 yearsand older.This document provides a brief overview of the statewidepopulation projections for 2010 to 2050 using the migration trendsobserved in Texas between 2010-2015. This scenario representsour recommended scenario as it most closely reflects the mostrecent migration trends. Projections using the previous migrationscenarios can be accessed by contacting our office. Our fullmethodology can be found on our website.Migration rates between 2010 and 2015 were somewhatlower than migration rates observed in Texas between 2000 and2010. This updated scenario yields a state population approaching47.4 million by 2050, which represents an 88.3 percent increaseover that period.Projected Geographic Distribution of the PopulationOur population projections suggest the majority of Texascounties will experience continued steady population growthbetween 2010 and 2050. This is especially the case for suburban
2010-2015 Migration TrendsDomestic migration made up a larger share of total net migration between 2010 and 2015, whileinternational migration made up a larger share of total net migration between 2000 and 2010. This isone of the most important key differences in how the migration trends employed in the latestpopulation projections differ from the migration trends observed between 2000 and 2010.On average, net migration contributed approximately 178,000 migrants annually to the Texaspopulation between 2000 and 2010. By contrast, between 2010 and 2015, net migration contributedan average of 198,000 migrants annually to the state population. In essence, an additional 20,000 netmigrants were added annually to the Texas population during this most recent migration period thanduring the last decade.Net migration to the state is comprised of domestic migration (or migrants moving to Texas from otherstates) and international migration (or immigrants moving to Texas from another country). Between2000 and 2010, international migration made up over half, or 52 percent, of the total net migration tothe state, and domestic migration contributed about 48 percent of the total net migration. In contrast,between 2010 and 2015, domestic migration made up over 60 percent of the total net migration to thestate, compared to less than 38 percent added from international migration.These differences in the migration patterns employed in our most recent population projections havesignificant implications for the projected findings. For instance, certain parts of the state are mostimpacted by population changes associated with domestic migration, whereas other parts of the stateare more impacted by changes in international migration. The latest projections indicate faster andmore growth in areas characterized by high domestic migration and slower growth in some bordercounties and other areas of the state with high shares of international migration. Additionally,domestic migration is more often characterized by migration of non-Hispanic whites, whereasinternational migration to Texas is more often characterized by migration of Hispanics. Therefore, themost recent projections employing the 2010 to 2015 migration patterns produce an increased rate ofgrowth for the non-Hispanic white population and a slower rate of growth for Hispanics. Indeed, if thepatterns of strong domestic migration (mostly comprised of migration by non-Hispanic whites) and asmaller share of international migration continues into the future, our projections indicate this patterncould mitigate and even compensate for the aging effect of the Baby Boom generation on the Texaspopulation.These projections, like all projections, are beholden to their underlying assumptions, which may ormay not occur. One such key assumption is the migration scenario. Migration trends to Texasbetween 2010 and 2015 represent a high migration period, particularly domestic migration of nonHispanic Whites. More recent data, yet to be incorporated into the Population Estimates andProjections Program, indicate slower and more diversified migration rates to Texas. As we continue todiligently observe emerging demographic trends in Texas and incorporate new data, we will updateour projections.counties surrounding the large urban centers ofDallas-Fort Worth, Houston, San Antonio, andAustin. All of these suburban counties are projectedto experience a growth rate greater than that of theState as a whole, with 27 of these counties projectedto double their populations by 2050. Additionally, anumber of counties in the Permian Basin andsurrounding the Midland-Odessa area will also seecontinued growth. Although many of the large urbancounties are also projected to experience highgrowth rates, only Harris, Bexar, and Travis Countiesare expected to grow faster than the State. Theseprojections also indicate slower growth in areas ofthe Rio Grande Valley and El Paso County. Lastly,our projections suggest continued population declinein 99 counties, located mostly in West Texas, parts ofEast Texas, and parts of South Texas.Projections by Age, Sex, and Race/EthnicityAgeThe current population projections expand theage distribution to include the population aged 95years and older. This age group is captured in Tables1 and 2 below in the 85 plus age category. Whencompared to the other age categories, the agecategory including Texans over 85 years of age isprojected to grow at the fastest rate. The eldestseniors, those 85 years of age and older, areprojected to nearly quadruple in size between 2010and 2050, approaching 1.5 million. The age categoryincluding those 65 to 84 years of age is projected to2
throughout the projections horizon and ends withslightly more females than males.be the second fastest growing age group, nearlydoubling in size by 2050 to a population of over 6.8million. The younger age categories are projected tocontinue a slower but steady growth, with children,ages 0 to 4 and 5 to 17, projected to be the slowestgrowing age groups.Race/EthnicityThis most recent set of projections includesthe addition of the non-Hispanic Asian race/ethnicitycategory. In previous projections, the non-HispanicAsian group was part of the non-Hispanic Otherracial/ethnic category. Projections indicate this newrace/ethnicity group, non-Hispanic Asians, will growat the fastest rate, when compared to other racial/ethnic categories. The non-Hispanic Asian populationis projected to near 6 million by 2050, with aSexThe 2010 Census showed nearly equalproportions of males and females in the State, withslightly more females than males. Both groups areprojected to approach 24 million by 2050. The sexratio is projected to remain about the sameProjected Percent Population Change in Texas Counties, 2010 to 20502010-2015 Migration ScenarioLess than 0% (99)0% to 25% (76)25% to 50% (20)50% to 75% (18)75% to 100% (14)100% and greater (27)3
population growth rate of morethan 5 times the 2010population. The non-HispanicAsian population is projected tomake up over 12 percent of thetotal State population in 2050.The non-Hispanic Otherrace/ethnicity category,consisting mostly of populationof two or more races, continuesto grow rapidly and is projectedto grow to nearly 2 million by2050, tripling in size during thistime period.The Hispanic populationis growing at a rapid rate aswell as increasing its proportionof the total State population.Our projections suggest theHispanic population will morethan double its size in 2010 toover 20 million by 2050. Thenon-Hispanic black population is also projected todouble in size, growing to over 6 million by 2050. Thenon-Hispanic white population is projected to grow ata steady but slower pace relative to the other race/ethnicity categories, growing to a total population of13.5 million by 2050. Our population projectionssuggest the Hispanic population will likely surpass thenon-Hispanic White population in size by 2022.However, the Hispanic population is not projected tomake up a majority of the Texas populationthroughout this projection’s 2050 horizon.Table 1. Texas Population 2000, 2010 and Projected Population, 2020-2050 by Select CharacteristicsPopulationCharacteristicsCensus 2000Population Projections, 2010-2015 Migration ScenarioCensus 20102020203020402050Total NH 3,51413,523,839NH 6,030,795NH 2,908NH 260,82020,191,7500-4 3,017,0915-17 7,730,36718-44 00217,094,93045-64 11,193,34865-84 5,34485 Years Plus4
Table 2. Texas Projected Numeric and Percent Change, 2010 to 2050 by Select CharacteristicsProjected Numeric Change from 2010,2010-2015 Migration cted Percent Change from 2010,2010-2015 Migration Scenario20502020203020402050Total 2117,768,94511,053,77017.8738.5061.3087.22NH .8518.66NH 8.12108.91NH 297.72509.74NH 52.7682.44113.420-4 6.455-17 .6656.5718-44 854.7477.2445-64 3.8785.5365-84 01.23241.87389.99Hispanic85 Years PlusProjected Age Structure of the Populationstructure. Most strikingly, the projected populationpyramid for Texas in 2050 loses much of itspyramidal shape and begins to look more like arectangle, with a slightly tapered base — indicatingdecreasing fertility rates,and a broader “peak” —representing the growingproportion of those in theolder age categories. Whilethe older age categories,ages 60 plus, are projectedto include more femalesthan males, the agecategories including thoseunder 60 years areprojected to include moremales.Population pyramids for Texas in 2010 and2050 reveal key changes in the sex and agePopulation Growth andDecline in TexasCountiesNumerically, muchof the population growth isprojected to come from thelarge urban counties ofHarris, Bexar, Dallas, andTarrant, with each of these5
counties projected to add over one million peopleby 2050. Other counties projected to add over onemillion in population during this time period, includeFort Bend, Collin, Denton, Williamson, andMontgomery. Together, these counties areprojected to add over 15.5 million between 2010and 2050.populations between 2010 and 2050, adding a totalpopulation of over 4.8 million or 22 percent of thetotal State population change projected between2010 and 2050.Although Texas is generally characterized byrapid and high growth, 99 of the 254 counties areprojected to have declines in population. HaleCounty, located in the Texas Panhandle, is projectedto have the greatest population decline between2010 and 2050, projected to lose over 14,000residents during this time period. Among countieswith the greatest population losses are countiesmostly in rural and more sparsely populated areas ofthe state, particularly in parts of West, East, andSouth Texas. Two counties with populations over100,000 are among the top counties with theThe top 10 counties projected to have thefastest growth rates are a combination of suburbancounties, such as Hays, Kendall, Williamson, FortBend, and Comal, and counties in the PermianBasin area, including Andrews, Crane, Midland,and Ector. Karnes County, located southeast ofSan Antonio, is projected to grow at the fastest rateof all the Texas counties. All of these suburbancounties are projected to more than double theirTable 3. Top 10 Texas Counties with Greatest andLeast Numeric Change between 2010 and 2050 20102015 Migration ScenarioCountyRanking20102050Table 4. Top 10 Texas Counties with Greatest andLeast Percent Change between 2010 and 2050 20102015 Migration ScenarioNumericChangeHarris14,092,459 7,900,994 3,808,535Fort s114,824126,431752.88585,375 2,254,963 1,669,588Andrews214,786100,627580.563782,341 2,444,316 1,661,975Hays3157,107743,171373.03Denton4662,614 2,323,056 1,660,442Crane44,37518,418320.98Bexar51,714,773 3,343,929 139 3,858,686 034 3,184,835 1,375,801Williamson7422,679 1,638,796287.72Williamson8422,679 1,638,796 1,216,117Fort Bend8585,375 2,254,963285.22Montgomery9455,746 1,483,476 659-6,414Jeff -6,906Hale25036,27322,050-39.21Val 2,654-66.051,024,266 1,974,018949,7526
Conclusiongreatest population losses between 2010 and 2050.These counties are Potter and Wichita Counties.The most recent population projections fromthe Texas Demographic Center employing themigration trends observed between 2010 and 2015indicate Texas may reach a population of nearly47.4 million. Much of the growth in the State isprojected to take place in the large urban corecounties of the State along with the surroundingsuburban ring counties. These suburban counties,as well as counties located in the Permian Basin,are projected to grow at the fastest rates during thistime. These projections also indicate the State willcontinue to age, with the fastest growing age groupsbeing those of ages 65 years and older. TheHispanic population is projected to continue to drivepopulation growth, and the newly added nonHispanic Asian group is projected to grow at ratesfaster than those of other race/ethnicity groups.Amid population growth, parts of Texas areprojected to continue to decline, especially sparselypopulated, rural counties in parts of West, East, andSouth Texas.The top 10 counties with the lowest percentchange are projected to lose between 35 and 66percent of their populations between 2010 and2050. The county projected to have the greatestpopulation decline, in terms of percentage, by 2050is Presidio County, located south of El Paso alongthe Texas-Mexico border.These projections, like all projections,involve the use of certain assumptions about futureevents that may or may not occur. Users of theseprojections should be aware that although theprojections have been prepared with the use ofdetailed methodologies and with extensive attemptsbeing made to account for existing demographicpatterns, they may not accurately project the futurepopulation of the State or of particular counties inthe State. Additionally, given that these projectionsare for 2010 to 2050 but incorporate a newmigration scenario and updated birth, death, andspecial populations data, they may not be similar tothose released by the program in 2014. Thecomplete population projections methodology, datafor download, interactive maps, and our onlineprojections tool are available on our website:About this ReportThe Texas Demographic Center produced thisreport as part of the Population Estimates andProjections Program. The report’s authors include:Helen You, Lloyd Potter, Lila Valencia, and EPP/Projections/Index.aspx.San Antonio OfficeThe University of Texas at San Antonio501 West Cesar E. Chavez Blvd.San Antonio, TX 78207-4415Ph: 210-458-6543Fax: edu@TexasDemography7Austin OfficeP.O. Box 13455Austin, TX 78711Ph: 512-463-8390Fax: 512-463-7632
Jan 28, 2019 · Texas Population 2000, 2010 and Projected Population, 2020-2050 by Select haracteristics. 5 structure. Most strikingly, the projected population pyramid for Texas in 2050 loses much of its pyramidal shape and begins to look more li