Transcription
N I R I A N A LY T I C SNIRI Measuring Your IRProgram’s Succes s ResearchRepor t
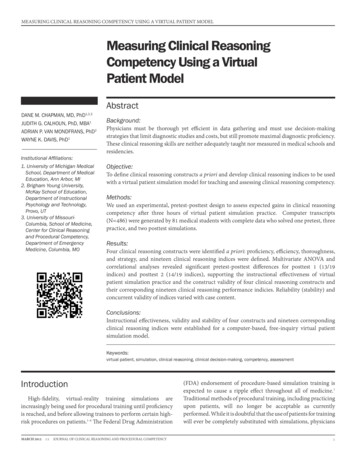
E xe cutive Summar y 93 percent of IROs use at least one goal fortheir IR program. The most frequently used IR goals arequantitative in nature. Differences can be seen in the type(quantitative or qualitative), and number of IRgoals used, by company size. 81 percent of IROs use at least one IR metricto measure their IR program’s success. Type (quantitative or qualitative), number of IRmetrics used, and IR metric category, all variedby company size. 7 distinct IR metric categories, and the top 5IR metrics used are detailed in this report.2N I R I A N A LY T I C S M E AS U R I N G YO U R I R PR O G R A M’S S U C C ES S R ES E A R C H R EP O R T
SECTION 1RespondentDemographics andSur vey Methodology
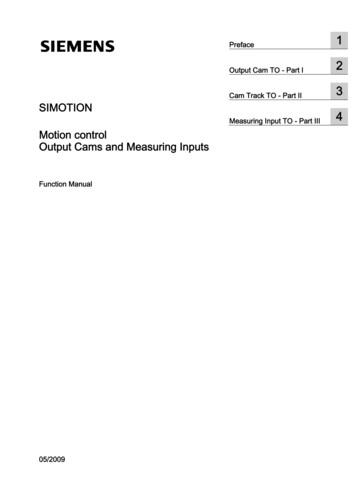
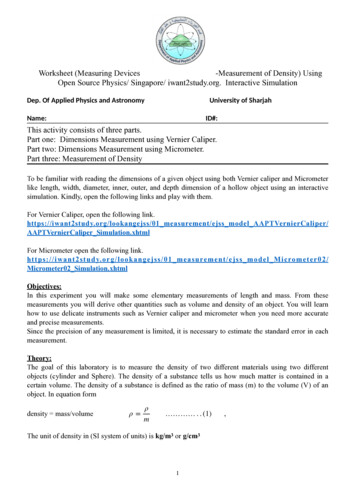
Methodologya margin of error of plus or minus 3.9 percent at a 95All NIRI corporate members were invited to participatepercent confidence level. This means that if the surveyin this electronic survey through direct e-mail invitationswas repeated 100 times with different samples from thefrom July 25 to August 15, 2016. The survey inquiredpopulation of IROs, 95 out of 100 samples would yield aabout IR department goals, and goal measurementresult within plus or minus 3.9 percent of each statisticmetrics for corporate investor relations professionalsreported in this study. For example, if an answer is offeredby 50 percent of respondents, the results would rangeworking within publicly traded companies. The surveybetween a high of 54 percent (rounded) and a low of 46also collected demographic information.percent for 95 out of 100 other samples from the sameA total of 515 individuals completed the survey, yieldingpopulation. In charts and tables, numbers may not totala response rate of 19 percent. A sample of this size has100 percent due to rounding.MARKET CAP SIZECOMPANY INDUSTRYAuto & Components32%3%Capital Goods3%Commercial & Professional ServicesConsumer Durables & Apparel25%1%Banks2%1%Consumer Services3%Diversified Financials3%Energy19%Food, Beverage & Tobacco13%8%3%Health Care Equipment & Services11%Household & Personal euticals, Biotechnology & Life SciencesMicro-cap Small-capMid-capLarge-capMicro-cap: Less than 250 million6%Real EstateMega-capRetailing3%Semiconductors & Semiconductor Equipment3%Software & ServicesSmall-cap: 250 million-less than 2 billion11%Technology Hardware & EquipmentMid-cap: 2 billion-less than 10 billionLarge-cap: 10 billion-less than 25 billionMega-cap: 25 billion 7%Telecommunication Services2%Transportation2%Utilities4N I R I A N A LY T I C S M E AS U R I N G YO U R I R PR O G R A M’S S U C C ES S R ES E A R C H R EP O R T4%
SECTION 2IR Program Goals
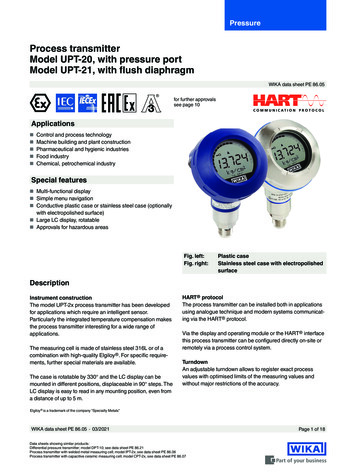
COMPANY HAS AT LEAST ONE GOAL FOR IR PROGRAM BY MARKET arge-capMega-capN 230IR Program Goalsfor their IR department, with at least 9 out of 10 companiesNIRI asked IROs what their current goals were for theiracross all market caps (and in the case of micro-caps, 10IR program. The question was open-ended to allow forout of 10 companies) reporting at least one goal. Acrossfreedom of response. All reported goals were categorized,all market caps, the most frequently cited IR goals wererevealing a mix of both quantitative and qualitative currentquantitative (“diversify, increase, meet with, reduce,”goals. Overall, 93 percent of respondents mentioned atetc.), followed in frequency by qualitative goals (“improve,least one goal currently being used to measure successeffective, clarify, awareness,” etc.). Differences canfor their IR program. Of those, 78 percent of respondentsreport utilizing quantitative goals, 56 percent utilizebe noted in the types of goals used by IROs in smallerqualitative, and 40 percent use a mix of both. Whencompanies compared to larger companies, with moreanalyzed by company size, small differences can be seenemphasis placed on quantitative language in smallerin the percentage of companies that choose to have goalscaps.6N I R I A N A LY T I C S M E AS U R I N G YO U R I R PR O G R A M’S S U C C ES S R ES E A R C H R EP O R T
In micro-cap companies, the most frequently cited IRThe number of goals per IR department varied by, and wasgoal was “to increase/improve/diversify the shareholderpositively correlated to, company size. For example micro-capsbase/top shareholders,” while in mega-cap companiesexpressed, on average, just over 2 goals per department, whileit was “to improve shareholder communications/analystmega-caps mentioned almost 3 goals. The overall averagecoverage/analyst quality/ensure understanding of thenumber of current goals was 2.3 per IR department.story.”MEAN NUMBER OF GOALS USED TO MEASURE IR PROGRAM SUCCESS BY MARKET Large-cap2.9Mega-capN 2300.00.51.01.52.02.57N I R I A N A LY T I C S M E AS U R I N G YO U R I R PR O G R A M’S S U C C ES S R ES E A R C H R EP O R T3.0
TYPE OF GOALS USED TO MEASURE IR PROGRAM SUCCESS BY MARKET CAPMicro-capSmall-capQuantitative GoalsMid-capQualitative GoalsLarge-capMix of BothMega-capNo Goals MentionedN 248. Participants could select multiple responses, will sum to 100%.The chart above illustrates how the use of quantitativebe seen in the types of goals chosen by market-cap size. Forgoals declines slightly, and the use of qualitative goals,example, 73 percent of micro-caps who report only one typea mix of both, or no goals at all, generally increases asof goal make them quantitative, while 56 percent of mega-market-cap size increases. Additionally, among IROs whocaps do the same. Conversely, only 13 percent of micro-capsare currently using only one type of goal (either quantitative orchoose to use only qualitative goals, while for mega-caps, thisqualitative goals, rather than a mix of the two) differences canpercentage jumps to one-third (31 percent).8N I R I A N A LY T I C S M E AS U R I N G YO U R I R PR O G R A M’S S U C C ES S R ES E A R C H R EP O R T
SECTION 3IR Program Metrics
COMPANY USES AT LEAST ONE METRIC FOR IR PROGRAM BY MARKET rge-capMega-capN 230.IR Program Metricsone metric to measure their IR program’s success.NIRI asked IROs to describe the metrics they use toWhile only 7 percent of IROs did not specify at leastmeasure their IR program’s success. Answers to thisone current goal for their IR department, almostopen-ended question were labeled and categorized,resulting in seven distinct groups of qualitative andquantitative metrics. Similar to IR goals, when analyzedby company size, small differences can be seen inthree times that amount (19 percent) did not mentionat least one metric. Of those that did mention atleast one, 74 percent of respondents report utilizingthe percentage of companies that choose to usequantitative metrics for their IR department, 31 percentmetrics for their IR department, with 75 percent orutilize qualitative, and 24 percent use a mix of bothmore across all market caps reporting they use at leastquantitative and qualitative metrics.10N I R I A N A LY T I C S M E AS U R I N G YO U R I R PR O G R A M’S S U C C ES S R ES E A R C H R EP O R T
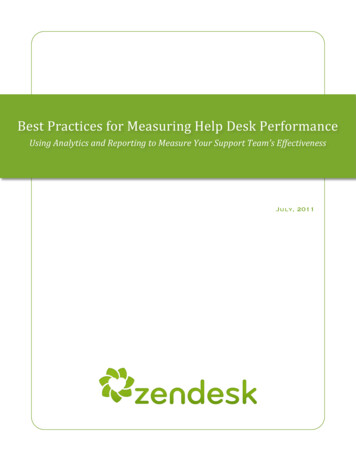
The top predictor of whether an IRO will use quantitativewith the relationship between the number of IR goals andmetrics to measure their IR program’s success, is their usecompany size, the number of different metrics used perof quantitative goals. IROs who use at least one quantitativeIR department varied by, and was positively correlatedgoal were 0.34 times more likely to use quantitative metrics towith, company size. For example micro-caps mentioned,measure their IR program’s success. Use of qualitative goalson average, under 2 metrics (1.7) per department, whilewas the top predictor of use of qualitative metrics for an IRmega-caps mentioned 2.4 metrics. The overall averageprogram. IROs who use at least one qualitative goal werenumber of metrics was 2 per IR department.0.28 times more likely to use qualitative metrics. In lineMEAN NUMBER OF METRICS USED TO MEASURE IR PROGRAM SUCCESS BY MARKET ge-cap2.22.4Mega-cap0.00.51.01.52.0N 228.11N I R I A N A LY T I C S M E AS U R I N G YO U R I R PR O G R A M’S S U C C ES S R ES E A R C H R EP O R T2.5
TYPE OF METRICS USED TO MEASURE IR PROGRAM SUCCESS BY MARKET CAPMicro-capSmall-capQuantitative MetricsMid-capQualitative MetricsLarge-capMix of BothMega-capNo Metrics MentionedN 228. Participants could select multiple responses, will sum to 100%.After use of quantitative IR goals, company size was thesuccess. The chart above illustrates how use of quantitativesecond strongest predictor of use of quantitative metricsmetrics increases, while use of qualitative metrics or a mixto measure an IR program’s success. For every increaseof both fluctuates, and use of no metrics at all decreases, asin market cap size, an IRO was 0.16 times more likely tomarket cap size increases.use quantitative metrics to measure their IR department’s12N I R I A N A LY T I C S M E AS U R I N G YO U R I R PR O G R A M’S S U C C ES S R ES E A R C H R EP O R T
Types of MetricsInterestingly, while smaller-cap company IROs more frequently use quantitative IR goals, large and megacap companies are more likely to use quantitative IR metrics. Among IROs who are currently using onlyone type of metric (either quantitative or qualitative, rather than a mix of the two types) we can also seedifferences in the types of metrics chosen by market-cap size. For example, while 58 percent of micro-capswho report only one type of metric choose quantitative measurements, 80 percent of mega-caps do thesame. Conversely, while 17 percent of micro-caps choose to use only qualitative metrics, only 5 percent oftheir mega-cap IRO counterparts reported the same.IR METRICS CATEGORIES: STOCK PRICE/SHARE FLUCTUATION ANALYST COVERAGE INVESTOR OUTREACH (NDRS, ROADSHOWS, MEETINGS, EVENTS) PERCEPTION STUDIES/INVESTOR FEEDBACK SHAREHOLDER COMPOSITION/DIVERSITY IR COMMUNICATIONS/UNDERSTANDING OF THE IR STORY OTHER METRICS (WEB ANALYTICS, MANAGEMENT PERCEPTION, AWARDS)Across all market-caps, the most frequently mentioned IR metrics used quantitative language (“number of,increase in, decrease in, meet with xx number of, top ten, stock price,” etc.). Overall, qualitative metrics(“success of, management happiness, quality of, informal,” etc.) were not as frequent. Just as there aredifferences in the types of goals used, however, there are also differences in the types of metrics used, bycompany size.13N I R I A N A LY T I C S M E AS U R I N G YO U R I R PR O G R A M’S S U C C ES S R ES E A R C H R EP O R T
For smaller companies, shareholder composition/diversitythe ability to conduct investor outreach events (such as NDRs,was the number one metric used, followed by stock price/etc.) and expensive perception studies increases, while smallershare volatility. For larger companies, it was quality of investorcompanies might rely more heavily on metrics they can trackoutreach, followed by perception studies/investor feedback.internally with little budget spend, such as the composition ofThis is to be expected, since as a company’s IR spend grows,their shareholder base, and their stock price/fluctuation.SPECIFIC IR METRICS USED TO MEASURE IR PROGRAM SUCCESS BY MARKET CAPMicro and Small-capLarge and Mega-capInvestor outreach 37%Shareholder composition 28%Stock price 22%Investor outreach 22%Perception studies 20%Stock price 15%Shareholder composition 15%Perception studies 12%N 156.14N I R I A N A LY T I C S M E AS U R I N G YO U R I R PR O G R A M’S S U C C ES S R ES E A R C H R EP O R T
TOP 5 IR PROGRAM METRICS USED1QUALITY OF INVESTOR OUTREACH (NDR S, MEETINGS,EVENTS, CONFERENCES, ETC.)2SHAREHOLDER COMPOSITION/DIVERSITY3STOCK PRICE/SHARE FLUCTUATION4PERCEPTION STUDIES/INVESTOR FEEDBACK5ANALYST COVERAGE15N I R I A N A LY T I C S M E AS U R I N G YO U R I R PR O G R A M’S S U C C ES S R ES E A R C H R EP O R T
QUALITY OF INVESTOR OUTREACH (NDR S, MEETINGS, EVENTS, CONFERENCES,ETC.)“Number of management calls and meetings held with both buy and sell-side targets.”-- Micro-cap: Less than 250 million, Telecommunication Services.“Number of NDRs and sell-side conferences.” -- Small-cap: 250 million to less than 2billion, Materials.“Number of top shareholders introduced in person, view the correlations betweeninteractions and share purchases.” -- Small-cap: 250 million to less than 2 billion,Pharmaceuticals, Biotechnology & Life Sciences.“The quality of meetings between investment and management. Management team logsat least fifteen days on the road doing NDRs and conferences.” -- Mid-cap: 2 billion toless than 10 billion, Diversified Financials.“Number and quality of conferences, meetings, roadshows and calls. Number ofmeeting requests and conference call participants.” -- Mid-cap: 2 billion to less than 10 billion, Insurance.“The percent of shares covered at NDRs and at conferences attended, and the numberof targets contacted.” -- Large-cap: 10 billion to less than 25 billion, Media.“Number of meetings and calls with Top 50 shareholders.” -- Large-cap: 10 billion toless than 25 billion, Retailing.“Quality (defined as size/portfolio turnover metrics) of meetings during our NDRs andconferences.” -- Large-cap: 10 billion to less than 25 billion, Energy.“Quality of our investor meetings towards attracting large, material shareholders.” -Mega-cap: 25 billion and above, Health Care Equipment & Services.“Attend twelve sell-side conferences; IRO presents at seven sell-side conferences;Conduct roadshows in thirty-five cities; Ensure at least fifteen investors from a roadshowmeeting purchase at least 100,000 shares within six months.” -- Mega-cap: 25 billionand above, Household & Personal Products.16N I R I A N A LY T I C S M E AS U R I N G YO U R I R PR O G R A M’S S U C C ES S R ES E A R C H R EP O R T
SHAREHOLDER COMPOSITION/DIVERSITY“Percent that is institutionally held.” -- Micro-cap: Less than 250 million, DiversifiedFinancials.“Our shareholder base - the percent that is institutional vs. retail by their geographiclocation.” -- Micro-cap: Less than 250 million, Software & Services.“Number of new shareholders each year purchasing fifty thousand shares or more,relative multiples.” -- Small-cap: 250 million to less than 2 billion, TelecommunicationServices.“The percentage of our stock held by value holders.” -- Small-cap: 250 million to lessthan 2 billion, Pharmaceuticals, Biotechnology & Life Sciences.“Percentage of institutional ownership by a combination of Growth/GARP style firms.” -Small-cap: 250 million to less than 2 billion, Technology Hardware & Equipment.“Broaden the percent of ownership from the Top 25 and add GARP/low-mid turnoverinvestors to the shareholder base.” -- Small-cap: 250 million to less than 2 billion,Utilities.“Our Top 15 quality investors (defined as having an annual turnover rate of fifty percentor less) own at least ninety percent of our stock as of our set end-of-year date.” -- Midcap: 2 billion to less than 10 billion, Real Estate.“Weighted average shareholder turnover and holding period.” -- Mid-cap: 2 billion toless than 10 billion, Retailing.“Our targeted vs. actual shareholder profile.” -- Large-cap: 10 billion to less than 25billion, Healthcare Equipment & Services.“Holdings by long-only investors.” -- Mega-cap: 25 billion and above, Retailing.“Reduce our concentration of institutional ownership over time.” -- Mega-cap: 25billion and above, Transportation.17N I R I A N A LY T I C S M E AS U R I N G YO U R I R PR O G R A M’S S U C C ES S R ES E A R C H R EP O R T
STOCK PRICE/SHARE FLUCTUATION“Stock price and daily volume.” -- Micro-cap: Less than 250 million, Media.“The turnover rates of our Top 10 shareholders, our stock volatility and our stockperformance relative to peers.” -- Small-cap: 250 million to less than 2 billion, ConsumerServices.“An increase in multiple assigned to our company valuation.” -- Small-cap: 250 million toless than 2 billion, Energy.“Valuation, P/E.” -- Mid-cap: 2 billion to less than 10 billion, Capital Goods.“Stock performance relative to the SOX and TSRR.” -- Mid-cap: 2 billion to less than 10billion, Consumer Durables & Apparel.“EV/EBITDA multiple.” -- Mid-cap: 2 billion to less than 10 billion, Health CareEquipment & Services.“Our revenue multiple vs. our peers.” -- Mid-cap: 2 billion to less than 10 billion,Retailing.“Stock price and the turnover rate of our top long funds.” -- Large-cap: 10 billion to lessthan 25 billion, Consumer Durables & Apparel.“Improved P/E and lower beta, this is a long-term goal.” -- Large-cap: 10 billion to lessthan 25 billion, Health Care Equipment & Services.“Holding period calculations.” -- Mega-cap: 25 billion and above, Health Care Equipment& Services.“P/E ratio relative to our peers.” -- Mega-cap: 25 billion and above, Banks.“Relative stock performance vs. our peers and in the major indices.” -- Mega-cap: 25billion and above, Real Estate.18N I R I A N A LY T I C S M E AS U R I N G YO U R I R PR O G R A M’S S U C C ES S R ES E A R C H R EP O R T
PERCEPTION STUDIES/INVESTOR FEEDBACK“Qualitative measures related to the success of outreach, and our investor perceptions.” -Small-cap: 250 million to less than 2 billion, Technology Hardware & Equipment.“Investor and sell-side analyst feedback.” -- Small-cap: 250 million to less than 2 billion,Insurance.“Surveying our top buyers and sellers, investor perception studies.” -- Mid-cap: 2 billionto less than 10 billion, Automobiles & Components.“What investors say about us. We have management directly ask our investmentcommunity ‘How’s our IR?’” -- Mid-cap: 2 billion to less than 10 billion, Automobiles &Components.“We complete shareholder and analyst perception studies annually.” -- Mid-cap: 2 billionto less than 10 billion, Pharmaceuticals, Biotechnology & Life Sciences.“No specific metric, we utilize perception studies to gather feedback from the buy and sellside.” -- Large-cap: 10 billion to less than 25 billion, Food & Staples Retailing.“Perception studies and SWOT analysis.” -- Large-cap: 10 billion to less than 25 billion,Food, Beverage & Tobacco.“Shareholder feedback and perception studies regarding whether our strategy was heard.”-- Large-cap: 10 billion to less than 25 billion, Banks.“Anonymous feedback from our roadshows.” -- Mega-cap: 25 billion and above,Retailing.“Validation via external perception studies.” -- Mega-cap: 25 billion and above,Diversified Financials.“Engage third parties to conduct perception studies and implement the actionable items.”-- Mega-cap: 25 billion and above, Materials.19N I R I A N A LY T I C S M E AS U R I N G YO U R I R PR O G R A M’S S U C C ES S R ES E A R C H R EP O R T
ANALYST COVERAGE“Adding analyst coverage.” -- Micro-cap: Less than 250 million, Automobiles &Components.“Number of new analysts covering the company.” -- Small-cap: 250 million to less than 2 billion, Diversified Financials.“Accuracy of sell-side estimates.” -- Small-cap: 250 million to less than 2 billion,Energy.“Analysts consensus vs. internal review.” -- Small-cap: 250 million to less than 2billion, Real Estate.“Review of sell-side notes to gauge level of understanding of key messages.” -- Midcap: 2 billion to less than 10 billion, Materials.“Accuracy of consensus estimates vs. our guidance.” -- Mid-cap: 2 billion to less than 10 billion, Utilities.“Analyst coverage vs. our peers (both quantity and quality).” -- Mid-cap: 2 billion toless than 10 billion, Banks.“Quantify regular and active dialogue with buyside, sellside and trading desks.” -Mega-cap: 25 billion and above, Transportation.“Sell-side reports and their grasp of our model. Buy-side’s type of questions that signalthe depth of their understanding.” -- Mega-cap: 25 billion and above, Semiconductors& Semiconductor Equipment.20N I R I A N A LY T I C S M E AS U R I N G YO U R I R PR O G R A M’S S U C C ES S R ES E A R C H R EP O R T
NIRI is dedicated to advancing the practiceof investor relations and the professionalcompetency and stature of its members.Connect with us:National Investor Relations Institute225 Reinekers Lane, Suite 560Alexandria, VA 22314703.562.7700www.niri.orgAll contents 2016 National Investor Relations Institute. All rights are reserved and content may not be reproduced,downloaded, disseminated, or transferred, in any form or by any means, except with the written prior agreement of NIRI.
NIRI ANALYTICS MEASURING YOUR IR PROGRAM’S SUCCESS RESEARCH REPORT 11 0.0 0.5 1.0 1.5 2.0 2.5 2.0 1.9 1.7 2.0 2.2 2.4 The top predictor of whether an IRO will use quantitative metrics to measure their IR program’s success, is their use of q