Transcription
Paper SAS655-2017Accessibility and SAS Visual Analytics Viewers:Which Report Viewer is Best for Your Users' Needs?Jesse Sookne, Kristin Barker,Joe Sumpter, and Lavanya Mandavilli, SAS Institute Inc., Cary, NCABSTRACTMany organizations that use SAS Visual Analytics must conform with accessibility requirements such asSection 508, the Americans with Disabilities Act, and the Accessibility for Ontarians with Disabilities Act.SAS Visual Analytics provides a number of different ways to view reports, including the SAS ReportViewer and SAS Mobile BI native apps for Apple iOS and Google Android. Each of these options has itsown strengths and weaknesses when it comes to accessibility—a one-size-fits-all approach is unlikely towork well for the people in your audience who have disabilities. This paper provides a comprehensiveassessment of the latest versions of all SAS Visual Analytics report viewers, using the Web ContentAccessibility Guidelines (WCAG) version 2.0 as a benchmark to evaluate accessibility. You can use thispaper to direct the end users of your reports to the viewer that best meets their individual needs.INTRODUCTIONSAS strives to make all of its products accessible to people with disabilities, so that everyone can accessand benefit from the power of analytics. This paper describes the accessibility of SAS Visual AnalyticsViewer (for the web) and SAS Mobile BI native apps for mobile devices. It makes recommendations thatyou can use to choose the best viewer for your needs, or to direct your users with disabilities to theviewer that best meets their needs.If you are a SAS Visual Analytics system administrator or report creator, your users might already haveasked you whether the reports you deliver are accessible to people with disabilities. And if not, you’relikely to be asked this question in the future, as there are many people around the world with disabilities –probably including some of your users or customers, especially if your organization serves the generalpublic. In the United States alone, around 19% of the population has some form of disability. (UnitedStates Census Bureau)Users with disabilities are a diverse group with diverse needs. For example, the needs of a user withphotosensitive epilepsy, who could have a seizure if rapidly flashing content is shown on screen, are quitedifferent from the needs of a person with Parkinson’s disease, who might not be able to use a mouse, andmust accomplish tasks using just the keyboard. When you consider your users’ needs and suggest thereport viewer most appropriate for them, your users will be able to benefit from the insights in yourreports, avoid frustration, and be more satisfied with their experience.SAS is committed to accessibility. SAS continually strives to improve accessibility of SAS VisualAnalytics Viewer (for the web) and SAS Mobile BI (for mobile devices). This paper provides asnapshot of the accessibility of these products at the time it was written. Continuous andongoing improvements in accessibility will over time close many of the accessibility gapsidentified in this paper.1
AT A GLANCEThe following table is a quick summary of the recommendations made in this paper.Users with Will have the best experience with Cognitive impairments (for example, autism andage-related memory loss)Any of the viewers.Mobility (motor) impairments (keyboard-only users(for example, people with Parkinson’s))SAS Visual Analytics Web ViewerNo (functional) vision (screen reader users)SAS Mobile BI for iOSLow vision (non-screen reader users (for example,people with color deficient vision and presbyopia))SAS Mobile BI for Windowsor SAS Visual Analytics Web ViewerTable 1. Report Viewer Recommendations Based on Users’ NeedsFor more information about these recommendations, read on.THE APPROACH TO ACCESSIBILITY AT SASThe standard for accessibility at SAS is the Web Content Accessibility Guidelines, version 2.0, levels Aand AA. The Web Content Accessibility Guidelines (WCAG), published by the World Wide WebConsortium (W3C), are an industry-standard set of requirements and recommendations for making webcontent accessible to people with disabilities. WCAG 2.0 consists of 61 testable success criteria, dividedinto three levels of conformance: A (lowest), AA, and AAA (highest). Each level includes the levels belowit – AA includes all criteria from level A, and level AAA includes all 61 success criteria. The goal foraccessibility at SAS is for its products to conform at level AA, which includes 38 testable success criteria.SAS also aims to support one success criterion from level AAA – 1.4.6 Contrast Enhanced – becauseSAS believes it’s important.The accessibility work at SAS, as well as in this paper, organizes the 39 WCAG criteria used for testinginto five categories:1. Cognitive and other – covers impairments that reduce a person’s: memory; problem-solving;attention, reading, or verbal comprehension; math comprehension; or visual comprehension(WebAIM). This category also includes photosensitive epilepsy.2. Mobility – covers motor impairments that prevent a person from using a mouse or touch interface,including Parkinson’s disease, quadriplegia, arthritis, and multiple sclerosis3. No Vision – covers vision impairments that prevent a person from using their eyes to interact witha computer or mobile device, and cause a person to instead use a screen reader. (For moreinformation about screen readers, see “Accessibility: No Vision” on page 8.)4. Low Vision – covers vision impairments that reduce a person’s ability to see clearly, distinguishcolors, and so on, including cataracts, color deficiency, and presbyopia. This category does notinclude screen reader use, which is covered in “Accessibility: No Vision” on page 8.5. Hearing / Multimedia – covers criteria related to audio and video content. This category does notapply to SAS Visual Analytics or the report viewers and is not covered in this paper.Note that some of the WCAG criteria could apply to multiple categories – we choose the category that wethink the criteria primary applies to, and include it there. In each section below, we outline which WCAGcriteria are included in that category.THE SUITE OF VIEWERS FOR SAS VISUAL ANALYTICS REPORTSYou can view and interact with SAS Visual Analytics reports in the web-based SAS Visual AnalyticsViewer or using any of the native viewer apps by SAS on mobile devices. If your organization does notyet use SAS Visual Analytics, you can download SAS Mobile BI for free from your favorite app store,2
install it on your mobile device, open the sample reports, and try it yourself. If your organization alreadyuses SAS Visual Analytics, you can use all of the report viewers with your own reports, at no additionalcost.We tested each of these viewers for accessibility using WCAG 2.0 AA as our guide: SAS Visual Analytics Viewer 7.4: the web-based HTML5 report viewer used for viewing SASVisual Analytics reports in a web browser. SAS Mobile BI for iOS (version 8.13): a native app for iOS devices including iPads and iPhones. SAS Mobile BI for Android (version 8.13): a native app for Android devices including tablets,phablets, and mobile phones. SAS Mobile BI for Windows (version 7.32): a native app for Windows 10 devices including tablets,laptops, and desktops.To test SAS Visual Analytics Viewer, we used the Chrome web browser, version 56, running on Windows7. We used JAWS version 18 for our screen reader testing.To test SAS Mobile Bi for iOS, we used an iPad Air 2 running iOS version 10.2.1. We used the built-inVoiceOver screen reader for testing.To test SAS Mobile BI on Android, we used a Nexus 9 tablet running stock Android 7.1. We usedTalkBack version 5.1.0 for screen reader testing.To test SAS Mobile BI for Windows, we used a Lenovo Yoga 3 laptop running Windows 10. We usedJAWS 18 for screen reader testing.TASKS USED IN EVALUATING ACCESSIBILITYIn this paper we’ve identified a number of core tasks that are essential when viewing reports in SASVisual Analytics Viewer or SAS Mobile BI apps. We tested each of the viewers by performing thefollowing user tasks: Add a server connection (mobile apps) Browse for and open a report Navigate within a report (switch pages) View objects in the report Extract information from the objects (view / understand elements within the objects, for example,bars within a bar chart). This applied to the following items:oSimple objects like bar charts and line chartsoComplex objects like crosstabs and scatter plotsoKey performance indicators (KPIs)oGeo maps View report and object information in the Information View Use a filter, including: oFind a filter controloChange the value of the filteroVerify that target objects updateUse a link, including:oFind the link3
oFollow (activate) the linkoReturn to the original locationExport data shown in a report object to an Excel spreadsheet (SAS Visual Analytics Viewer only)ACCESSIBILITY: COGNITIVE AND OTHERRecommendation: For users with cognitive impairments, all of the viewers provide a good experience.SAS Visual Analytics Viewer might provide a slightly better experience for users who are distracted bymoving progress indicators.This category includes these WCAG success criteria: 2.2.2 Pause, Stop, Hide 2.3.1 Three Flashes or Below Threshold 2.4.5 Multiple Ways 3.2.3 Consistent Navigation 3.3.4 Error PreventionThe following table shows which tasks users with cognitive impairments can accomplish in each of theviewers.TaskSAS VisualAnalyticsViewer (webbased)SAS Mobile BIfor iOSSAS Mobile BI forAndroidSAS Mobile BI forWindowsAdd a serverconnectionNot applicableYesYesYesBrowse and openreportYesYes (see below)YesYes (see below)Switch between reportsectionsYesYesYes (see below)Yes (see below)View report objects ineach sectionYesYesYesYesExtract informationfrom report objectsYesYesYesYesAccess report orobject properties inInformation viewYesYesYesYesUse a PromptContainer With FiltersYesYesYes (see below)YesUse a linkYesYesYes (see below)Yes (see below)Export data from areport objectYesNot applicableNot applicableNot applicableTable 2. Which Tasks Can Users with Cognitive Impairments Accomplish in Each of the ReportViewers?ISSUES AND NOTES FOR USERS WITH COGNITIVE IMPAIRMENTSSAS Visual Analytics ViewerNone. To avoid animated progress indicators, users can turn off the “Enable visual effects” setting inSettings Global Accessibility.4
SAS Mobile BI for iOSIn Subscription view, while subscribing to a report, animated spinning progress indicators appear. Thesemight be distracting.SAS Mobile BI for Android When subscribing to a report, an animated progress indicator appears and constantly moves.This happens both in the subscribe window and on the home screen. There is no way for users tostop this animation, which might be distracting. Within reports, spinning animations appear over objects while their content loads or when itupdates. This can occur when initially opening a report, switching sections within a report,changing the value of a filter, or following a link. There is no way for users to disable or stop theseanimations, which might be distracting.SAS Mobile BI for Windows When subscribing to a report, if the user returns to the home screen, an animated progressindicator appears and constantly moves. There is no way for users to stop this animation, whichmight be distracting. When navigating from folder to folder, animated spinners indicate an operation is in progress asthe folder contents load. There is no way for users to stop these animations, which might bedistracting. Within reports, spinning animations appear over objects while their content loads. This can occurwhen initially opening a report, switching sections within a report, or following a link. There is noway for users to disable or stop these animations.ACCESSIBILITY: MOBILITYRecommendation: For users with mobility (motor) impairments, SAS Visual Analytics Viewer, the webbased viewer, provides the best experience. Keyboard-only use is not yet fully supported by SAS MobileBI for Android and Windows. The iOS operating system does not provide support for keyboard-onlyusage, without also enabling either VoiceOver or Switch Control, which alter the way the operatingsystem responds to keyboard input.This category includes these WCAG success criteria: 2.1.1 Keyboard 2.1.2 No Keyboard Trap 2.2.1 Timing Adjustable 2.4.1 Bypass blocks 2.4.3 Focus order2.4.7 Focus Visible 3.2.1 On FocusThe following table shows which tasks keyboard-only users can accomplish in each of the viewers.TaskSAS VisualAnalyticsViewer (webbased)SAS MobileBI for iOSSAS Mobile BIfor AndroidSAS MobileBI forWindowsAdd a server connectionNot applicableNoNoYesBrowse and open reportYesNoNoYes5
TaskSAS VisualAnalyticsViewer (webbased)SAS MobileBI for iOSSAS Mobile BIfor AndroidSAS MobileBI forWindowsSwitch between reportsectionsYesNoNoYesView report objects in eachsectionYesNoNoYesExtract information fromreport objectsDepends onreport contentNoNoNoAccess report or objectproperties in InformationviewYesNoNoYesUse a filterNoNoDepends onreportcontentUse a linkYes withworkaround /depends onreport contentYesNoNoNoExport data from an objectYesNoNot applicableNotapplicableTable 3. Can Users with Motor Impairments Accomplish Core Tasks in Each of the ReportViewers?ISSUES AND NOTES FOR USERS WITH MOTOR IMPAIRMENTSSAS Visual Analytics Viewer Partial keyboard support is available for navigating among elements within report objects. Userscan move focus to elements in charts and see tooltips. Using the Information view can be difficult with only the keyboard. To add comments on anobject, for example, users might need to tab to the object, press Ctrl F6 (or Cmd F6 on aMac) to open the Landmarks dialog box, and select the Comments pane to move focus directly toit, without moving focus to intermediate objects between the desired object and the Commentsview. Unintended scrolling might occur in horizontal or vertical containers when users attempt to movethrough data points in a report object. Slider controls used to adjust dates and times do not respond to adjustment via keyboard arrowkeys. As a workaround, keyboard-only users can enter the desired value in to the edit fieldassociated with the slider directly.6
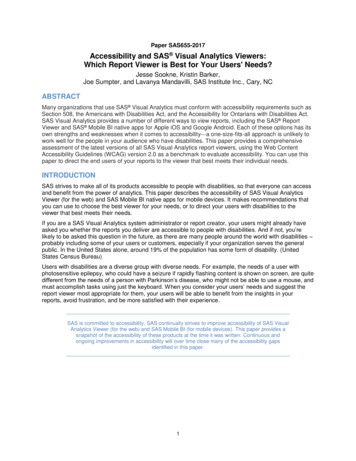
Figure 1. The Information View (on the Right Side of the Image) in SAS Mobile BI for iOS. TheInformation View Shows Information about the Selected Report Object, or about the Report Itself.SAS Mobile BI for iOSThe iOS operating system does not support keyboard-only use without enabling either VoiceOver (whichis covered in “Accessibility: No Vision” on page 8) or switch control. Without one of these two accessibilityoptions enabled, iOS users must interact with the touchscreen to accomplish almost every task. This is acharacteristic of the operating system itself, rather than SAS Mobile BI for iOS. This scenario applieswhen users have a keyboard connected to the mobile device via Bluetooth.SAS Mobile BI for AndroidSAS Mobile BI for Android does not yet support keyboard-only use. While determined users might be ableto accomplish some of the tasks listed above, we do not yet recommend using the app with a keyboard,without also using the touch interface.7
Figure 2. The Table of Contents in SAS Mobile BI for Android (at top). Using the Table of Contents,Users Navigate and Switch between Report Sections.SAS Mobile BI for Windows SAS Mobile BI for Windows does not yet support extracting information from and interacting withelements within objects using only the keyboard. This prevents users from accessing elementssuch as bars within a bar chart, as well as from drilling down or up, following links, and accessingtooltips. Sliders within prompt containers are not supported for keyboard usage.ACCESSIBILITY: NO VISIONUsers with no vision, or no functional vision, use a special type of software called a screen reader. Screenreaders narrate information shown on screen. They also change how users interact with their computer,phone, or tablet, and provide special methods of navigating and exploring interfaces.Recommendation: SAS Mobile BI for iOS is recommended for users with little or no functional visionwho use a screen reader. It provides the best experience for interacting with reports. SAS Mobile BI forAndroid can be an alternative choice. While SAS Visual Analytics Viewer for the web can be used withthe latest versions of JAWS for Windows and the Chrome browser, it is generally less screen readerfriendly than SAS Mobile BI for iOS. SAS Mobile BI for Windows does not yet have mature screen readersupport.This category includes these WCAG criteria: 1.1.1 Non-text Content 1.3.1 Info and Relationships 1.3.2 Meaningful Sequence 1.3.3 Sensory Characteristics 2.4.2 Page Titled 2.4.4 Link Purpose (In Context) 2.4.6 Headings and Labels 3.1.1 Language of Page8
3.1.2 Language of Parts 3.2.2 On Input 3.2.4 Consistent Identification 3.3.1 Error Identification 3.3.2 Labels and Instructions 3.3.3 Error Suggestion 4.1.1 Parsing 4.1.2 Name, Role, ValueThe following table shows which tasks screen reader users can accomplish in each of the viewers.TaskSAS VisualAnalytics Viewer(web-based)SAS Mobile BI foriOSSAS MobileBI for AndroidSAS Mobile BIfor WindowsAdd a server connectionNot applicableYes withworkaroundNoNoBrowse and open reportYes withworkaroundYes withworkaroundNoNoSwitch between reportsectionsYes withworkaroundYesNoNoView report objects in eachsectionYesYesNoNoExtract information fromreport objectsYes withworkaround /depends on reportcontentYes withworkaround /depends on reportcontentNoNoAccess report or objectproperties in Information viewNoYesNoNoUse a filterYes withworkaroundYes withworkaroundNoNoUse a linkYes withworkaroundYes withworkaround /depends on reportcontentNoNoExport data from an objectYes withworkaroundNot applicableNot applicableNot applicableTable 4. Which Tasks Can Users with No Functional Vision (Screen Reader Users) Accomplish inEach of the Report Viewers?ISSUES AND NOTES FOR USERS WITH NO FUNCTIONAL VISIONSAS Visual Analytics ViewerHere are some key exceptions to accessibility for no vision users that apply to SAS Visual AnalyticsViewer: The lang attribute is missing on logon and logoff pages. This might cause screen readers toannounce the contents of these pages incorrectly if a non-English locale, operating system, orscreen reader is used.9
The recent reports list on the landing page is not screen reader-accessible. Screen reader userscan browse for reports, though the structure of the browse dialog box might be somewhatconfusing. JAWS announces incorrect hints on how to interact with section tabs, and to switch sections in areport. With the virtual PC cursor off, users should press the arrow keys to move focus from tab totab and press the spacebar to select a tab and switch to that section. Screen reader users cannot yet access elements within report objects in SAS Visual AnalyticsViewer itself. While this paper was being written, SAS was in the process of adding basic supportfor screen reader users to access report objects. SAS plans to include this support in futurereleases. In addition, while this paper was being written, SAS released the SAS GraphicsAccelerator – a major step forward in making charts and graphs accessible. This release includeda technical preview of integration between SAS Visual Analytics Viewer and SAS GraphicsAccelerator. Users can now explore simple SAS Visual Analytics charts and graphs using sound.See the Looking Forward section later in this paper for more information. Users cannot perceive relationships between elements within report objects via a screen reader.For example, screen reader users will not be able to distinguish a bar in one group from a bar inanother group within a bar chart. Selecting an object and reading its properties (in the Information view) with a screen reader,though not impossible, is difficult. JAWS users can tab to the Information button (after all reportobjects in the tab order), activate it, and then shift-tab back to the desired report object to movefocus to it, which will display its properties. Then, using the Virtual PC cursor, JAWS users canmove forward until they come to the properties of the selected object. This might be difficultenough that many screen reader users will not be able to follow these steps. Names, labels, or instructions for some filter controls might be incorrect. For example, JAWSgives incorrect interaction hints for Button Bar controls. To interact with a Button Bar (announcedas a segmented button by JAWS), with the Virtual PC cursor off, tab to the control. Use arrowkeys to move focus from one segment to another. Use spacebar to select or deselect a segment. Screen reader users might have difficulty using Slider controls. Sliders might not be labeled in away that makes them easy to understand, and some sliders might not respond well to adjustingthe value using arrow keys. Screen reader users might find it easier to enter values directly byusing the edit fields included in sliders. In order to find these edit fields, it might be necessary totab past them, and then shift-tab back to them. Tabbing past the slider and shift-tabbing backthrough it might help. When filters values are changed such that objects update, screen reader users are typicallyinformed via an announcement of the number of objects that were updated. This message will notoccur if filters are within a prompt container, so screen reader users might not realize that objectshave updated. It might be difficult for screen reader users to understand the list of options present in a dropdown list component used as a filter, because screen readers might repeat option names multipletimes. The name of the Back button (in the report toolbar, above the report objects) doesn't clearlydescribe its purpose after you follow a section link. The button takes users back to the sectionthey were viewing before they followed the link. The name of the button is just the report name,plus the name of the previously viewed section, which might be confusing. Presentation is used to convey the structure of the breadcrumb that appears in report objectswhen you drill down into a hierarchy. Screen reader users are not notified (that is, don't hear confirmation) of drill down or drill upactions.10
In the Export Data dialog box, some labels are not programmatically associated with their fields orcontrols. Screen reader users might find it difficult to understand this dialog box. JAWS users canexport data from an object by following these steps:1. With the Virtual PC cursor off, tab to move focus to the desired report object.2. Tab forward once to reach the object toolbar.3. Use arrow keys to move focus to the Export data button in the toolbar. Press Enter toactivate it.4. Tab to the OK button. Press Enter to activate it. This will immediately begin downloadingall of the raw data from the selected report object, in Excel format. Within the Export Data dialog box, when there is an invalid entry in the Rows field, if the user tabsaway and tabs back, the error message is no longer communicated via the screen reader.Figure 3. The Export Data Dialog Box in SAS Visual Analytics Viewer11
Figure 4. SAS Mobile BI for iOS Showing a Report Section with Report Objects That Filtered byAccessories in the Button Bar at the Top.SAS Mobile BI for iOS When adding a server connection, in the Add Connection dialog box, labels are notprogrammatically associated with their corresponding fields. VoiceOver users can move theVoiceOver cursor to field labels, immediately followed by their corresponding fields. This lack ofassociation might make it difficult for VoiceOver users to add a connection. When adding a server connection, in the Add Connection dialog box, users can enter text in afield and press Enter to move to the next field. When users do this, VoiceOver does not announceinformation for the next field, which can be confusing. Instead of pressing Enter, VoiceOver userscan swipe to move to the next field. When browsing for reports in Library view, the structure of the interface might be confusing. Thehierarchical structure of the folders, shown visually in columns, might not be easy for screenreader users to understand. It might be helpful for screen reader users to know that the foldersare presented in columns, with the root folder at the left. As you drill in, child folders are displayedin columns to the right. After subscribing to a report, in the report preview window, the VoiceOver cursor returns to theBack button instead of to the report, which can be confusing. When viewing a report, the open / closed state of the table of contents pane is not communicatedto VoiceOver users. This might make using the table of contents pane confusing. When accessing data elements in a list table, the VoiceOver cursor might land on the maximizeicon. VoiceOver users might need to swipe forward several times to access the data elements inthe table. When accessing tooltips for cells in a crosstab, the tooltip might appear in the wrong location,below the crosstab, if VoiceOver is enabled. The tooltip still works normally. Selecting points within geo maps might not work well with VoiceOver.12
Legend information for charts is not screen-reader accessible. Users cannot inspect the legend inthe right pane of the app when viewing a report. Some of the information present in the legend isavailable to screen reader users through announcements on data elements (bars, points, and soon) within report objects. VoiceOver users might have trouble scrolling through options within a drop-down list, if the controlcontains many options. While users can move through options one-at-a-time using the singlefinger flick left / right gesture, the three-finger swipe up / down gesture might not work to scroll apage at a time. VoiceOver users might have difficulty adjusting sliders in increments that are granular enough tofilter objects as desired. For example, when using a slider to filter another object by a date range,VoiceOver users might find it difficult to adjust the range by a single day. Swiping up or down toadjust the value might increment by larger amounts that desired. VoiceOver users might getbetter results using the double-tap-and-hold-then-drag gesture to adjust the value. VoiceOver users cannot view tooltips on or follow links from image objects. When VoiceOver users follow links that open Info windows, the VoiceOver cursor does not moveto within the Info window. Users will need to swipe or touch within the Info window to move focusto it before interacting with its contents.SAS Mobile BI for AndroidSAS Mobile BI for Android does not yet support screen reader use. While determined users can likelyaccomplish many of the tasks listed above, we do not yet recommend using the app with TalkBack.SAS Mobile BI for WindowsSAS Mobile BI for Windows does not yet support screen reader use. SAS plans to add support for screenreader use in future releases.ACCESSIBILITY: LOW VISIONUsers with low vision are a diverse group that includes people with color deficient vision (also known ascolor blindness), presbyopia (age-related loss of near vision), cataracts, and so on. (NEI)This category includes these WCAG criteria:1.4.1 Use of Color (only)1.4.3 Minimum Contrast1.4.4 Resize Text (Zooming)1.4.5 Images of Text1.4.6 Contrast Enhanced (High Contrast Theming)For users with low vision, their specific needs determine the report viewer that is best suited for them.Users who Will have the best experience with Have color deficient vision(color blindness)Any of the viewers. Some report object types only distinguish oneelement from another using color see note below).Users can accomplish all of the tasks listed in this paper, depending onreport design. If a report includes objects that only support distinguishingbetween elements via color, then users with color deficient vision mightnot be able to extract information from those objects.Need a high contrastdisplaySAS Mobile BI for Windows or SAS Visual Analytics Viewer. For the bestexperience, report authors should save a copy of their report using thehigh contrast report theme, and direct users to that copy. Users will then13
Users who Will have the best experience with have the best experience using SAS Mobile BI for Windows, paired withone of the Windows OS high contrast themes.In this scenario, users who need high contrast display will be able toaccomplish all tasks listed in this paper, with the possible exception ofextracting information from certain report objects (for example, geomaps, stored process objects, and web content objects).If users must view a report that uses a regular report theme, SAS VisualAnalytics Viewer might provide the best experience, as it supportsoverriding the report theme and forcing a high contrast display of thereport. (See below for details.) However, when paired with the Chromebrowser, SAS Visual Analytics Viewer displays the parts of the interfacethat do not vary from report to report using a regular theme (not highcontrast).In this scenario, users might have trouble browsing for and openingreports, switching sections, and viewing report or object properties. Theyshould be able to accomplish other tasks listed in this paper, with thepossible exception of extracting information from certain report objects(for example, geo maps, stored process objects, and web contentobjects).Need increased text sizeSAS Mobile BI for Windows or SAS Visual Analytics Viewer. SAS MobileBI for Windows respects Windows operating system-based displayscaling for increased font size. SAS Visual Analytics Viewer has goodsupport for browser-based zoom.Users can accomplish all of the tasks listed in this paper using either ofthe options above.Table 5. Which Report Viewer Is Most Appropriate for Users with Low Vision?ISSUES AND NOTES FOR USERS WITH LOW VISI
uses SAS Visual Analytics, you can use all of the report viewers with your own reports, at no additional cost. We tested each of these viewers for accessibility using WCAG 2.0 AA as our guide: SAS Visual Analytics Viewer 7.4: the web-based HTML5 report viewer used for viewing SAS Visual Anal