Transcription
11-1Chapter 11 Density of States,Fermi Energy and EnergyBandsContentsChapter 11Density of States, Fermi Energy and Energy Bands . 11-1Contents . 11-111.1 Current and Energy Transport . 11-111.2 Electron Density of States . 11-2Dispersion Relation . 11-2Effective Mass . 11-3Density of States . 11-511.3 Fermi-Dirac Distribution . 11-711.4 Electron Concentration . 11-811.5 Fermi Energy in Metals . 11-9EXAMPLE 11.1 Fermi Energy in Gold . 11-1111.6 Fermi Energy in Semiconductors. 11-12EXAMPLE 11.2 Fermi Energy in Doped Semiconductors . 11-1311.7 Energy Bands . 11-1411.7.1Multiple Bands . 11-1511.7.2Direct and Indirect Semiconductors. 11-1611.7.3Periodic Potential (Kronig-Penney Model) . 11-17Problems . 11-24References. 11-2411.1 Current and Energy TransportThe electric field E is interfered with two processes which are the electric current density j andthe temperature gradient T . The coefficients come from the Ohm’s law and the Seebeck effect.The field can be written as
11-2Ε j T(11.1)where is the electrical conductivity and is the Seebeck coefficient.The heat flux (thermal current density) q is also interfered with both the electric field Ε and thetemperature gradient T . However, the coefficients are not readily attainable. Thomson in 1854arrived at the relationship assuming that thermoelectric phenomena and thermal conduction areindependent. Later, Onsager [1] supported that relationship by presenting the reciprocal principlewhich was experimentally verified. The heat flux can be written asq Tj k T(11.2)where k is the thermal conductivity consisting of the electronic and lattice (or phonon)contributions to the thermal conductivity ask k e kl(11.3)In this chapter, only the electronic contribution to the total thermal conductivity is used.qe Tj ke T(11.4)We consider a one-dimensional analysis in this chapter because most thermoelectric devicesreasonably holds one-dimension, so that tensor notations are avoided.11.2 Electron Density of StatesDispersion RelationFrom Equation (10.16) (combining the Bohr model and the de Broglie wave), we have hp(11.5)This is known as the de Broglie wavelength. Using the definition of wavevector k 2 / , we have
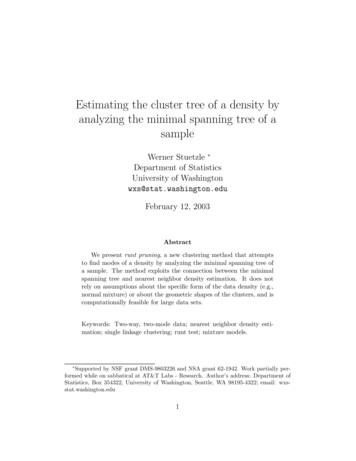
11-3k p (11.6)Knowing the momentum p mv, the possible energy states of a free electron is obtainedE 1 2 p 2 2k 2mv 22m 2m(11.7)which is called the dispersion relation (energy or frequency-wavevector relation).Effective MassIn reality, an electron in a crystal experiences complex forces from the ionized atoms. We imaginethat the atoms in the linear chain form the electrical periodic potential. If the free electron mass mis replaced by the effective mass m*, we can treat the motion of electrons in the conduction bandas free electrons. An exact defined value of the wavevector k, however, implies completeuncertainty about the electron’s position in real space. Mathematically, localization can bedescribed by expressing the state of the electron as a wave packet, in other words, a group velocity.The group velocity of electrons in Figure 11.1 is the slope of the dispersion relation.vg k(11.8)Since the wavelength is twice the lattice constant a, the boundaries at the zone in k-space is k /a. The frequency associated with a wavevector of energy E isE and k p where the two equations are known as the Planck-Einstein relations.(11.9)
11-4Figure 11.1 Dispersion relation of a group of electrons with a nearest neighbor interaction. Notethat is linear for small k, and that k vanishes at the boundaries of the Brillouin zone (k /a)vg 1 E k(11.10)The derivative of Equation (11.10) with respect to time is vg t 1 2 E 1 2 E k k t k 2 t(11.11)From Equation (11.9), we have mvg k and m vg t k t . The force acting on the groupof electrons is thenF m vg t k t(11.12)Combining Equations (11.11) and (11.12) yields vg 2F 2 E k 2 t(11.13)This indicates that there is an effective mass m*, which will replace the electron mass m.11 2E m 2 k 2(11.14)
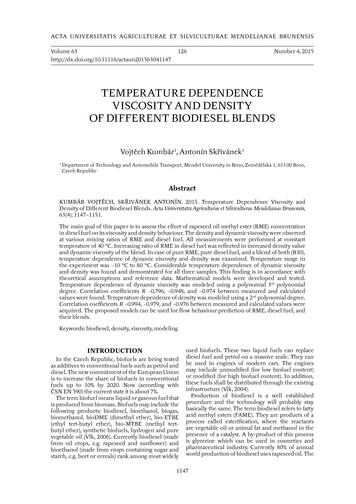
11-5The effective mass m* is the second order of derivative of energy with respect to wavevector,which is representative of the local curvature of the dispersion relation in three dimensional space.The effective mass is a tensor and may be obtained experimentally or numerically.Density of StatesThermoelectric materials typically exhibit the directional behavior. Therefore, in general we haveE 2 2 k x2 k y k z2 2 mx m y mz (11.15)where mx, my, and mz are the principal effective masses in the x-, y-, z-directions and here k is themagnitude of the wavevector.k 2 k x2 k y2 k z2(11.16)This represents the surface of a sphere with radius k in k-space. We introduce a new wavevectorsk and an effective mass m as 2 k 2 2E k x 2 k y2 k z 22m 2m (11.17)Equating Equations (11.15) and (11.17), we have a relationship between the original wavevectorand the new wavevector askx mxk x , k y m myk y , and k z m mzk z m (11.18)In Figure 11.2, we have the volume of a thin shell of radius k and thickness dk.dk dk x dk y dk z mx m y mzmx m y mzdk x dk y dk z 4 k 2 dk 33m m (11.19)The volume of the smallest wavevector in a crystal of volume L3 is (2 /L)3 since L is the largestwavelength. The number of states between k and k dk in three-dimensional space is then obtained(see Figure 11.2)
11-6N k dk 2 4 k 2 2 L 3mx m y mzdk m 3(11.20)where the factor of 2 accounts for the electron spin (Pauli Exclusion Principle). Now the densityof states g(k) is obtained by dividing the number of states N by the volume of the crystal L3.g k dk k 2 mx m y mzdk m 32(11.21)(a)(b)Figure 11.2 A constant energy surface in k-space: (a) three-dimensional view, (b) lattice pointsfor a spherical band in two-dimensional view.From Equation (11.17), we havek 2m 2E 1(11.22)Differentiating this givesdk 2m 2 EdE2 1(11.23)Replacing this into Equation (11.21), m is eliminated. The density of states per valley is finallyobtained as
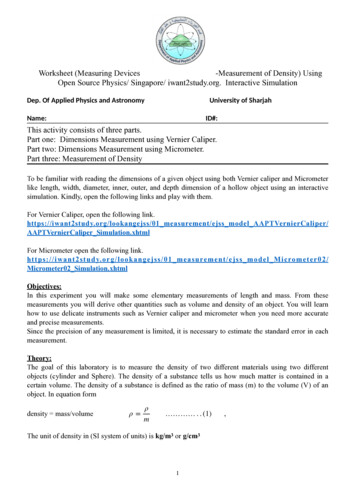
11-71 2m g E 2 2d2 3 2 12 E (11.24)wheremd mx m y mz 31(11.25)which is called the density-of-states effective mass, and mx, my, and mz are the principal effectivemasses in the x-, y-, z-directions. Most actual band structures for semiconductors have ellipsoidalenergy surfaces which require longitudinal and transverse effective masses in place of the threeprincipal effective masses (Figure 11.3). Therefore, the density-of-states effective mass isexpressed as md ml mt2 13(11.26)where ml is the longitudinal effective mass and mt is the transverse effective mass.(a)(b)Figure 11.3 Constant electron energy surfaces in the Brillouin zones (space or k-space): (a) aspherical band such as GaAs; (b) an ellipsoidal band such as Si. Si has six identical conductionbands.11.3 Fermi-Dirac DistributionAlthough the classical free electron theory gave good results for electrical and thermalconductivities including Ohm’s law in metals, it failed in certain other respects. These failure waseliminated by having the free electron obeys the Fermi-Dirac distribution.The ground state is state of the N electron system at absolute zero. What happens as thetemperature is increased? The solution is given by the Fermi-Dirac distribution. The kineticenergy of the electron increases as the temperature is increased: some energy levels are occupied
11-8which were vacant at absolute zero, and some levels are vacant which were occupied at absolutezero (Figure 11.4). The Fermi-Dirac distribution fo gives the probability that an orbital at energyE will be occupied by an ideal electron in thermal equilibrium.f o E 1e E EF kBT 1(11.27)Figure 11.4 Fermi-Dirac distribution at the various temperatures.11.4 Electron ConcentrationThe electron concentration n in thermal nonequilibrium is expressed as n g E f E dE(11.28)0where f(E) is the temperature-dependent occupation probability in thermal nonequilibrium. Itbecomes the Fermi-Dirac distribution fo(E) in thermal equilibrium as shown in Equation (11.27),which becomes unity at absolute zero when E is less than EF, and zero when E is greater than EF(Figure 11.5). The electron concentration n in thermal equilibrium is
11-9 n g E f o E dE(11.29)0Using Equations (11.24) and (11.27), the electron concentration n in thermal equilibrium is1 2m n 2 2d2 31 2 E2 E EF kBT dE 1 0e(11.30)11.5 Fermi Energy in MetalsThe Fermi-Dirac distribution implies that at absolute zero (in the ground state of a system) thelargest Fermions (electrons, holes, etc.) are filled up in the density of states, of which the energyis often called the Fermi energy (Figure 11.5), but here we specifically redefine it as the Fermienergy at absolute zero. So that the Fermi energy is temperature-dependent quantity. It issometimes called the Fermi level or the chemical potential. In general, the chemical potential(temperature dependent) is not equal to the Fermi energy at absolute zero. The correction is verysmall at ordinary temperatures (under an order of 103 K) in ordinary metals.Figure 11.5 Electron concentration n is given by the area under the density of states curve up tothe Fermi energy EF. The dashed curve represents the density of filled orbitals at a finitetemperature. The electrons are thermally excited from region 1 to region 2.The largest number of states N can be defined when a sphere of Fermi radius kF is divided by thesmallest volume (2 /L)3 in k-space (see Figure 11.2 (a)).
11-1042 k F3N 3 3 2 L (11.31)where the factor of 2 accounts for the Pauli Exclusion Principle. Since the crystal volume isdefined as V L3, the Fermi wavevector is13 3 N 3 2 nk F V 2 13(11.32)where N/V is the electron density (or electron concentration) n at the Fermi surface, which can beobtained from the lattice points, the lattice constant and the mass of the atom (n is usually a greatnumber of about 1022 cm-3). The Fermi wavevectors form the Fermi surface, which separates theoccupied from the unoccupied levels. The Fermi surface is one of the fundamental constructionsin the modern theory of metals; in general it is not spherical. The Fermi energy isEF 23 2 n2m 23(11.33)or the electron concentration n is2 2m m 2n EF3 2 3312(11.34)This can be also obtained by integrating Equation (11.30) from zero to EF with f o 1 for E EF k BT 0 in most metals. The Fermi velocity at the Fermi surface isvF k F 3 2 nmm 13(11.35)For metals, the Fermi velocity is an order of 108 cm/s. This is a substantial velocity (about 1 percentof the speed of light). From the view point of classical statistical mechanisms, this is quite asurprising result, for we are describing the ground state (T 0), and all particles in a classical gashave zero velocity at T 0 (classical equipartition energy 1/2mv2 3/2kBT). The Fermi velocity isonly an approximation to the average electron velocity; this approximation works best in metalsand in heavily doped semiconductors. The electron mean free path can be approximated by
11-11 v F (11.36)where is the relaxation time. The mean free path is a measure of the average distance betweensuccessive scattering events. The relaxation time is the average time between successive collisions.The wavelength of electrons may be estimated by the de Broglie expression. h 2 p mv F(11.37)EXAMPLE 11.1 Fermi Energy in GoldA gold crystal has an fcc lattice with one gold atom per lattice point and a lattice constant of 4.08Å. Every gold atom has one valence electron. Estimate the electron Fermi energy, Fermi velocityand electron wavelength in a gold crystal.Solution:We assume that the electron effective mass in gold is identical to that of free electrons. For an fcclattice, there are four lattice points and thus four valence electrons. Consequently, the electronnumber density isn Lattice points4 5.89 1022 cm 333 8(Lattice constant)4.08 10 cm From Equation (11.33), using h 6.6021 10 34 Js , h 2 , me 9.10939 10 31 kg , and1eV 1.602 1019 J ,EF 23 2 n2m 23 8.84 10 19 J 5.52eVThe Fermi velocity isvF 1 k F 3 2 n 3 1.39 106 m/smmThe electron wavelength is estimated by
11-12 h 2 0.522 10 9 mp mvFComments: We give the number of density in terms of cm-3 because such a unit is commonly usedin semiconductors. Typical dopant levels for silicon-based semiconductor devices are 1017 – 1019cm-3, which is much smaller than those in metals.11.6 Fermi Energy in SemiconductorsIn semiconductors, we usually have E EF k BT 1, and then exp E EF k BT becomesmuch greater than 1. Therefore, eliminating one we havef o E 1e E EF kBT E EF exp 1k BT (11.38)The electron concentration n in equilibrium from Equation (11.30) is1 2md n 2 22 3 E E 2 12 dE E exp FkT 0 B (11.39)This can be solved using Gamma function. The electron concentration n in single band is reducedto (this is known as the Boltzmann approximation)3 E m k T 2n N v 2 d B 2 exp F 2 k BT (11.40)where Nv is the degeneracy (number of bands or valleys having the same band edge energy andthe same wavevector). For example, Si has the degeneracy of six valleys (see Figure 11.3). Solvingfor EF, we have nEF k BT ln 2Nv 3 md k BT 2 2 2 (11.41)In typical semiconductors, the Fermi energy EF may be below the conduction band edge EC. Theband gap Eg is the difference between EC and EV, which is usually much larger than kBT as shownin Figure 11.6. The electron concentration n is the shaded area under the density of states curve
11-13and the Fermi energy at room temperature. Note that the Fermi energy greatly affects the electronconcentration n in the conduction band, which is much smaller than that of a metal (Figure 11.5).Figure 11.6 Electron concentration n in a semiconductor is given by the area under the density ofstates curve and the Fermi energy EF at room temperature. The Fermi energy EF is located underthe minimum of conduction band. The dashed curve represents the density of filled orbitals at afinite temperature.EXAMPLE 11.2 Fermi Energy in Doped SemiconductorsSilicon is widely used semiconductor material, and it is often doped with phosphorus to form ann-type semiconductor. Determine the Fermi energy of an n-type semiconductor doped withphosphorus with an electron concentration of 1017 cm-3 at 300 K, assuming that every phosphorusatom contributes one free electron to the conduction band and neglecting thermally excitedelectrons from the valence band. Si has six identical conduction bands with an effective mass equalto 0.33m, where m is the free electron mass.Solution:Silicon has six identical conduction bands (Figure 11.3). When counting all six bands (Nv 6),Equation (11.40) is written as
11-143 E m k T 2n N v 2 d B 2 exp F 2 k BT Taking n 1017 cm-3, we can find the Fermi energy as3 n md k BT 2 EF k BT ln 2 2N2 v 3 2 23 10 0.33 9.1 10 31 1.38 10 23 300 23 1.38 10 300 ln 0.146eV2 2 6 2 6.626 10 34 2 Comments: The negative sign means that the Fermi energy is below the conduction band edge.The silicon bandgap at room temperature is 1.12 eV. Thus the Fermi energy is within the bandgap. In fact, only in this case, the Boltzmann approximation we used in Equation (11.40) isapplicable because the electron energy inside the conduction band, minus the Fermi energy, ismuch greater than kBT ( E EF k BT 1). If the Fermi energy is close to the band edge or fallsinside the conduction band, which is the case when the semiconductors are heavily doped, we needto carry out numerical integration with the Fermi-Dirac distribution.The value of the Fermi energy needs a reference point. Equation (11.39) indicates that thereference is the conduction band edge at zero energy, which is shown in Figure 11.6.11.7 Energy BandsThe free electron model of metals gives us good insight into the electrical conductivity andelectrodynamics of metals. But the model fails to help us with other questions, for example therelation of conduction electrons in the metal to the valence electrons of free atoms and manytransport properties. Every solid contains electrons. The important question for electricalconductivity is how electrons respond to an applied electric field. We shall see that electrons incrystals are arranged in energy bands separated by regions in energy for which no wavelikeelectron orbits exist. Such forbidden regions are called energy gaps or band gaps (𝐸𝐺 ) which areshown in Figure 11.7, wherein the differences between a metal, a semiconductor and an insulatorare summarized schematically.The crystal behaves as an insulator if the allowed energy bands are all either filled or empty,for then no electrons can move in an electric field. The crystal behaves as a metal if one or morebands are partly filled. The crystal is a semiconductor or semimetal if one or two bands are slightlyfilled or slightly empty.
11-15To understand the difference between insulators and conductors, we must extend the freeelectron model to take account of the periodic lattice of the solid. The possibility of a band gap isthe most important new property that emerges.Figure 11.7 Energy level diagrams for a metal, a semiconductor, and an insulator. Metals have apartly occupied band (shaded). For semiconductors and insulators, the Fermi level lies betweenthe occupied valence band and the unoccupied conduction band.11.7.1Multiple BandsThere may be two separate bands: a conduction band for electrons and a valence band for holesas shown in Figure 11.8 (a). In many semiconductors such as Si and PbTe, there may be alsomultiple bands that have the same energy levels, whereby it is called degeneracy. The heavy andlight holes are degenerate and the split-off hole in the valence band is slightly off the valenceband edge (maximum).
11-16EEConduction BandECConduction Band0ECkEgk0EgEVEVHeavy HoleLight HoleValence BandValence Band(a)Split-off Hole(b)Figure 11.8 Band structures of a semiconductor including the conduction band and the valencebands. (a) A model of a conduction band and a valence band, and (b) a model of multiple bands.11.7.2Direct and Indirect SemiconductorsThe type of band gap in semiconductors is important for the selection of material for manyelectronic devices including thermoelectric devices, solar cells and lasers. There are two types ofband gaps in semiconductors, which are direct and indirect band gap. The energy E of a particleis always associated with a wavevector k (or momentum), which implies that, for any transitionbetween bands, both energy and momentum must be conserved. When an electron absorbs enoughenergy to exceed the energy gap Eg, the electron can jump from the valence band into theconduction band. The source of the energy could be photons, phonons, or electric field.In direct band gap semiconductors, such as GaAs, the maximum and minimum of energyversus momentum relationship occur at the same value of the wavevector (Figure 11.9 (a)).In indirect band gap semiconductors like Si and Ge, the maximum and minimum of the energyversus momentum relationship occurs at different wavevectors, which is pictured in Figure 11.9(b). In this case, the electron cannot directly jump into the conduction band, but once the electronat the valence band edge EV absorbs energy (photon, phonon, or electric field) and reaches theenergy level of the conduction band edge EC across the energy band Eg, it can indirectly jumpinto the conduction band with the aid of phonon energy because phonon usually exists anyway.
11-17EcEEcEgEgkEvEv(a)(b)Figure 11.9 Energy versus wavevector diagrams in (a) direct bandgap and (b) indirect bandgapsemiconductors.Direct and indirect gap semiconductors have major differences in their optical properties. Directband gap semiconductors are more efficient photon emitters, semiconductor lasers are made ofdirect gap semiconductors such as GaAs, whereas most electronic devices includingthermoelectric devices are built on indirect semiconductors.11.7.3Periodic Potential (Kronig-Penney Model)So far we have dealt with a free electron. In fact the electron in a crystal experiences a periodicpotential which is along a line of the ionized atoms. Assuming one-dimensional lattice with thelattice constant a as shown in Figure 11.10 (a), resembling the individual atomic potentials as theatom is approached closely and flattening off in the region between atoms. We approximate thisby a square periodic potential in Figure 11.10 (b) as introduced by Kronig and Penney.
11-18U(x)xa0(a)U(x)(b)-(a b)-b0U0a (a b)xFigure 11.10 One-dimensional periodic potential energy model. (a) Sketch of potential model,and (b) Kronig-Penney model.The Schrodinger equation for the wavefunction is then 2 2 U x E 02m x 2(11.42)The potential distribution is given by 0 for 0 x aU x U 0 for b x 0(11.43)Subject to the following periodicity requirementU x a b U x (11.44)The general solution for Equation (11.42) are Ae iKx Be iKx 0 x a (11.45) CeQx De Qx -b x 0 (11.46)where
11-19E (11.47) 2 K 2 2Q 2and U 0 E 2m2mAnd K and Q are to be determined, from which the eigen energy E of the electron inside such aperiodic potential is to be extracted.Four boundary conditions are needed to determine the unknown coefficient A, B, C, and D. Wecan use the continuity of the wavefunction and its derivative at x 0, which givesA B C D(11.48)iK A B Q C D (11.49)Two more boundary conditions are necessary to determine the four unknown coefficients. Due tothe periodicity in the potential, the wavefunction at any two points separated by a lattice vector isrelated through the Bloch theorem in the x-direction, x a b x eik a b (11.50)We should distinguish the wavevector k from the propagation vector of the solution K in Equation(11.45). The latter contains the energy of the electrons that we want to find. We want to find arelation between k and E, which is equivalent to a relation between k and K. The continuityrequirements for the wavefunction and its derivative at x a are then Ae iKa Be iKa Ce Qb DeQb eik a b iK Ae iKa Be iKa Q Ce Qb DeQb eik a b (11.51)(11.52)Four equations with four unknowns have a solution only if the determinant of the coefficientsvanishes, yieldingQ2 K 2sinh Qb sin Ka cosh Qb cos Ka cos k a b 2 KQ(11.53)It is rather tedious to obtain this equation. The result is simplified if we represent the potential bythe periodic delta function obtained when we pass to the limit b 0 and U 0 in such a way thatQ 2ba 2 P , a finite quantity. In this limit Q K and Qb 1. Then, Equation (11.53) reducesto
11-20𝑃𝑠𝑖𝑛(𝐾𝑎) 𝑐𝑜𝑠(𝐾𝑎) 𝑐𝑜𝑠(𝑘𝑎)𝐾𝑎(11.54)The range of K for which this equation has solutions are plotted in Figure 11.11, for the case P 3 /2. We can convert the solution for K into energy, and redraw the graph as a function of ka asshown in Figure 11.12. The figure shows that, for each wavevector k, there are multiple values forthe electron energy E.EForbidden region 10p2p3p 4pKa-1Figure 11.11 Left-hand side of Equation (11.54) as function of Ka. Because the right-hand side isalways less than or equal to one, there are regions (the shaded area) where no solution for Kaexists, and thus no electrons exist with energy corresponding to the values of K in these regions.The electron energy forms quasi-continuous bands (because k itself is quasi-continuous)separated from each other by a minimum gap that occurs at ka s (s 0, 1, 2, ), or k s /a, at which the right-hand side of Equation (11.54) is 1. Figure 11.12 (b) implies that there aremultiple values of k for each E. However, the Bloch theorem says that wavefunctionscorresponding to the wavevectors k separated by m(2 /a) (since b 0) are identical, they are thesame quantum state and should be counted only once. Thus, rather than plotting the energyeigenvalues for all the wavevectors, we can plot them in one period, as shown in Figure 11.13.This way of representation is called the reduced-zone representation. The relationship betweenthe energy and the wavevector is the dispersion relation.
11-21E2p3ppaaa(a)pa0k2pa4pa3paEEnergy gapEnergy Gap-(b)4pa-3p2paa-pa0pa2pa3pa4pakFigure 11.12 (a) Parabolic energy curves of a free electron in one dimension, periodicallycontinued in reciprocal space. The periodicity in real space is a, and (b) extended zone: splittingof the energy parabola at the boundaries of the first Brillouin zone. The energy gaps areforbidden regions. The solid lines from Kronig-Penney model.
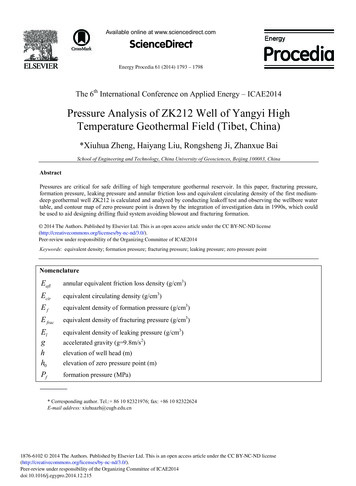
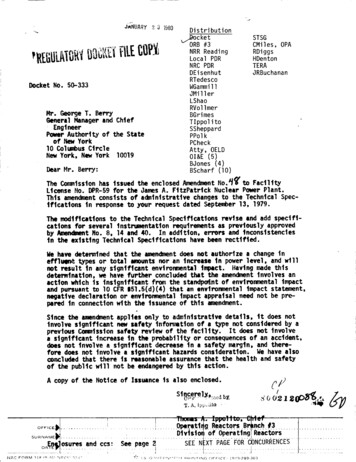
11-22Band 5Band 4Band 3Band 2Band 1-pa0paFigure 11.13 The solid lines show the energy bands in the reduced zone. The free electrondispersion relations are shown as dashed lines.The ab initio calculated electronic band structure using the density functional theory (DFT)depicted in Figure 11.14 shows the indirect energy gap and the threefold degeneracy of the valenceband at the Fermi energy. It is seen that the approximate sum of the energy bands for a specificenergy level in Figure 11.14 (a) corresponds to the density of states for the energy level in Figure11.14 (b). From this approach, we can estimate the effective mass using Equation (11.14) that isthe second derivative of energy with respect to wavevector. Also we obtain the band gap from thefigure.
11-23(a)(b)Figure 11.14 (a) Electronic band structure of Mg2Si calculated with the density functional theory(DFT), and (b) total electron density of states (DOS) projected on magnesium and silicon atoms,the solid line for total DOS, the dashed line for silicon contribution, and the dot-dashed line formagnesium contribution. Boulet at al. (2011)
11-24Problems11.1 A copper crystal has an fcc lattice with one Cu atom per lattice point and a lattice constantof 3.61 Å. Every copper atom has one valence electron. Estimate the electron Fermienergy, Fermi velocity and electron wavelength in a copper crystal.11.2 Derive Equation (11.33) by using Equation (11.30).11.3 Germanium Ge is widely used semiconductor material, and it is often doped with As to forman n-type semiconductor. Determine the Fermi energy of an n-type semiconductor dopedwith As with an electron concentration of 1019 cm-3 at 300 K. Assume that every As atomcontributes one free electron to the conduction band and neglect thermally excited electronsfrom the valence band. Ge has 4 identical conduction bands with an effective mass equal to0.55m, where m is the free electron mass.11.4 PbTe is widely used semiconductor material, and it is often doped with Na to form an n-typesemiconductor. Determine the Fermi energy of an n-type semiconductor doped with Na withan electron concentration of 1018 cm-3 at 300 K, assuming that every Na atom contributesone free electron to the conduction band and neglecting thermally excited electrons from thevalence band. PbTe has 4 identical conduction bands with an effective mass equal to 0.22m,where m is the free electron mass.11.5 Describe the important concept of the band structures.11.6 Describe briefly the important concept and results of the Kronig-Penney model.References1.Onsager, L., Reciprocal Relations in Irreversible Processes. I. Physical Review, 1931. 37(4): p. 405426.
11-3 ! p k (11.6) Knowing the momentum p mv, the possible energy states of a free electron is obtained m k m p E mv 2 2 2 1 2 2 ! (11.7) which is called the dispersion relation (energy or frequency-wavevector relation). Effective Mass In reality, an electron in a c