Transcription
ACCESS for ELLsInterpretive Guidefor Score ReportsGrades K–12SPRING 2022UNDERSTANDING STUDENT SCORES
ContentsACCESS for ELLs . 2Understanding Scores . 2ACCESS for ELLs Score Reports . 3Individual Student Report . 3Student Roster Report . 3Frequency Reports . 3Individual Student Scores . 4Domain Scores. 4Composite Scores . 7Kindergarten Scores . 8Interpreting Student Scores . 8Understanding Student Growth . 9Group Scores . 10Student Roster Report . 10Frequency Reports . 11Proficiency Level Descriptors (Grades 1–12) . 12Proficiency Level Descriptors (Kindergarten) . 16Reading the ACCESS for ELLs Individual Student Report . 18This document helps educators understand what students’ ACCESS for ELLs scores mean andwhat to do with that information. It also introduces some of the tools available to programcoordinators and district administrators interested in reviewing and taking action on groupperformance on ACCESS for ELLs.This document presents WIDA recommendations for interpreting and using test scores.State and district policies on test score use may differ from one another and may also varyfrom the recommendations presented in this document.The Every Student Succeeds Act of 2015 requires that all students identified as Englishlanguage learners (ELLs) be assessed annually for English language proficiency. ACCESS forELLs meets federal accountability requirements and provides educators with a measure of theEnglish language proficiency growth of ELLs. 2022 Board of Regents of the University of Wisconsin System, on behalf of WIDA.Comments on this document? Email documentation@wida.us.Last revised 1/6/22
ACCESS for ELLsACCESS for ELLs is a suite of large-scale English language proficiency tests for K–12 students. It is onecomponent of WIDA’s comprehensive, standards-driven system that supports the teaching andlearning of English language learners (ELLs). The purpose of ACCESS for ELLs is to monitor studentprogress in English language proficiency on a yearly basis and to serve as just one of the manycriteria that educators consider as they determine whether English learners have attained an Englishlanguage proficiency level that will allow them to meaningfully participate in English languageclassroom instruction. Visit wida.wisc.edu/assess/access for details on ACCESS for ELLs.ACCESS for ELLs is a standards-referenced test, which means that student performance is comparedto English language development standards WIDA has defined. Any student can achieve any score,and students are not ranked against each other or against the expected performance of monolingualEnglish speakers. Visit wida.wisc.edu/teach/standards for details on WIDA standards.The WIDA English Language Development Standards Framework, 2020 Edition will be the basisof future test development. However, all tests available in the 2021–2022 school year werebased on the 2012 standards.Understanding ScoresBefore diving into your students’ score reports, take some time to familiarize yourself with theresources on the Can Do Descriptors page of the WIDA website. The Can Do Descriptors and thecorresponding WIDA Performance Definitions for Speaking and Writing and Listening and Readingcan help you understand what test scores mean in practical terms. As you examine and discuss theEnglish language proficiency profile that each Individual Student Report shows, use WIDA resourcesto help you move from scores to concrete recommendations for the services, instructional support,and future assessment needs of each student.Consider holding an in-service session for your school or district so that educators can talk throughthe WIDA English Language Development Standards Framework, review sample score reports, anddiscuss how students’ scores might inform plans for classroom instruction and support.WIDA offers a variety of professional development resources that can help educators andadministrators fully understand and make the best use of WIDA assessments. Check out the currentprofessional learning offerings and the webinars available in the WIDA Secure Portal.Don’t keep ACCESS for ELLs information to yourself! Scores can help parents or guardiansand other educators better understand a student’s abilities. Find resources for sharing scores onthe Family Engagement page of the WIDA website.Use resources like the Model Performance Indicators, included in the 2012 Amplification of the EnglishLanguage Development Standards, to identify and describe the language abilities a student alreadyhas, the skills a student can work on, and the instructional supports that might be effective as astudent develops new language abilities. Share the profile and plans you develop with your students’content teachers. Translate your plans into the student’s home language and share them with thestudent’s family during conferences, family nights, or home visits so that home can be a place ofactive language learning.2
ACCESS for ELLs Score ReportsIndividual Student ReportAudience: Students, Parents and Guardians, Teachers, School TeamsDetailed report of a single student’s performance, including proficiency level and scale scores foreach language domain and four composite areas. Share with students to set language goals. Sharewith parents and guardians as part of discussions around student progress and achievement. Sharewith the student’s teachers to inform individualized classroom instruction and assessment.Translations of the Individual Student Report are available in the following languages in WIDA AMS.Albanian, Amharic, Arabic (MSA), Bengali, Bosnian, Burmese, Chamorro, Chinese (Simplified), Chinese(Traditional), Chuukese, Dari, French (European), German, Gujarati, Haitian Creole, Hawaiian, Hindi,Hmong, Ilokano, Italian, Japanese, Karen, Khmer (Cambodian), Korean, Lao, Malayalam, Mandingo,Marshallese, Nepali, Pashto, Polish, Portuguese (Brazilian), Punjabi, Romanian, Russian, Samoan, Serbian,Somali, Spanish (International), Swahili, Tagalog, Telugu, Tongan, Turkish, Ukrainian, Urdu, Vietnamese,WolofTranslated reports should always accompany—not replace!—official reports in English.Student Roster ReportAudience: Teachers, Program Coordinators and Directors, AdministratorsOverview report on the performances of a group of students, including proficiency level and scalescores for each language domain and composite area by school, grade, student, tier, and grade-levelcluster. Share with administrators and teachers to inform classroom instruction and assessment.Frequency ReportsHigh-level report for a single grade within a school, district, or state on the number and percentageof tested students that achieved each proficiency level for each language domain and compositearea.State Frequency ReportSchool Frequency ReportDistrict Frequency ReportAudience: ProgramCoordinators and Directors,AdministratorsAudience: Program Coordinators Audience: State and DistrictProgram Staff, Policy Makers andand Directors, Administrators,LegislatorsBoards of EducationShare with school and districtstaff to inform school-levelprogrammatic decisions.Share with district staff to informdistrict-level programmaticdecisions.Use to prepare reports forpolicymakers and legislators andto inform state- and district-levelprogrammatic decisions.The ACCESS for ELLs Scores and Reports can be found on the WIDA website here.3
Individual Student ScoresDomain ScoresThe Individual Student Report contains detailed information about a student’s performance on eachsection of ACCESS for ELLs. It is primarily for students, parents or guardians, and teachers. It providesa snapshot of how well the student understands and can produce the language needed to access theacademic content presented in an English-medium classroom. The Individual Student Report shows aproficiency level and a scale score for each of the four language domains.Proficiency levels are interpretive scores. In other words, they are based on, but separate from, scalescores. The proficiency level score describes the student’s performance in terms of the six WIDAEnglish Language Proficiency Levels:Level 1EnteringLevel 2EmergingLevel 3DevelopingLevel 4ExpandingLevel 5BridgingLevel 6ReachingThe proficiency level score is a whole number followed by a decimal. The whole number reflects thestudent’s proficiency level, and the number after the decimal reflects how far the student hasprogressed within that level. For example, a student with a score of 3.7 is at proficiency level 3 and isover halfway toward achieving proficiency level 4. At the bottom of the Individual Student Report,each proficiency level achieved by the student is explained in terms of what they can do usingEnglish. A complete list of the proficiency level descriptors is included in this document.Take care when comparing proficiency level scores across grades. A second grader with a 4.0 inListening and a 3.0 in Speaking is demonstrating more developed listening skills than speaking skills.However, proficiency levels are relevant to the context of a particular grade level. A second graderwith a 4.0 in Listening and an eighth grader with a 4.0 in Listening are exposed to very different,grade-level appropriate content as they test. While their score reports reflect the same proficiencylevel, the eighth grader is demonstrating more skill by responding to more challenging content.It’s also important to consider grade-appropriate expectations when students in different grades takethe same grade-level cluster test. For example, when a sixth grader and an eighth grader take thegrades 6–8 test and both earn proficiency level scores of 4.0, this is the result of the eighth graderearning a higher scale score. The eighth grader must perform better than the sixth grader to earn thesame proficiency level score because the proficiency level is grade specific.4
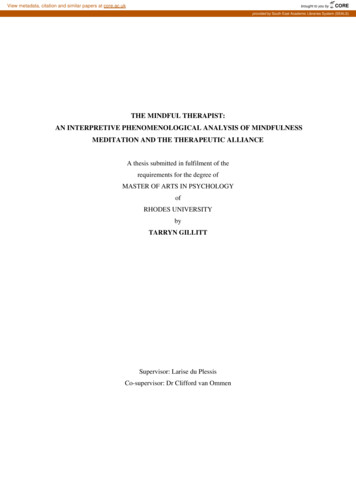
Use proficiency levels to make comparisons across domains but not across grades. with the WIDA Can Do Descriptors to develop a student-specific English language skillprofile. as one of multiple criteria to determine a student’s eligibility for English languagesupport services.Proficiency levels are grade specific.A fifth grader who earns a scale scoreof 355 is at proficiency level 4.0, whilethat same scale score for a thirdgrader might generate a proficiencylevel score of 5.2.Proficiency levels are domain specific.A sixth grader who earns a scale score of370 in Listening is at proficiency level 4.3.That same student who earns a scale scoreof 370 in Reading has a Readingproficiency level of only 3.8.Context matters! These three studentshave all earned a proficiency levelscore of 4 on grade-level appropriate8th gradetests. The eighth grader hasth6grade2nd gradedemonstrated the most languageskill by responding to the mostdemonstrated performance to earn proficiency level 4challenging content.Think of it like this: When students in different grades each receive an “A” on a math test, theequivalent grades do not reflect an equivalent knowledge of math. The student in the highergrade likely understands math concepts the student in the lower grade doesn’t. Similarly, thegrade 8 student in this example has shown the ability to understand and produce morelanguage than the grade 2 student can, even though they are both at proficiency level 4.Use scale scores to make comparisons across grade levels but not across domains. A scale score of 355in Listening is not the same as a 355 in Speaking! to monitor student growth over time within a domain.Scale scores are a means of comparing equivalent knowledge across grades. However,increasing expectations at higher grades mean that scale scores do not translate toequivalent proficiency levels across grades. For example, consider how a scale score of355 in Listening translates to a proficiency level score:Grade 3Proficiency level 5.2Grade 4Proficiency level 4.65Grade 5Proficiency level 4.0
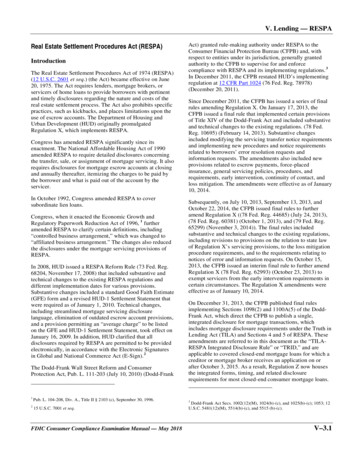
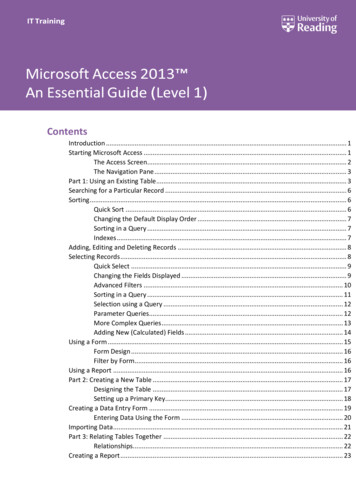
Scale scores precisely track student growth over time and across grades. Because scale scores takeinto account differences in item difficulty, they place all students on a single continuum that stretchesfrom kindergarten through grade 12. In addition, scale scores allow you to compare studentperformance across grades, within each domain, with more granularity than you’ll see with proficiencylevels. For example, using scale scores, you can track how much a student’s listening ability increasesfrom grade 6 to grade 7, or you might compare the speaking skills of your school’s second graders tothat of the fifth graders when evaluating curricula.Scale scores are not raw scores. A raw score is simply a tally of correct responses. Raw scores arenot reported for ACCESS for ELLs because they do not provide a meaningful measure of studentperformance. For example, consider two students taking ACCESS for ELLs Online. As the studentsmove through the test, their performances determine which questions they see. The student atbeginning proficiency sees easier items, and the higher-proficiency student sees more difficult items.Scale scores reflect the fact that a student who correctly answers 10 difficult questions demonstratesa higher level of proficiency than a student who correctly answers 10 less challenging questions.A scale score is reported as a single pointwithin a confidence band that shows theStandard Error of Measurement (SEM).In other words, the box beneath the scale score shows the range of scores a student mightreceive if that student took the test again and again at a single point in time.Confidence bands are a reminder that scale scores represent just one point in a range ofpotential student performance outcomes. Consider, for example, these scenarios:1)The student is healthy and well rested. The testing session goes smoothly.2) The student isn’t feeling well. The testing session goes smoothly.3) The student is healthy and well rested. The testing session is repeatedly interruptedby loud noises in the room next door.Even though the student is the same, has the same proficiency level, and responds to thesame test questions in all three scenarios, they are most likely to achieve the highest scorein the first scenario. Because ACCESS for ELLs is a statistically reliable assessment, thescores in each scenario would be similar—but probably not exactly the same. Theconfidence band reflects the expected score variation.Different methods are used to score the different domain tests of ACCESS for ELLs. The multiple-choice items of the Listening and Reading tests are machine scored. The constructed response items of the Writing test are scored by trained raters who use theWIDA Writing Scoring Scale. The constructed response items of the Speaking domain are scored locally by certified testadministrators when students take ACCESS for ELLs Paper. Recorded responses are scoredcentrally by trained raters when students take ACCESS for ELLs Online. Both testadministrators and centralized raters use the WIDA Speaking Scoring Scale.6
More tailored to instructional planning than the scoring scales are the WIDA Speaking and WritingRubrics. These rubrics detail the types of spoken and written language expected of students at eachproficiency level. For example, one characteristic of students at Level 2—Emerging is “repetitivesentence and phrasal patterns and formulaic grammatical structures.” Students at this proficiencylevel might benefit from classroom activities that encourage them to practice new phrases andsentence structures. These documents, from which the scoring scales are derived, provide a practicallist of specific skills that educators can reference as they plan classroom supports.WIDA rubrics and scoring scales can be found at this link.Composite ScoresIn addition to proficiency level and scale scores for each language domain, students receive aproficiency level score and a scale score for different combinations of the language domains. Thesecomposite scores are Oral Language, Literacy, Comprehension, and Overall.Proficiency levels are always calculated from scale scores. Forexample, the Reading and Writing scale scores are averaged to createa Literacy scale score. The Literacy scale score is then associated witha Literacy proficiency level.Composite scores demand careful consideration. Composite scores can helpfully summarizestudent skills. However, similar composite scores can detract from critical differences betweenstudents. For example, two students with identical Overall scores might have very differentprofiles in terms of their oral language and literacy development. One student might have verystrong speaking skills, while another might excel at reading. Because a high score in onelanguage domain can inflate a composite score, a student’s individual performance in eachdomain is more informative than a single composite score.Only students who complete all four domains receive all four composite scores. If a student does notcomplete a particular domain, scores for that domain and any associated composite scores will bemissing from the student’s score report.The letters NA appear on the Individual Student Report when information recorded on a test bookletor entered in WIDA AMS specifies that a particular domain test should not be scored. When NAappears for an individual language domain, NA also appears for the composite scores calculatedusing that domain, including the Overall score.7
Spaces are blank when a test booklet is returned or an online test submitted without any evidencethat the student engaged with the test content of an entire domain test. (Practice items are notscored, so completing the practice items does not indicate that the student attempted to completethe test.) Indications that a student engaged with the test content are: Listening and Reading: A response is captured or marked for at least one scored item.Speaking: A task was scored on a paper score sheet. OR The Record function in the onlinetest platform was activated for at least one scored item. A human voice need not be detectedin the recording.Writing: Markings appear in a Writing response space in the student’s test booklet. OR At leastone visible character (not a space or a return) was entered in the response box in the onlinetest platform.For example: A student has a Do Not Score code marked for the Reading domain. NA appears for theReading, Literacy, Comprehension, and Overall scores.A student logged in to the Speaking test, but never clicked the Record button for any scoreditems. The Speaking, Oral Language, and Overall score spaces are blank.NA appears for the Listening score. The Speaking score space is blank. In this scenario, NAappears for the Oral Language and Overall scores.Kindergarten ScoresKindergarten ACCESS for ELLs is designed with age-appropriate tasks that presume students are stilldeveloping full literacy skills. Because the test does not assess advanced reading and writing skills—asyoung learners with typical language development would not be expected to have these skills—kindergartners cannot earn scale scores above 400, a Reading proficiency level above 5.0, or aWriting proficiency level above 4.5.Highest possible proficiency levels on Kindergarten ACCESS for ELLs:Listening: 6.0 Reading: 5.0Speaking: 6.0 Writing: 4.5Interpreting Student Scores ACCESS for ELLs scores provide information on students’ English proficiency. They do notmeasure students’ academic achievement or content knowledge. The ACCESS for ELLs assessment and score reports are not designed or intended to provideany meaningful information about an individual educator’s skills or performance. School- anddistrict-wide trends are more meaningful as a means to evaluate long-term program impactsthan as a method to evaluate any one individual or draw conclusions about any particulargroup of students. WIDA recommends using ACCESS for ELLs scores as one of multiple pieces of informationthat inform high-stakes reclassification or exit decisions. Schoolwork, in-class assessments, andeducator insights are all valuable evidence that can help you understand a student’s Englishlanguage proficiency and development.8
State education agencies set reclassification policies, which include determining exit criteriaand establishing guidelines for the use of ACCESS for ELLs scores.Understanding Student GrowthBoth proficiency levels and scale scores can help you understand student growth year over year.Proficiency levels are a practical way to understand students’ skills, while scale scores offer a morenuanced measure of how much a student’s language use and control is changing. As you reviewACCESS for ELLs scores and consider student growth, keep the following information in mind: A student’s foundation in a home or primary language is a good predictor of English languagedevelopment. For example, a student with a strong literacy background in a home language islikely to acquire literacy in English at a quicker pace than a student with beginning levels ofhome language literacy. The pace of language development is different for each individual. It is common for youngerstudents and those at beginner proficiency levels to make progress more quickly than olderstudents and those at more advanced proficiency levels. Students rarely acquire proficiency across domains at the same pace. Often, oral languageskills (listening and speaking) develop faster than literacy skills (reading and writing). At thesame time, receptive language skills (listening and reading) often develop faster thanproductive language skills (speaking and writing). Every student’s growth is different, but it’snot unusual that students need longer to develop skills in Writing than in any other domain.Multiple consecutive years of data are necessaryto analyze student growth.Consider the first year a student takes ACCESS forELLs as an opportunity to establish a baseline of testperformance. Results from the second year can showgrowth, and only with three years or more of testresults can you see trends in the student’s languagedevelopment.ACCESS for ELLs scores from 2016–2017 and aftercan be analyzed together and compared. Scoresfrom before 2016–2017 are not comparable to thescores of subsequent tests. Consult your stateeducation agency for guidance on working with testscores from 2016–2017 and prior test administrationyears.9Consider 2022 scores carefully.Many students experienced anunusual 2021–2022 school yeardue to COVID-19. While the testand the meaning of scoresremain the same, many variablescould impact how this year’sscores relate to previous andsubsequent scores. For example,testing schedules and remotelearning might affect scores inways WIDA can’t yet analyze.
Group ScoresStudent Roster ReportThe Student Roster Report contains information on a group of students within a single school andgrade. Like the Individual Student Report, the Student Roster Report provides scale scores andproficiency levels for individual language domains and composite areas for each student, givingteachers, administrators, and program coordinators and directors an overview of their students’English language skills and a place to look for patterns in student performance.Use the Student Roster Report to identify patterns in student performance. Consult with colleagues about factors thatmight explain similarities and differences in how various groups of students perform. to verify that student scores reflect reasonable expectations. For example, you canexpect that students new to an English medium school context or who have had limitedor interrupted formal schooling will be at the lower end of the scale. For students withparticularly high scores, consider whether their classroom engagement and schoolworkfurther indicate that they might be ready to exit language support programs. to group students for instructional planning or classroom support purposes. to develop school and district improvement plans or educator professional developmentopportunities that target the areas in which students are struggling.ACCESS for ELLs Paper features two separate test forms for each grade-level cluster, aneasier one (Tier A) and a more challenging one (Tier B/C).ACCESS for ELLs Online features adaptive Listening and Reading tests, meaning students seeeasier or harder questions based on their performance. The tier shown on score reportsreflects the average difficulty level of the questions the student answered.The ACCESS for ELLs Speaking test is unique in offering a Pre-Tier A level. This test, intendedspecifically for newcomer students, doesn’t allow students to earn a proficiency score abovelevel 1.10
Frequency ReportsFrequency reports provide a snapshot of a particular student population. Available for individualschools, districts, and states, these reports show the number and percentage of students in eachgrade to attain each proficiency level. In addition, the reports provide the highest and lowest scalescores attained in each of the four language domains. (The individual students who earned these highand low scores are not identified.)Administrators, program coordinators and directors, and boards of education can review frequencyreports as they plan the type and amount of English language support services their schools, districts,or states will offer. In combination with educator input and the results of content assessments,frequency reports can help high-level decision and policy makers compare the progress and successof ELL students to that of former ELLs and their English-proficient peers.Frequency reports do not show the performance of individual students. Instead, they show theperformance of a group of students using both real numbers of test-takers and percentages of thetotal test-taker population. Be sure to use both of these numbers as you consider studentperformance. Percentages are a useful way to compare populations of different sizes. However, asmall population size can distort percentage results—knowing that 100% of students achieved aparticular proficiency level isn’t all that meaningful if the population size is 1.As with all student achievement reports, keep in mind that context is crucial. When you sharefrequency reports with decision makers, also provide information about the student population, suchas the variety of backgrounds students bring to your school, district, or state in terms of languages,cultures, and experiences. The frequency report itself cannot explain why students are distributed asthey are among the proficiency levels. For example, it’s not unusual for a school with many newstudents or a particularly mobile or linguistically diverse population to have more students atbeginning proficiency levels than another school with an equally strong English language supportprogram but a more stable and homogeneous student population.What next? Now that you’re an expert in student score reports, revisit the Understanding Scoressection of this document for links to resources that can help you connect test scores toclassroom practices!11
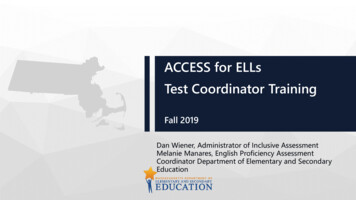
Proficiency Level Descriptors (Grades 1–12)LISTENINGLevelStudents at this level generally can 6 understand oral language in English and participate in all academic classes, for example: Synthesize information from multiple speakers Recognize language that conveys information with precision and accuracy Create models or visuals to represent detailed information presented orally Identify strengths and limitations of different points of view5 understand oral language in English and participate in all academic classes, for example: Expand on others’ ideas Distinguish events, people, or situations from oral descriptions Recall key information and details about processes or concepts discussed orally Identify examples and reasons that support an opinion or viewpoint4 understand oral language in English related to specific topics in school and canparticipate in class discussions, for example: Exchange information and ideas with others Connect people and events ba
Mar 01, 2021 · ACCESS for ELLs is a suite of large-scale English language proficiency tests for K–12 students. It is one component of WIDA’s comprehensive, standards-driven system that supports the teaching and learning of English language learners (EL