Transcription
Predictive Modeling using SASEnterprise Miner and SAS/STAT :Principles and Best PracticesCAROLYN OLSEN & DANIEL FUHRMANN
1OverviewThis presentation will: Provide a brief introduction of how to set upanalytics projects in SAS Enterprise Miner Highlight some of the main statisticalconcepts applied in a predictive modelingproject Outline three supervised learning techniquesIt will not:‐ Offer in‐depth coverage of advanced statistics‐ Be a complete tutorial for analytics in SAS EG or SAS EM‐ Be comprehensive by any stretch of imagination. Consider this presentation astarting point for your analytics journey.WIILSU 2016 ‐ OLSEN & FUHRMANN2
Outline1 Introduction2 Business questions & analysis process3 SEMMA methodology & project work flow4 Considerations for predictive modeling5 Selected supervised learning techniques6 Model Assessment
introductionWIILSU 2016 ‐ OLSEN & FUHRMANN4
1It all starts with WIILSU 2016 ‐ OLSEN & FUHRMANN5
1The answers might come via Predictive modeling: The use of known, historical data and mathematicaltechniques (statistical algorithms) to develop models that predict futureevents.Typically, the end result is to streamline decision‐making and to create newinsights that lead to better actions or outcomes. Therefore, predictivemodeling is widely used in industry to more accurately answer businessquestions that improve performance, increase revenues, or reduce costs.WIILSU 2016 ‐ OLSEN & FUHRMANN6
1Predictive Modeling Use Casesin Insurance Response model Default model (claims model) Retention model Cross‐sell / Up‐sell model Fraud model Lifetime Value model Process Failure model . and the list goes on.WIILSU 2016 ‐ OLSEN & FUHRMANN7
business questions &analysis processWIILSU 2016 ‐ OLSEN & FUHRMANN8
Characteristics of AnalyticBusiness QuestionsAnalysis ComplexityAnalysis paradigm2 Descriptive or advanced analytics, or both? Statistics or data mining?Data preparation paradigm As much data as possible or business knowledge first?Analysis method Supervised or unsupervised analysis?Scoring needed Yes or No?Periodicity of analysis One‐time deal or re‐run(s) anticipated?Historic data needed Yes or No?Data structure One row or multiple rows per subject?Analytics team complexity Communication and documentation needed?WIILSU 2016 ‐ OLSEN & FUHRMANN9
The Analysis Process (short)2Select an analysis methodIdentify data sourcesPrepare the dataExecute the analysisInterpret and evaluate the resultsAutomate data preparation and execution of analysisWIILSU 2016 ‐ OLSEN & FUHRMANN10
The Analysis Process tcasesGatherresultsExtractinput dataIntegratedeploymentValidateinput dataGeneratedeploymentmethodsRepairinput dataApplyanalysisTransforminput dataWIILSU 2016 ‐ OLSEN & FUHRMANN11
semma methodology &process flow in SAS EMWIILSU 2016 ‐ OLSEN & FUHRMANN12
3Getting Started in SAS EM
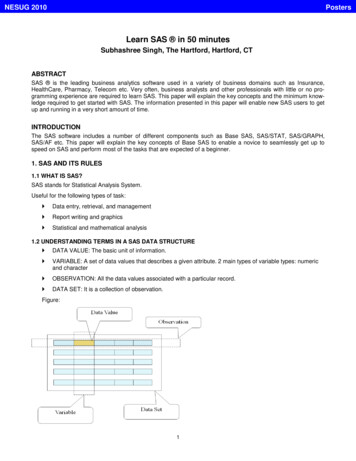
3Menu and Project PanelMenu/Task Bar and ShortcutsProject Panel – Displays your datasources, diagrams, and modelpackages.WIILSU 2016 ‐ OLSEN & FUHRMANN14
3Properties and HelpProperties Panel – User can makeadjustments to Node propertieshere.Help Panel – Displays brief yethelpful explanations of nodeproperties and settings.WIILSU 2016 ‐ OLSEN & FUHRMANN15
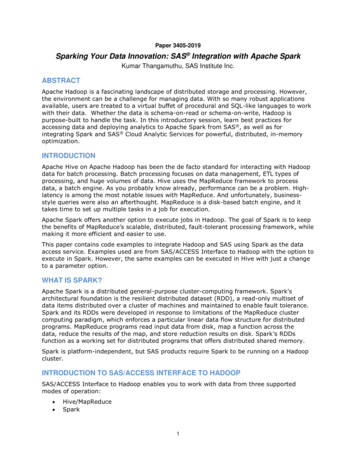
3Diagram Workspace &SEMMA Tools TabsDiagram Workspace – User creates alogical process flow for the data miningproject here. Information flows fromnode to node in the direction of theconnecting arrows.SEMMA & Tools Tabs– Functionalities tosample, explore, modify, model, andasses are found here along with anyadditional licensed utilities (e.g. TextMiner, Credit Scoring, etc.)WIILSU 2016 ‐ OLSEN & FUHRMANN16
3Reality bites WIILSU 2016 ‐ OLSEN & FUHRMANN17
3WIILSU 2016 ‐ OLSEN & FUHRMANN18
considerations forpredictive modelingWIILSU 2016 ‐ OLSEN & FUHRMANN419
OutlineI) Introduction2) Business questions & analysis process3) SEMMA methodology & project work flow in SAS Enterprise Miner4) Considerations for predictive modeling are outlined next, they includedata preparation (definitions of target and observation window, offsetwindow, sampling, missing value treatment, and variabletransformations), variable selection methods, overfitting, validationmethods, and criteria to assess model performance. This paper concludeswith an introduction to several supervised learning techniques(regression, decision trees, neural networks, and ensemble models) andapplications of these methods to a use case in the insurance industry. Theintended audience for this paper are beginning and intermediate‐level datascientists, analysts, and modelers. While the paper focuses on applicationsin SAS Enterprise Miner, it provides alternative approaches implemented inSAS/STAT, wherever possible.WIILSU 2016 ‐ OLSEN & FUHRMANN20
4Data Structures and DataModeling – Things to consider The Origin of Data Data Models Analysis Subjects and Multiple Observations Data Mart Structures No analysis subject available? For purposes of predictive modeling – it is important to decide thegrain or event you want to predict. i.e. the structure and design of your dependent variable(s)WIILSU 2016 ‐ OLSEN & FUHRMANN21
4Sample – How toSAS ENTERPRISE GUIDESAS ENTERPRISE MINER PROC SURVEYSELECT SAS CODE Node PROC IML Sample NodeWIILSU 2016 ‐ OLSEN & FUHRMANN22
4Definition of EDAExploratory Data Analysis (EDA) is an approach/philosophyfor data analysis that employs a variety of techniques(mostly graphical) to maximize insight into a data set: uncover underlying structure; extract important variables; detect outliers and anomalies; test underlying assumptions; develop parsimonious models; and determine optimal factor settings.WIILSU 2016 ‐ OLSEN & FUHRMANN23
4Explore – How toSAS ENTERPRISE MINERSAS ENTERPRISE GUIDE PROC UNIVARIATE & CORR SAS CODE Node PROC SGPLOT & MI StatExplore, GraphExplore, MultiplotWIILSU 2016 ‐ OLSEN & FUHRMANN24
4Suggested Steps after EDACheck for missing values (MCAR, MAR, MNAR) Possible actions: imputation, leave as is, missing value flags, etc.Look for univariate (and multivariate) outliers Possible actions: drop obs, Winsorizing, value correction if erroneousentry, etc.Investigate variable distributions for ill‐behaved items Possible actions: transformation, binning, etc.Check if multicollinearity is present Possible actions: drop input(s), create factors or principal components, donothingDiscuss any existing business rules around data with IT Expert andBusiness Client, ideally before taking any of the actions above.WIILSU 2016 ‐ OLSEN & FUHRMANN25
4Modify ‐ Set up ofIndependent VariablesBasic Variables Continuous or Interval Variables Categorical (nominal or ordinal) Dummy VariablesIntermediate Variables Interaction Effects Transformed (Power, Logarithmic, etc.) Binning Interval to Categorical VariablesWIILSU 2016 ‐ OLSEN & FUHRMANN26
4Modify ‐ Important VariableCriteriaSufficiency All potentially relevant information from the available source systemsis also in the analysis table.Efficiency Keep number of variables as small as possible (parsimony).Relevance Data are gathered/aggregated in such a form that the (derived)variables are suitable for the analysis and business question.Interpretability Variables that are used for analysis can be interpreted and aremeaningful from a business point of view.WIILSU 2016 ‐ OLSEN & FUHRMANN27
4Modify – How toSAS ENTERPRISE GUIDESAS ENTERPRISE MINER DATA step SAS CODE Node Specify interactions, polynomialswithin analytical tasksWIILSU 2016 ‐ OLSEN & FUHRMANN28
selected supervisedlearning techniquesWIILSU 2016 ‐ OLSEN & FUHRMANN29
5Logistic RegressionPURPOSEUse multiple x variables (inputs) to estimatep (output), the probability of an event y. Thisis a supervised technique that requireshistorical data with known outcomes.METHOD VISUALIZATIONFor a probability p of an event, the odds ofthe event are p/(1‐p). A logistic regressionmodels the log of the odds of the event,using a linear function:logit log(p/(1‐p)) β0 β1X1 β2X2 βPXPThe coefficients in this equation aredetermined using “maximum likelihoodestimation,” an iterative process that beginswith a tentative solution then repeatsrevision until improvement is minute – atwhich point the process is said to have“converged.”WIILSU 2016 ‐ OLSEN & FUHRMANN30
5Logistic RegressionIMPORTANT CONSIDERATIONSMODEL VALIDATIONThere are assumptions which mustbe met for a logistic regression to beunbiased, and there are importantconsiderations around data setstructure and defining the outcome.Additionally, with small samples,maximum likelihood estimation isknown to be biased.There is a variety of measures used tomeasure how strong a classificationmodel is: the confusion matrix, whichgives true and false positive rates andtrue and false negative rates; accuracy;misclassification rate; positivepredictive value (PPV), negativepredictive value (NPV); and others.Review the Receiver OperativeCharacteristic (ROC) curve.Logistic regression has the samelimitations in modeling non‐linearrelationships as linear regression.That is because the log odds is stillestimated using a linear equation.This requires extra attention totransformations and interactions.For a logistic regression, you can alsoreview a Likelihood‐Ratio Test as ameasure of goodness of fit; or you canreview AIC, BIC, or one of several“pseudo R2” values.WIILSU 2016 ‐ OLSEN & FUHRMANN31
5Decision TreePURPOSEMETHOD VISUALIZATIONUse multiple x variables to predicta categorical outcome y. Theoutcome can be two‐level(yes/no), or multi‐level. These canbe used either for predictivepurposes, or for data exploration.This is a supervised technique thatrequires historical data withknown outcomes.WIILSU 2016 ‐ OLSEN & FUHRMANN32
5Decision TreeIMPORTANT CONSIDERATIONSDecision trees do not have as strongassumptions as regressions do, but theyare many different ways to approachthem: algorithm choice, missing valuetreatment, stopping criteria, pruningmethods, etc. Additionally, thepredictive power of decision trees isgreatly increased by use of ensemblingtechniques.SAS Enterprise Miner uses its ownalgorithm which adopts aspects of thevarious decision tree algorithms andallows the user to set parameters formissing variable handling and stoppingcriteria. Outside of SAS EM, you willneed to choose an algorithm andhandle your data preparationaccordingly.MODEL VALIDATIONThere is a variety of measures usedto measure how strong aclassification model is: theconfusion matrix, which gives trueand false positive rates and trueand false negative rates; accuracy;misclassification rate; positivepredictive value (PPV) and negativepredictive value (NPV); and others.Often analysts will review theReceiver Operative Characteristic(ROC) curve to see how well themodel is doing and to reviewpossible trade‐offs of sensitivity andspecificity.WIILSU 2016 ‐ OLSEN & FUHRMANN33
5Decision tree output in SAS EMNode RulesTree Plot Node color events as % ofnode observations Line width observations inbranch as % oftotal observations Definitionsfor each leafnode View Model Node RulesVariable Importance View Model VariableImportanceWIILSU 2016 ‐ OLSEN & FUHRMANN34
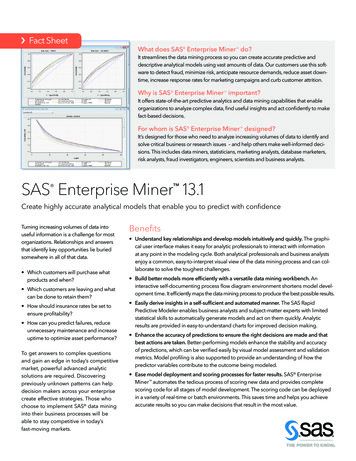
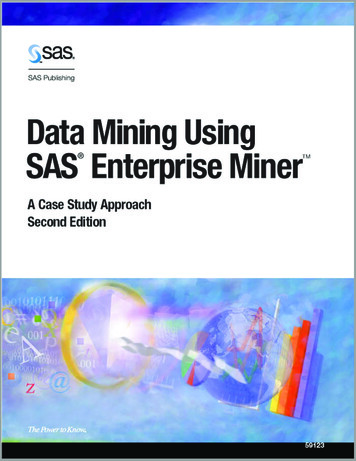
Ensembles combine informationfrom multiple models to producea better, “ensembled” model5Model 1Model 2Data EnsembleModelModel kOften more robust and more accurate than a single model. Think“committee of experts.”Often, but not always, ensembles are of the same algorithm, e.g. alldecision tree or all neural net.WIILSU 2016 ‐ OLSEN & FUHRMANN35
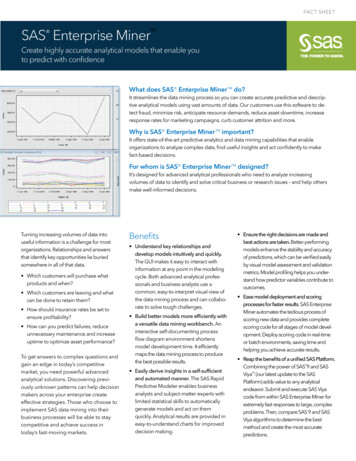
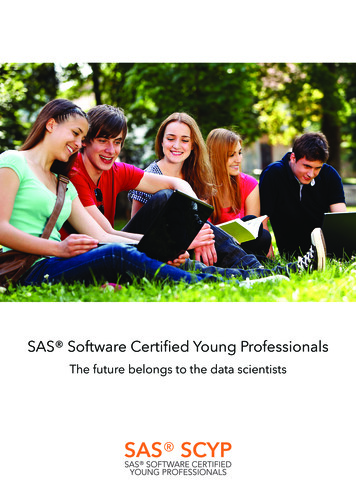
5Research shows ensembles oftenoutperform single modelsEnsemblesSingleClassifiersFrom Zhuowen Tu, “Ensemble Classification Methods: Bagging, Boosting, and Random Forests”WIILSU 2016 ‐ OLSEN & FUHRMANN36
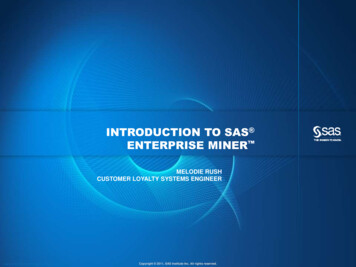
5Ensembling is quicklybecoming industry‐standardAccording to Rexer Analytics data miner survey:PERCENT OF DATA MINERSUSING ENSEMBLE MODELS41%22%20102013Question: “What algorithms/analytic methods do you TYPICALLY use? (Select all that apply.)”The 2013 Rexer Analytics survey included 1,200 data miner responses from 75 countries, and hasbeen cited in over 60 publications.WIILSU 2016 ‐ OLSEN & FUHRMANN37
5Pro’s and con’s of ensemblingPro’sCon’s Can significantlyreduce model error Easy to implementwith SAS EnterpriseMiner Model interpretabilityis more difficult(mitigate withVariable Importancemeasures) More computationallyintensiveWIILSU 2016 ‐ OLSEN & FUHRMANN38
5Rule of thumb: “good candidates”for model ensemblingGood candidates:Weak learners and non‐linear models Decision treesNaïve BayesNeural netsk‐Nearest NeighborSupport vector machine (if nota linear kernel; try a polynomialkernel)Marginal candidates:Stable, linear models Linear regressionLogistic regressionLinear discriminant analysisLinear support vector machinesBut, which algorithms work best depends on the data.WIILSU 2016 ‐ OLSEN & FUHRMANN39
5Model – How toSAS ENTERPRISE MINERSAS ENTERPRISE GUIDE Logistic regression (forward,backward, stepwise, all‐subsets)WIILSU 2016 ‐ OLSEN & FUHRMANN40
model assessmentWIILSU 2016 ‐ OLSEN & FUHRMANN41
6Steps in Logistic RegressionAnalysisStep 1: What is the probability that results could be bychance? Model significance (Likelihood Ratio Test)Step 2: How closely do points cluster around the mean? Overall model strength (Cox and Snell R2, Nagelkerke R2)Step 3: How good are the results? Classification Matrix (See next Slide)WIILSU 2016 ‐ OLSEN & FUHRMANN42
6Classification MatrixInterpreting Logit ResultsPredicted Result0 (no)1 (yes)TotalObserved Outcome0 (no)1 (yes)True Negative (TN) False Negative (FN)False Positive (FP) True Positive (TP)TN FPTP FNTotalTN FNTP FPTP FP TN FN NAccuracy (TP TN) / NMisclassification Rate 1‐ AccuracyWIILSU 2016 ‐ OLSEN & FUHRMANN43
6Steps in Logistic RegressionAnalysisStep 4: Are regression coefficients statistically significant? Significance of each model variables (Wald Test; Odds Ratio)Step 5: Determining the Size of the effects Strength of individual contributions of X’s on YStep 6: Interpret standardized effects of X’s and rank byimportance Standardized effects of X’s on Y Beta weightsStep 7: Compare Model Performance against competing Models (AIC,BIC, or ASE)WIILSU 2016 ‐ OLSEN & FUHRMANN44
6Assess – How toSAS ENTERPRISE MINERSAS ENTERPRISE GUIDE PROC LOGISTIC with ROC andROCCONTRAST statementsIn both platforms, look at gains charts and tables,c‐statistics, (cumulative) lift, (cumulative) percentcaptured, misclassification rates and/or averagesquared error values.WIILSU 2016 ‐ OLSEN & FUHRMANN45
Modeling ResourcesDecision Trees for Analytics using SAS Enterprise Miner by de Ville &NevilleApplied Predictive Modeling by Kuhn and JohnsonDecision Trees for Predictive Modeling(freely available online here)Introduction to Statistical Learning(freely available online here)WIILSU 2016 ‐ OLSEN & FUHRMANN46
A few EDA resourcesHelpful SAS EG paper with a good amount of examples including step‐by‐step instructions and screenshots s12/152‐2012.pdfMethods for Interaction Detection in Predictive Modeling using SASo ��SA01.pdfOnline Engineering Statistics Handbook, Section on EDA: mData Preparation for Analytics – Using SAS by Gerhard Svolba, SAS Press SeriesWIILSU 2016 ‐ OLSEN & FUHRMANN47
Contact infoCarolyn Olsen, MS GStatData & Analytics Consultant, Northwestern MutualMilwaukee, WIEmail: carolynolsen@northwesternmutual.comDaniel Fuhrmann, Ph.D.Data & Analytics Lead Consultant, Northwestern MutualMilwaukee, WIEmail: danielfuhrmann@northwesternmutual.comWIILSU 2016 ‐ OLSEN & FUHRMANN48
The End Questions? Comments?WIILSU 2016 ‐ OLSEN & FUHRMANN49
analytics projects in SAS Enterprise Miner Highlight some of the main statistical concepts applied in a predictive modeling project Outline three supervised learning techniques It will not