Transcription
Information Services DivisionPublication ReportScottish Heart Disease StatisticsYear Ending 31 March 2015Publication date – 26 January 2016A National Statistics Publication for Scotland
Information Services DivisionContentsIntroduction . 2Key points . 3Results and Commentary . 4Hospital Activity . 4Incidence . 9Operations . 11Survival . 15Mortality . 17Deprivation . 22Cardiovascular Prescribing . 26Primary Care Activity . 28Ambulance Service Activity . 30Glossary . 32List of Tables . 37Contact. 39Further Information. 39Rate this publication . 39Appendix . 40A1.1 – Impact of Health Board boundary changes . 40A1.2 – Community Health Partnerships. 41A2 – Background Information . 42A3 – Publication Metadata (including revisions details) . 47A4 – Early Access details (including Pre-Release Access) . 52A5 – ISD and Official Statistics . 531
Information Services DivisionIntroductionAlthough coronary heart disease (CHD) is a preventable disease, there were 6,872 deathsin Scotland in 2014 where CHD was the underlying cause. The disease is caused when theheart's blood vessels, the coronary arteries, become narrowed or blocked and cannotsupply enough blood to the heart.Scotland has a high prevalence of the risk factors associated with heart disease such assmoking, poor diet and physical inactivity. Treating and preventing heart disease is anational clinical priority for Scotland.1It is estimated that around 7.8% of men and 4.7% of women are living with CHD (ScottishHealth Survey 2014).This ‘Heart Disease Statistics Update’ is produced annually to provide information on arange of different heart conditions in Scotland including:All heart diseaseAcute myocardial infarction (a medical term for a heart attack)AnginaHeart failureCoronary heart disease (also referred to as ischaemic heart disease, a collectiveterm that includes angina, heart attack and heart failure)and the different types of procedures used to diagnose and treat heart disease, including;Angiography: a procedure to examine the coronary arteriesAngioplasty: full name percutaneous transluminal coronary angioplasty, a procedureto widen narrowed coronary arteriesCoronary artery bypass graft: a procedure to replace narrowed coronary arterieswith grafts.This update contains information on hospital activity, incidence, operations, 30 day survivalfollowing first emergency admission, GP prescribing and ambulance service activity up tothe period 1 April 2014 - 31 March 2015, and mortality up to the period 1st January - 31stDecember 2014. The update also includes Quality Outcomes Framework (QOF) data fromgeneral practices.Information is presented at NHS Board level with some tables (activity and mortality) alsoavailable at Local Council Area level.1Better Heart Disease and Stroke Care Action Plan, June 2009; Heart Disease Improvement Plan, August20142
Information Services DivisionKey pointsCoronary heart disease, including heart attacks, is a leading cause of illness and deathin Scotland.The incidence rate for coronary heart disease decreased over the past decade bynearly 30% (adjusted for age and sex). Incidence rates for coronary heart diseaseremain consistently higher in males than females.There has been a steady downward trend in deaths from coronary heart disease inScotland, UK and Europe over the last ten years. In Scotland, the mortality fell by over40% between 2005 and 2014.The reduction in death rates for coronary heart disease was seen in both the most andleast deprived communities. The percentage reduction in deaths in the most deprivedcategory (36.1%) over the last ten years was smaller than that in the least deprivedcategory (46.5%).For an individual admitted to hospital as an emergency with their first heart attack, theirchances of surviving at least 30 days has improved over the last ten years from 85.2%to 92.3%.The number of prescriptions for drugs to treat diseases of the circulation, includingcerebrovascular and coronary heart disease, increased by 10.5% in the last ten years,although the trend has levelled off over the last six years. Despite this increase, the costof prescriptions dispensed for these drugs has halved over the last ten years to 109.5million in 2014/15.3
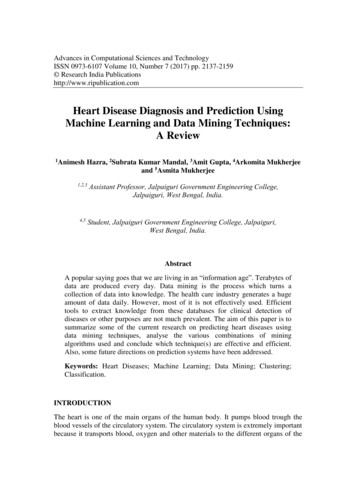
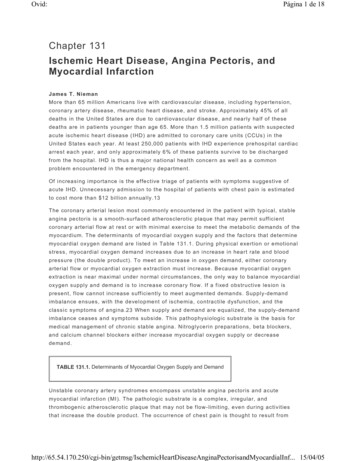
Information Services DivisionResults and CommentaryHospital Activity2DischargesThis section of the report examines the number of discharges from hospital with a specificheart disease condition. Note that a patient can have more than one discharge fromhospital within a given time period.Figures on discharges provide an indication of hospital usage for the diagnosis andtreatment of heart disease in either an inpatient or day case setting but excludes activityrelating to outpatients. Age and sex standardised discharge rates are presented here.Further information is available in Appendix A2.Coronary Heart Disease (CHD)In the last decade, there was a decreasing trend in the number of discharges from hospitalwith CHD. Between 2005/06 and 2014/15, the age and sex standardised discharge rate fellby 16.7% from 1,167 to 972 per 100,000 population.Figure 1: Discharges from hospital with coronary heart disease1;Age and sex standardised discharge rates per 100,000 population2Notes: 1. Analysis includes ICD-10 codes I20-I25.2. Rates are directly standardised to the 2013 European standard populationPdata are provisional for 2014/15 and are subject to change in future analyses.Data Source: ISD SMR01 - discharges; National Records Scotland – population estimates.2See Appendix A2 for details of completeness of hospital activity figures derived from SMR01 records.4
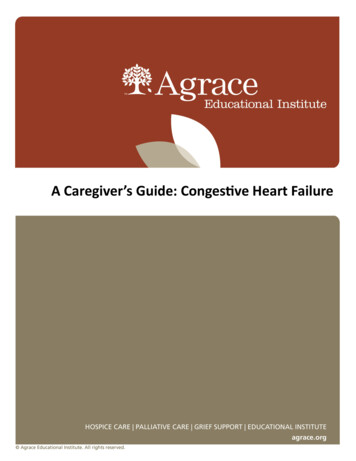
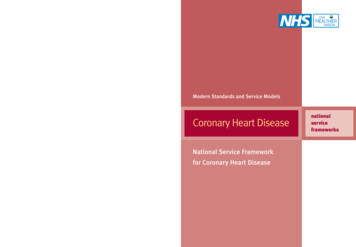
Information Services DivisionThe standardised discharge rate for females was less than half that for males in 2014/15and there was a larger percentage decrease for women over the last decade (22.5% forwomen compared to 13.9% for men).The percentage decrease in the rate was larger in the under-75 age group (18.7%) than inthe over-75 group (12.7%).Comparing mainland NHS Boards, in 2014/15 the standardised discharge rate was lowestin NHS Grampian (697 per 100,000 population) and highest in NHS Lanarkshire (1,367 per100,000 population).Tables AC1 and AC4 provide more detail at NHS Board and Council level.Heart AttacksThe age and sex standardised rate for a diagnosis of heart attack (myocardial infarction)increased from 400 per 100,000 population in 2005/06 to 510 per 100,000 population in2014/15, an increase of 27.7%.There was a decrease in the number of discharges from hospital with a diagnosis of heartattack up to 2007/08. There was then a large increase in the number of discharges with adiagnosis of heart attack between 2007/08 and 2010/11. Since 2010/11, the number ofdischarges remained relatively stable (Table AC1 and Figure 2).Figure 2: Discharges from hospital with a diagnosis of heart attack1;Age and sex standardised discharge rates per 100,000 population2Notes: 1. Analysis includes ICD-10 codes I21-I22.2. Rates are directly standardised to the 2013 European standard populationPdata are provisional for 2014/15 and are subject to change in future analyses.Data Source: ISD SMR01 - discharges; National Records Scotland – population estimates.The increase in the number of discharges from hospital with a diagnosis of heart attacksince 2007/08 was likely to be due to a change in the way that heart attacks are diagnosed.5
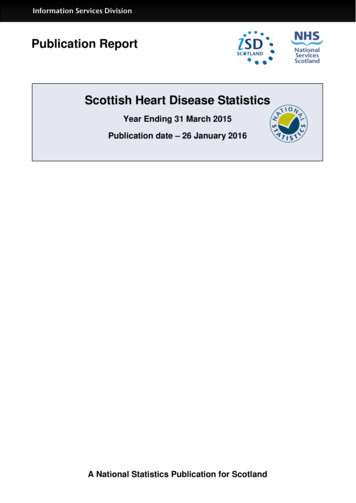
Information Services DivisionThe more sensitive troponin blood test is now routinely used to diagnose heart attacks. Thismeans that some cases that might previously have been diagnosed as angina or anothersimilar condition may now be classified as a heart attack. It is not possible to calculate thenumber of additional cases diagnosed because of the use of the troponin test. Moreinformation on this test is provided in the background information in Appendix A2.AnginaAngina is chest pain on exertion as a result of CHD. In the period 2007/08 to 2011/12, therewas a general downward trend in the standardised discharge rate for angina. Since2011/12 the rate has remained fairly stable. The age and sex standardised discharge ratewas 298 per 100,000 population in 2005/06 compared to 144 in 2014/15, a decrease of51.7% (Figure 3).Figure 3: Discharges from hospital with a diagnosis of angina1;Age and sex standardised discharge rates per 100,000 population2Notes: 1. Analysis includes ICD-10 codes I20 and I24.9.2. Rates are directly standardised to the 2013 European standard populationPdata are provisional for 2014/15 and are subject to change in future analyses.Data Source: ISD SMR01 - discharges; National Records Scotland – population estimates.The percentage decrease in the standardised rate was larger in the under 75 age group(55.8%) compared to the over 75 age group (43.9%) - Table AC1 and Table AC4.6
Information Services DivisionHeart FailureHeart failure occurs when the heart cannot provide sufficient pump action to meet demand.Although the number of discharges with diagnosis of heart failure increased by 24.0% overthe last ten years, the age and sex standardised discharge rate increased by only 5.7%,from 272 per 100,000 population in 2005/06 to 287 in 2014/15. (Figure 4 and Table AC1).Figure 4: Discharges from hospital with a diagnosis of heart failure1;Age and sex standardised discharge rates per 100,000 population2Notes: 1. Analysis includes ICD-10 codes I50.2. Rates are directly standardised to the 2013 European standard population.Pdata are provisional for 2014/15 and are subject to change in future analyses.Data Source: ISD SMR01 - discharges; National Records Scotland – population estimates.Chest PainChest pain can be symptomatic of other heart conditions. In the last ten years, the age andsex standardised discharge rate for chest pain rose from 700 per 100,000 population in2005/06 to 749 in 2014/15, an increase of 6.9%. However the rate remained fairly stablebetween 2007/08 and 2011/12 (Figure 5 and Table AC1).The increase in discharge rate over the last decade was larger in women (10.8%) than inmen (3.7%). It was also larger in the over-75 age group (19.1%) than in the under-75 agegroup (3.6%).7
Information Services DivisionFigure 5: Discharges from hospital with a diagnosis of chest pain1;Age and sex standardised discharge rates per 100,000 population2Notes: 1. Analysis includes ICD-10 codes R07.2. Rates are directly standardised to the 2013 European standard population.Pdata are provisional for 2013/14 and are subject to change in future analyses.Data Source: ISD SMR01 - discharges; National Records Scotland – population estimates.Details of hospital activity for all heart disease, angina, chest pain, CHD, heart attacks andheart failure by age, gender, type of admission and NHS board area are given in TableAC1. Corresponding information by council area can be found in Table AC4.8
Information Services DivisionIncidenceIncidence is the number of new cases of a specific condition in a population during adefined time-period. It is presented here as the number of people with a first hospitaladmission for CHD (or death from CHD without a prior admission to hospital). Informationhas been provided for CHD and heart attacks as it is likely that people with these conditionswould be admitted to hospital. Further information is available in the glossary.Coronary Heart Disease (CHD)The number of new cases of CHD decreased over the past decade. The age and sexstandardised incidence rate decreased by 29.7% from 533 per 100,000 population in2005/06 to 375 in 2014/15 (Figure 6).Figure 6: Coronary Heart Disease1Age and sex standardised incidence rates per 100,000 population2Notes: 1. Analysis includes ICD-10 codes I20-I252. Rates are directly standardised to the 2013 European standard population.Pdata are provisional for 2014/15 and are subject to change in future analyses.Data Source: ISD SMR01 - discharges; National Records Scotland – PopulationThe incidence of CHD increases sharply with age. The age and sex standardised incidencerate for the under 75 age group in 2014/15 was 236 per 100,000 population but for theover-75 age group, it was 1,781 per 100,000 population (see Table IC1).Across all age groups presented in this publication, males were more likely than females tohave a new diagnosis of CHD. The standardised incidence rate has fallen more steeply forfemales (34.7%) over the last ten years than for males (26.9%) (Table IC1).Comparing mainland NHS Boards, in 2014/15 the standardised incidence rate was lowestin NHS Fife (330 per 100,000 population) and highest in NHS Greater Glasgow & Clyde(417 per 100,000 population) (Table IC1).9
Information Services DivisionHeart AttacksThe age and sex standardised incidence rate of heart attack decreased by 13.8% from 281per 100,000 population in 2005/06 to 242 in 2007/08. The incidence rate increasedbetween 2007/08 and 2010/11. As previously noted, this was likely to be due to theintroduction of more sensitive tests for diagnosis (see Appendix A2 for more information).The incidence rate decreased to 225 per 100,000 population in 2014/15, a decrease of15.2% since 2010/11(see Table IC2 and figure 7).Figure 7: Heart attack1Age and sex standardised incidence rates per 100,000 population2Notes: 1. Analysis includes ICD-10 codes I21-I222. Rates are directly standardised to the 2013 European standard population.Pdata are provisional for 2014/15 and are subject to change in future analyses.Data Source: ISD SMR01 - discharges; National Records Scotland – PopulationDetails of incidence of CHD and heart attacks for Scotland by age and gender are given inTable IC1 and Table IC2.10
Information Services DivisionOperationsIn CHD, the blood supply to the heart is reduced or blocked. Two types of operation areused to improve the flow of blood to the heart. These are Coronary Artery Bypass Grafts(CABG) and angioplasties (Percutaneous Transluminal Coronary Angioplasty - PTCA).A CABG is an operation in which a blood vessel from another part of the body is grafted tothe coronary artery or arteries, to bypass narrowed sections and restore blood flow to theheart muscle. This involves a general anaesthetic and major open surgery.An angioplasty involves passing a thin, hollow tube into the coronary arteries from an arteryin the groin or arm. A device on the tube is then used to unblock the artery, and stretch theartery walls so that blood and oxygen can flow to the heart muscle. A small tube (or stent)may be left inside the vessel to ensure that it stays open. An angioplasty has the advantagethat it is generally regarded as a less major procedure than a CABG.Details of hospital activity for CABG, angioplasty, angiography and valve surgery by age,gender, type of admission and NHS board are given in Table OC1.Coronary Artery Bypass GraftsOver the last decade there was a decrease in the number of CABG operations. The ageand sex standardised hospital discharge rate decreased from 55 per 100,000 population in2005/06 to 33 per 100,000 population in 2014/15, a reduction of 40.0% (Table OC1 andfigure 8).Figure 8: Coronary Artery Bypass Grafts1Age and sex standardised discharge rates per 100,000 population2Notes: 1. Analysis includes OPCS codes K40-K46 (main A position only)2. Rates are directly standardised to the 2013 European standard populationData Source: ISD SMR01 - discharges; National Records Scotland – Populationp Provisional11
Information Services DivisionAngioplastiesThe general downward trend in the number of CABG operations reflects the increasing useof angioplasties in the treatment of CHD. The age and sex standardised hospital dischargerate for angioplasties increased from 130 per 100,000 population in 2005/06 to 155 in2014/15, an increase of 19.8% (Table OC1 and figure 9).Figure 9: Angioplasty1Age and sex standardised discharge rates per 100,000 population2Notes: 1. Analysis includes OPCS codes K49, K50, K75 (any A position)2. Rates are directly standardised to the 2013 European standard populationData Source: ISD SMR01 - discharges; National Records Scotland – Populationp ProvisionalCABG and angioplasty are collectively known as revascularisation procedures. The ageand sex standardised hospital discharge rate for revascularisation procedures increasedslightly over the last 10 years from 184 per 100,000 population in 2005/06 to 188 in2014/15, an increase of 2.0% (Table OC1 and figure 10). However, this slight increaseshould be set in the context of the marked fall in CHD incidence shown in figure 6.12
Information Services DivisionFigure 10: Revascularisation1Age and sex standardised discharge rates per 100,000 population2Notes: 1. Analysis includes OPCS codes K40-K46 (main A position only); K49, K50, K75 (any A position)2. Rates are directly standardised to the 2013 European standard populationData Source: ISD SMR01 - discharges; National Records Scotland – Populationp ProvisionalCoronary AngiographyCoronary angiography is carried out to diagnose coronary artery disease and also as partof its treatment, for example when angioplasty is carried out.For diagnostic angiographies (angiography with no associated angioplasty), there was ageneral downward trend in the last decade. The age and sex standardised hospitaldischarge rate dropped from 293 per 100,000 population in 2005/06 to 212 in 2014/15, areduction of 27.8% (Table OC1 and figure 11).For diagnostic angiographies used to assist in treatment (angiographies done inassociation with angioplasty), the standardised hospital discharge rate increased from 87per 100,000 population in 2005/06 to 132 in 2014/15, an increase of 51.2%. This reflectsthe increased use of angioplasties in the treatment of CHD (Table OC1 and figure 12).13
Information Services DivisionFigure 11: Diagnostic angiography with no associated angioplasty1Age and sex standardised discharge rates per 100,000 population2Notes: 1. Analysis includes OPCS codes K63, K65, U10.2, U10.5 (any A position)2. Rates are directly standardised to the 2013 European standard populationData Source: ISD SMR01 - discharges; National Records Scotland – Populationp ProvisionalFigure 12: Diagnostic angiography in association with angioplasty1Age and sex standardised discharge rates per 100,000 population2Notes: 1. Analysis includes OPCS codes K49, K50.1, K75, K63, K65, U10.2, U10.5 (any A position)2. Rates are directly standardised to the 2013 European standard populationData Source: ISD SMR01 - discharges; National Records Scotland – Populationp Provisional14
Information Services DivisionSurvivalThirty day survival is widely used as a measure of the outcome of hospital admission andreflects the severity of disease as well as the quality of care.Heart AttacksThe percentage of people who survived 30 days or more following their first emergencyadmission to hospital with a heart attack improved over the period 2005/06 to 2014/15(Figure 13). The percentage who survived 30 days for both sexes combined increased from85.2% in 2005/06 to 92.3% in 2014/15 (Table S1 and Figure 13). Over the same period,there was a narrowing of the gap in the survival between males and females from 7.2 to 4.4percentage points.For those aged 75 and over, 30 day survival increased from 74.0% in 2005/06 to 84.1% in2014/15.Figure 13: Heart attack1;Percentage of patients surviving 30 days or more after first emergency admission 2Notes: 1. Analysis includes ICD-10 codes I21-I222. y-axis (percentage surviving 30 days) starts at 70% to enable clear comparison between sexes.Data Source: ISD SMR01 - discharges; National Records Scotland – Population15
Information Services DivisionHeart FailureFor heart failure, there was a general increase in the number of people surviving 30 daysfollowing a first emergency admission to hospital. In the period 2005/06 to 2014/15, thepercentage surviving 30 days increased from 83.6% to 85.8% (Table S3 and figure 14). Forthose aged 75 and over, the percentage surviving 30 days increased from 80.4% to 82.9%over the same period.Figure 14: Heart failure1;Percentage of patients surviving 30 days or more after first emergency admission 2Notes: 1. Analysis includes ICD-10 codes I502. y-axis (percentage surviving 30 days) starts at 78% to enable clearer comparison between sexes.Data Source: ISD SMR01 - discharges; National Records Scotland – Population16
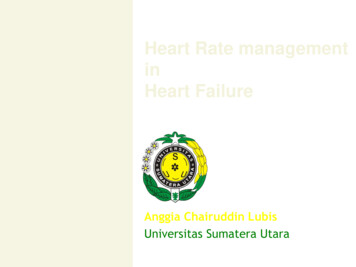
Information Services DivisionMortality3All Heart DiseaseThis section provides information for all heart diseases combined. As well as CHD, thisincludes disease of the heart valves and high blood pressure as well as other less commonconditions like infections of the heart.As in the rest of UK, there was a continuing downward trend in mortality from heart disease(including CHD). In Scotland, the age and sex standardised mortality rate for all heartdisease fell from 328 per 100,000 population in 2005 to 212 per 100,000 population in2014. This was a reduction of 35.6% in the last ten years and a reduction of 4.6% in thelast year (Table MC1 and Figure 15).Figure 15: All heart disease1: all ages by sex 2005-2014Age and sex standardised mortality rates per 100,000 population2Notes: 1. Analysis includes ICD-10 codes I00-I522. Rates are directly standardised to the 2013 European standard populationData Source: National Records Scotland - Deaths and PopulationThe reduction in mortality for all types of heart disease was slightly larger for people underthe age of 75 (38.8%) than for people aged 75 and over (34.0%) (Table MC1).3The figures included in this section refer to calendar years.17
Information Services DivisionCoronary Heart Disease (CHD)Over the last 20 years, CHD mortality rates in Scotland have been higher than those in theUnited Kingdom as a whole and much higher than those for the European Union. Howeverthe absolute gap in rates has narrowed considerably (see figure 16 below). 4Figure 16: Coronary heart disease1 mortality in Scotland, United Kingdom andEuropean Union1976 European age and sex standardised mortality rates per 100,000 population2Notes: 1. Analysis includes ICD-10 codes I20-I252. Rates are directly standardised to the 1976 European standard populationData Source: WHO/Europe and ScotPHO, Scotland and European HfA Database 2012The British Heart Foundation also publish comparisons of CHD mortality rates within theUK (figure 17). The mortality rates in Scotland have been higher than England, Wales andNorthern Ireland over the last 30 years. However, as in figure 16, the absolute gap inmortality rates has narrowed over this time.4Scotland and European Health for All Database 2012 and-and-european-hfa-database), accessed January 2015.18
Information Services DivisionFigure 17: Coronary heart disease mortality in United Kingdom, England, Wales,Scotland and Northern IrelandAge-standardised mortality rates per 100,000 population1Notes: 1. Rates are directly standardised to the 2013 European standard populationData Source: British Heart Foundation Cardiovascular Disease Statistics 2015, accessed 11/01/2016(available from -statistics-2015)19
Information Services DivisionThe age and sex standardised mortality rate for CHD fell from 262 per 100,000 populationin 2005 to 149 in 2014, a reduction of 43.3% over the last 10 years and 6.7% in the lastyear (Table MC1 and figure 18).Figure 18: Coronary heart disease1: all ages by sex 2005-2014Age and sex standardised mortality rates per 100,000 population2Notes: 1. Analysis includes ICD-10 codes I20-I252. Rates are directly standardised to the 2013 European standard populationData Source: National Records Scotland - Deaths and PopulationBetween 2005 and 2014 the reduction in age and sex standardised mortality rates for CHDwas slightly higher for females (45.9%) than males (41.8%). The difference in ratesbetween men and women narrowed from 156 deaths per 100,000 population in 2005 to 98deaths per 100,000 population in 2014.Of the mainland NHS Health Boards, NHS Ayrshire & Arran had the highest age and sexstandardised mortality rate in 2014 (162 per 100,000 population) while NHS Highland hadthe lowest rate (129 per 100,000 population). NHS Forth Valley had the highest percentagereduction in the mortality rate among the mainland Health Boards between 2005 and 2014(47.3%), while NHS Dumfries & Galloway had the lowest percentage reduction in themortality rate between 2005 and 2014 (26.9%).20
Information Services DivisionHeart AttacksThe age and sex standardised mortality rate for heart attacks decreased substantially overthe last ten years, falling by 50.9% from 154 per 100,000 population in 2005 to 76 in 2014(Table MC1 and figure 19).Figure 19: Heart attacks1: all ages by sex 2005-2014Age and sex standardised mortality rates per 100,000 population2Notes: 1. Analysis includes ICD-10 codes I21-I222. Rates are directly standardised to the 2013 European standard populationData Source: National Records Scotland - Deaths and PopulationDetails of mortality from all heart disease, CHD, heart attacks and heart failure by age,gender and health board area are given in Table MC1. Corresponding information bycouncil area can be found in Table MC4.21
Information Services DivisionDeprivationHeart disease varies greatly between areas of greater or less material deprivation. InScotland the Scottish Index of Multiple Deprivation (SIMD) is used to measure areadeprivation. It is a measurement of multiple deprivation which combines information onincome, employment, education, housing, health, crime and geographical access. Moreinformation is provided in the glossary and on the Scottish Government website. For thispublication, areas in Scotland were divided into five equal groups (quintiles) withdecreasing levels of deprivation.Age and sex standardised mortality rates for CHD are presented here, along withstandardised discharge rates for revascularisation.Coronary Heart Disease Mortality by Deprivation QuintilesThere was a reduction in mortality in all the deprivation quintiles over the decade 20052014. The reduction in the age and sex standardised CHD mortality rate among the mostdeprived quintile (quintile 1) was 36.1% compared with 46.5% in the least deprived quintile(quintile 5) - see Table DC7 and Figure 20. This implies a slight widening of relativeinequalities.Figure 20: Coronary Heart Disease1 Deaths by Deprivation (SIMD) Quintile2Age and sex standardised mortality rates per 100,000 population3Notes:1. Analysis includes ICD-10 codes I20-I252. Uses 2012 version of SIMD3. Rates are directly standardised to the 2013 European standard population.Data Source: National Records Scotland - Deaths and PopulationHowever, the absolute difference in the age and sex standardised mortality rate betweenthe most deprived (quintile 1) and least deprived (quintile 5) quintiles decreased over thelast decade from 136 to 107 per 100,000 population.22
Information Services DivisionCoronary Heart Disease Mortality by Deprivation DecilesFor this section, areas in Scotland were divided into 10 equal groups (deciles) where decile1 is most deprived and decile 10 is least deprived. The information is presented using agestandardised mortality ratios (SMRs). SMRs are the ratio of actual deaths to expecteddeaths (calculated using the average Scottish mortality rate). It adjusts for the age and sexof the population being examined. If the actual mortality rate was the same as the expectedmortality rate, the SMR would have a value of 100.Figure 21 shows that the association between mortality and deprivation was strong
Coronary heart disease, including heart attacks, is a leading cause of illness and death in Scotland. The incidence rate for coronary heart disease decreased over the past decade by nearly 30% (adjusted for age and sex). Incidence rates for coronary heart disease remain consistently higher in males than females.