Transcription
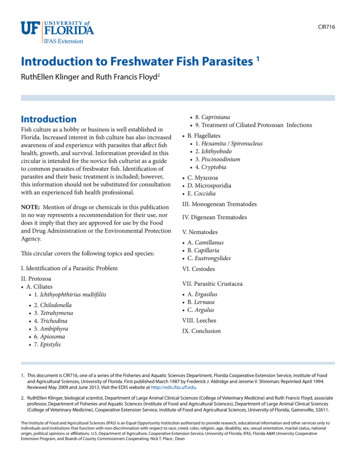
JUNE 2017Counting the fish catch - why don’t thenumbers match?Authors:Daniel Pauly and Dirk ZellerAssociate editor:Lindsey HallAbstractFish and marine animals like shrimp (we’ll call them all fishhere), are an important food source for many people in theworld. They provide vital nutrients to people with poor diets.There are various large and small-scale fisheries involved.Some people sell their catches, while others catch fish fortheir families to eat. In order to know the total amountcaught, we need accurate data on all fisheries catches.Reading level: upper middle to high schoolThis made us realize that catches peaked at a much higheramount than the officially reported figures. It also showedus that they are now declining much faster than previouslythought.All fisheries need to be better monitored so that we havemore accurate data. This will help us to be able to make theright decisions to protect global fish stocksWe carried out a data collection project to calculate totalcatches from all marine fisheries in the world from 1950 to2010.IntroductionIn many developing countries, fish is the main animal proteinavailable to rural people.But the growing popularity of fish in developed, or rapidlydeveloping countries, means that the demand is greaterthan their own fish stocks can supply.To meet this demand, countries have to get more fish fromother places. They either send their own fishing boats intothe waters of developing countries, or buy fish from them.This can make it hard for small-scale fisheries that supplytheir local communities in developing countries to competeagainst the larger, export-focused industrial fisheries (Fig.1).The Food and Agriculture Organization of the United Nations(FAO) receives annual catch data from its member countries.This is the only global data set of fisheries statistics. It getsused by scientists and agencies to create fishing policies.Figure 1:Industrial fishing boats often drag nets through the sea to catch fishМore free environmental science resources аt: www.ScienceJournalForKids.org1
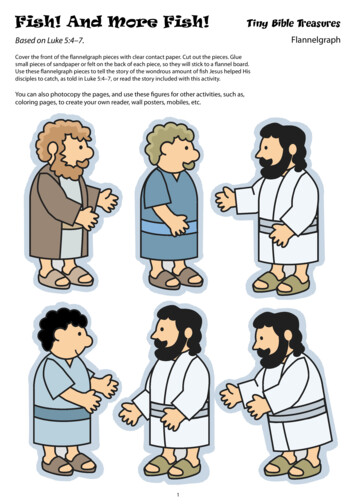
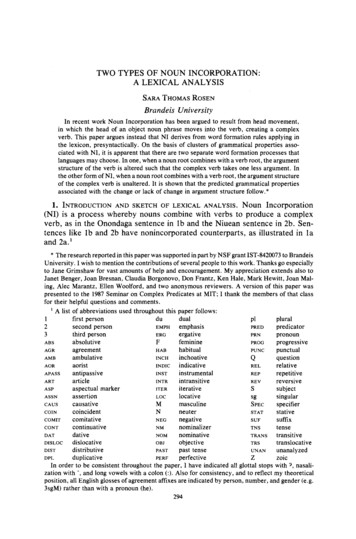
JUNE 2017COUNTING THE FISH CATCH - WHY DON’T THE NUMBERS MATCH?Unfortunately, many countries don’t accurately report ontheir small-scale fisheries. In fact, there are several datasets that they may underestimate:Artisanal (small-scale, commercial)Subsistence (small-scale, for the fishers’ own consumption)Recreational (small-scale, for pleasure)Discards (unintentional catch thrown back to sea)Illegal catches(Fig. 2)This means that FAO catch data may be much less thanthe actual fisheries catch. Although FAO and many scientistsknew that they had underestimated the figures, nobodyrealized just how serious the problem was.Figure 2:Artisanal fisheries like these can catch a lot of fish!We set out to find the real figures of global marine fishcatches.MethodsTo calculate total catch for all marine fisheries between 1950and 2010 we used an approach called catch reconstruction.For each maritime area, we added up three layers of data:When data was missing, we used catch estimates for a singlearea, sector or year. We then expanded these data to representan entire country, and joined the time periods between points.Layer 1 - Domestic catchTo get the reconstructed catch, we added the additional“unreported” catch data to the reported catch data submittedto FAO.We1)2)3)4)considered four We assigned catches to either landings (fish that people keepand bring into land) or discards.We used the FAO data as our baseline. We then added datafrom studies of scientific literature, speaking with local experts,and consulting with the country’s department of fisheries.These departments often had more detailed information thanwhat the country sent to FAO!Finally, we assessed the uncertainty. We scored eachreconstruction on the quality of the data, from 1 (very low –50% uncertainty), to 4 (very high, 10% uncertainty).Layer 2 - Catches from foreign fleetsThese are catches taken by boats of one country in anothercountry’s Exclusive Economic Zone (EEZ).Layer 3 - Tuna and other pelagic fishWe assigned catches to each area according to the dataavailable.Results1) Global patternFAO data suggest that global marine fisheries catches peakedin 1996 at 86 mt (million tonnes), and then slightly declined,although FAO labels this as ‘stability in global catches.’We found that global catches between 1950 and 2010 were50% higher than FAO data, and catch actually peaked at130 mt. Catches are now declining over three times morerapidly than reported (Fig. 3).2
JUNE 2017COUNTING THE FISH CATCH - WHY DON’T THE NUMBERS MATCH?200Figure 3:Reported (FAO landings) andreconstructed marine fisheriescatches 1950-2010.Catch or Landings (million t)180160This figure also shows our owncalculated confidence intervals(upper and lower CI) for our timeseries of reconstructed catch.This takes into account theuncertainty of our 990Year2) Spatial patternWe saw declining catches in some maritime areas, like theNorthwest Atlantic. Other maritime areas like the IndianOcean still show increasing reported catches, but these dataare far more uncertain.3) Fishing sectorIndustrial fisheries catch has fallen from 87 mt in 2000, to73 mt in 2010. This is the main cause of the global totaldecline in catches since 1996.20002010Reconstructed CatchesUpper and lower Confidence IntervalsFAO LandingsArtisanal fishing catches are gradually growing, from 8 mtper year in the 1950s to 22 mt in 2010.Subsistence fisheries accounted for 3.8 mt per year andrecreational fisheries account for under 1 mt per year. Thesecatches are rarely reported to FAO.Discards peaked in the late 1980s and have fallen to anaverage of 10.3 mt per year from 2000 - 2010. This fall ispartly responsible for the reducing levels of global catch,and reflects the declining industrial catch.DiscussionWe included estimates of uncertainty for each country’s data.While some of our estimates have high levels of uncertainty,officially reported data may be similarly uncertain. This isbecause most countries use sampling and estimations towork out their official national catch.Industrial fisheries catches are falling, but as countries startto include artisanal and other small-scale catches in theirofficial catch data, this is partially covering up the fall. Thiscan make the trend look more stable than it is.Our study showed that stock rebuilding is an important policythat should be more widely practiced. It also suggests thatit could be even more beneficial than previously estimatedfrom reported catches. However, we are concerned that therecent catch decline is a threat to food security, shown bythe decline in seafood caught per person.Our reconstructed catch data study for all countries is thefirst of its kind. We hope it will help to create better policiesto govern the world’s fisheries. The first step should be fornational policies to recognize the likely scale of the fisheriesthat they are not including in their official data collectionsystems. This could then help to improve their systems.3
JUNE 2017COUNTING THE FISH CATCH - WHY DON’T THE NUMBERS MATCH?ConclusionThe UN created the FAO database to help people makedecisions to protect marine ecosystems. It is thereforereally important that its data are accurate. However, wefound that the trend of global marine fisheries catches isactually one of decline, whereas FAO suggests that it isstable. Our study shows that there is a need to improve theaccuracy of this database.At the end of any science experiment, you have to makeyour conclusions and recommendations. These will only everbe as good as the data you collect at the beginning of theexperiment, so make sure that you’re confident in your data!Glossary of Key TermsExclusive Economic Zone – The areas of the seas that countries have claimed for resource use and management underthe United Nations Convention on the Law of the Sea (UNCLOS), or which they could claim under UNCLOS rules, but havenot done so (like many countries around the Mediterranean).Developed country – A country that is economically and industrially more developed compared to other countries. Thisincludes the US and Canada, and countries in Europe.Developing country – A country that is less developed economically and industrially than others. It normally also has alower standard of living. This includes many countries in Africa.Rapidly developing country – We define Brazil, Russia, India and China as rapidly developing countries. Their economiesare growing very fast and their populations are becoming wealthier. This generally results in the countries consuming moremeat and fish, as people's’ diets change.Ecosystem – A community of animals that interact with each other, and their physical environment.Food security – The ability for people to have reliable access to enough affordable and nutritious food to keep themhealthy.Pelagic fish – Fish that live in a part of the sea known as the Pelagic zone. This means that the fish live most of their livesneither close to the bottom of the sea, nor close to the shore or reefs. You can also think of these as ‘open ocean’ animals.Uncertainty – This recognizes the statistical precision of the data, or how likely it would be to be able to replicate theresults. A low level of uncertainty means that it will be more likely to be able to get the same results again if someonerepeated the study.REFERENCESPauly D and Zeller D (2016) Catch reconstructions reveal that global marine fisheries catches are higher than reportedand declining. Nature Communications 7: uly D and Zeller D (2017) The best catch data that can possibly be? Rejoinder to Ye et al. “FAO’s statistic dataand sustainability of fisheries and aquaculture.” Marine Policy 81: le/pii/S0308597X17301380Food and Agricultural Organization of the UN: Fisheries and Aquaculture Resources.http://www.fao.org/fishery/resources/en4
JUNE 2017COUNTING THE FISH CATCH - WHY DON’T THE NUMBERS MATCH?Check your understanding1Why do you think that countries under-report catches from artisanal and other small-scalefisheries? Why is this a problem?2The data request form sent by FAO to each country every year contains the country’s previousyear’s data. Why do you think that this could result in poor data being provided by the countries?34When we analyzed official records of catches for some countries, we sometimes found norecord of a fall in catch in the years following a natural disturbance (like a tsunami), or sociopolitical disturbance (like a civil war). Why does this indicate that the official catch data maynot have been very accurate?We applied a rule to never enter ‘NA’ (not applicable) when no data was available for a knownfishery. Instead, we used a best estimate of catch, for example by analyzing the number ofboats involved in fishing and the average catch rate of those boats. Why would it be bad forNAs to be used?5
record of a fall in catch in the years following a natural disturbance (like a tsunami), or socio-political disturbance (like a civil war). Why does this indicate that the official catch data may not have been very accurate? We applied a rule to never enter ‘NA’ (not ap