Transcription
MECHANICAL PROPERTIES OF ENGINEERINGMATERIALS1. IntroductionOften materials are subject to forces (loads) when they are used. Mechanicalengineers calculate those forces and material scientists how materials deform(elongate, compress, twist) or break as a function of applied load, time,temperature, and other conditions.Materials scientists learn about these mechanical properties by testing materials.Results from the tests depend on the size and shape of material to be tested(specimen), how it is held, and the way of performing the test. That is why we usecommon procedures, or standards.The engineering tension test is widely used to provide basic design information onthe strength of materials and as an acceptance test for the specification ofmaterials. In the tension test a specimen is subjected to a continually increasinguniaxial tensile force while simultaneous observations are made of the elongationof the specimen. The parameters, which are used to describe the stress-strain curveof a metal, are the tensile strength, yield strength or yield point, percent elongation,and reduction of area. The first two are strength parameters; the last two indicateductility.In the tension test a specimen is subjected to a continually increasing uniaxialtensile force while simultaneous observations are made of the elongation of thespecimen. An engineering stress-strain curve is constructed from the loadelongation measurements.
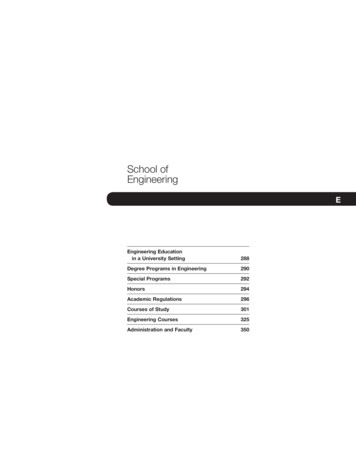
The tensile test is probably the simplest and most widely used test to characterizethe mechanical properties of a material. The test is performed using a loadingapparatus such as the Tinius Olsen machine. The capacity of this machine is10,000 pounds (tension and compression). The specimen of a given material (i.e.steel, aluminum, cast iron) takes a cylindrical shape that is 2.0 in. long and 0.5 in.in diameter in its undeformed (with no permanent strain or residual stress), ororiginal shape.The results from the tensile test have direct design implications. Many commonengineering structural components are designed to perform under tension. Thetruss is probably the most common example of a structure whose members aredesigned to be in tension (and compression).2.Concepts of Stress and StrainStress can be defined by ratio of the perpindicular force applied to a specimendivided by its original cross sectional area, formally called engineering stressTo compare specimens of different sizes, the load is calculated per unit area, alsocalled normalization to the area. Force divided by area is called stress. In tensionand compression tests, the relevant area is that perpendicular to the force. In shearor torsion tests, the area is perpendicular to the axis of rotation. The stress isobtained by dividing the load (F) by the original area of the cross section of thespecimen (AO).
The unit is the Megapascal 106 Newtons/m2.There is a change in dimensions, or deformation elongation, L as a result of atensile or compressive stress. To enable comparison with specimens of differentlength, the elongation is also normalized, this time to the length lo. This is calledstrain. So, Strain is the ratio of change in length due to deformation to the originallength of the specimen, formally called engineering strain. strain is unitless, butoften units of m/m (or mm/mm) are usedThe strain used for the engineering stress-strain curve is the average linear strain,which is obtained by dividing the elongation of the gage length of the specimen,by its original length.Since both the stress and the strain are obtained by dividing the load andelongation by constant factors, the load-elongation curve will have the same shapeas the engineering stress-strain curve. The two curves are frequently usedinterchangeably.The shape and magnitude of the stress-strain curve of a metal will depend on itscomposition, heat treatment, prior history of plastic deformation, and the strainrate, temperature, and state of stress imposed during the testing. The parametersused to to describe stress-strain curve are tensile strength, yield strength or yield
point, percent elongation, and reduction of area. The first two are strengthparameters; the last two indicate ductility.The general shape of the engineering stress-strain curverequires furtherexplanation. In the elastic region stress is linearly proportional to strain. When theload exceeds a value corresponding to the yield strength, the specimen undergoesgross plastic deformation. It is permanently deformed if the load is released tozero. The stress to produce continued plastic deformation increases with increasingplastic strain, i.e., the metal strain-hardens. The volume of the specimen remainsconstant during plastic deformation, A·L A0·L0 and as the specimen elongates, itdecreases uniformly along the gage length in cross-sectional area.Initially the strain hardening more than compensates for this decrease in area andthe engineering stress (proportional to load P) continues to rise with increasingstrain. Eventually a point is reached where the decrease in specimen crosssectional area is greater than the increase in deformation load arising from strainhardening. This condition will be reached first at some point in the specimen that isslightly weaker than the rest. All further plastic deformation is concentrated in thisregion, and the specimen begins to neck or thin down locally. Because the crosssectional area now is decreasing far more rapidly than strain hardening increasesthe deformation load, the actual load required to deform the specimen falls off andthe engineering stress likewisefracture occurs.continues to decrease until
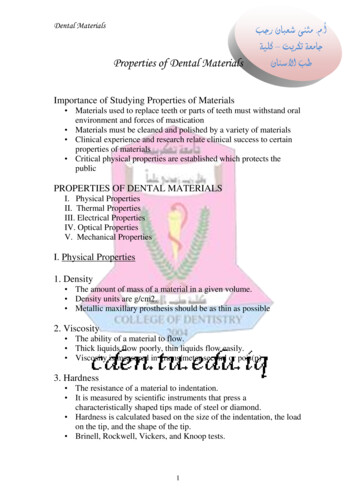
Tensile and compressional stress can be defined in terms of forces applied to auniform rod.Shear stress is defined in terms of a couple that tends to deform a joiningmember
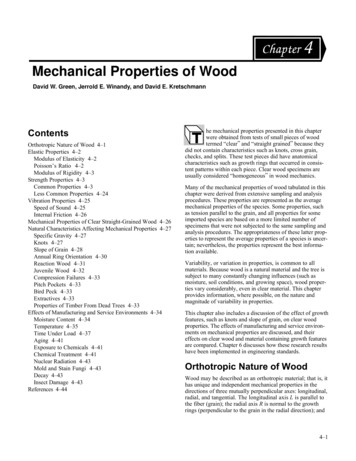
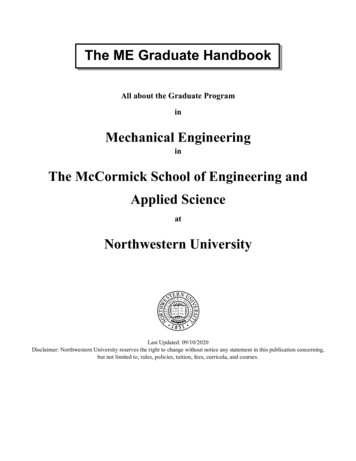
A typical stress-strain curve showing the linear region, necking and eventual break.Shear strain is defined as the tangent of the angle theta, and, in essence, determinesto what extent the plane was displaced. In this case, the force is applied as a couple(that is, not along the same line), tending to shear off the solid object that separatesthe force arms.
where ,Dx deformation in ml width of a sample in mIn this case, the force is applied as a couple (that is, not along the same line),tending to shear off the solid object that separates the force arms. In this case, thestress is againThe strain in this case is denned as the fractional change indimension of the sheared member.3.Stress—Strain Behavior3.1.Hooke’s Lawofor materials stressed in tension, at relatively low levels, stress andstrain are proportional through:oconstant E is known as the modulus of elasticity, or Young’s modulus. Measured in MPa and can range in values from 4.5x10⁴ 40x107 MPaThe engineering stress strain graph shows that the relationship between stress andstrain is linear over some range of stress. If the stress is kept within the linearregion, the material is essentially elastic in that if the stress is removed, thedeformation is also gone. But if the elastic limit is exceeded, permanentdeformation results. The material may begin to "neck" at some location and finally
break. Within the linear region, a specific type of material will always follow thesame curves despite different physical dimensions. Thus, it can say that thelinearity and slope are a constant of the type of material only. In tensile andcompressional stress, this constant is called the modulus of elasticity or Young'smodulus (E).where stress F/A in N/m2strain Dl/l unitlessE Modulus of elasticity in N/m2The modulus of elasticity has units of stress, that is, N/m2. The following tablegives the modulus of elasticity for several materials. In an exactly similar fashion,the shear modulus is defined for shear stress-strain as modulus of elasticity.3.2MaterialModulus (N/m2)Aluminum6.89 x 1010Copper11.73 X 10' 20.70 X 10¹⁰Steel2.1 x 108Sress-strain curve
The stress-strain curve characterizes the behavior of the material tested. It is mostoften plotted using engineering stress and strain measures, because the referencelength and cross-sectional area are easily measured. Stress-strain curves generatedfrom tensile test results help engineers gain insight into the constitutiverelationship between stress and strain for a particular material. The constitutiverelationship can be thought of as providing an answer to the following question:Given a strain history for a specimen, what is the state of stress? As we shall see,even for the simplest of materials, this relationship can be very complicated.In addition to providing quantitative information that is useful for the constitutiverelationship, the stress-strain curve can also be used to qualitatively describe andclassify the material. Typical regions that can be observed in a stress-strain curveare:1.Elastic region2.Yielding3.Strain Hardening4.Necking and FailureA stress-strain curve with each region identified is shown below. The curve hasbeen sketched using the assumption that the strain in the specimen ismonotonically increasing - no unloading occurs. It should also be emphasized thata lot of variation from what's shown is possible with real materials, and each of theabove regions will not always be so clearly delineated. It should be emphasizedthat the extent of each region in stress-strain space is material dependent, and thatnot all materials exhibit all of the above regions.
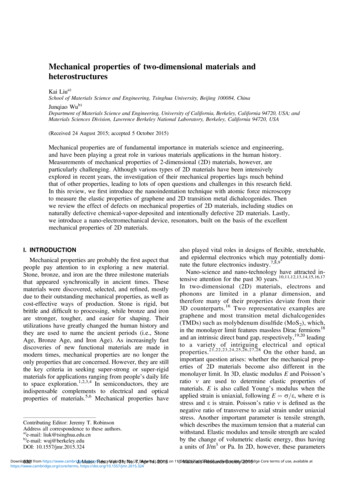
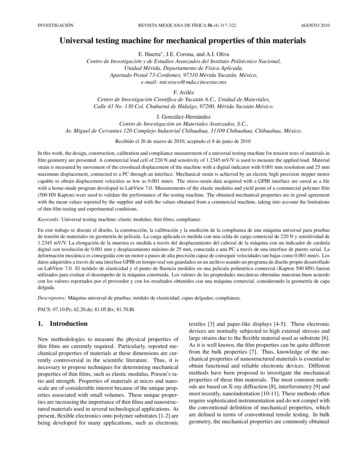
A stress-strain curve is a graph derived from measuring load (stress - σ) versusextension (strain - ε) for a sample of a material. The nature of the curve varies frommaterial to material. The following diagrams illustrate the stress-strain behaviourof typical materials in terms of the engineering stress and engineering strain wherethe stress and strain are calculated based on the original dimensions of the sampleand not the instantaneous values. In each case the samples are loaded in tensionalthough in many cases similar behaviour is observed in compression.Various regions and points on the stress-strain curve.
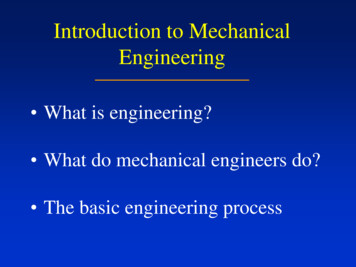
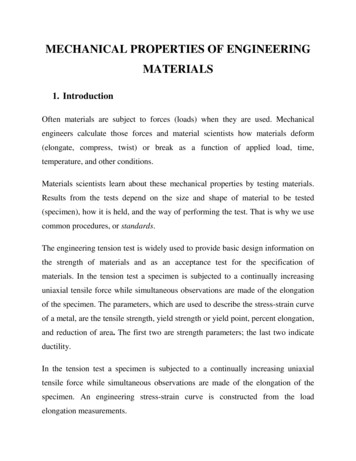
Stress vs. Strain curve for mild steel steel (Ductile material).Reference numbers are:3.3.1- Ultimate strength2- Yeild Strength4- Strain hardenining region5- Necking region3- RuputureBrittle and Ductile BehaviorThe behavior of materials can be broadly classified into two categories; brittle andductile. Steel and aluminum usually fall in the class of ductile materials. Glass,ceramics, plain concrete and cast iron fall in the class of brittle materials. The twocategories can be distinguished by comparing the stress-strain curves, such as theones shown in Figure.
Ductile and brittle material behaviorThe material response for ductile and brittle materials are exhibited by bothqualitative and quantitative differences in their respective stress-strain curves.Ductile materials will withstand large strains before the specimen ruptures; brittlematerials fracture at much lower strains. The yielding region for ductile materialsoften takes up the majority of the stress-strain curve, whereas for brittle materials itis nearly nonexistent. Brittle materials often have relatively large Young's moduliand ultimate stresses in comparison to ductile materials.These differences are a major consideration for design. Ductile materials exhibitlarge strains and yielding before they fail. On the contrary, brittle materials failsuddenly and without much warning. Thus ductile materials such as steel are anatural choice for structural members in buildings as we desire considerablewarning to be provided before a building fails. The energy absorbed (per unitvolume) in the tensile test is simply the area under the stress strain curve. Clearly,by comparing the curves in Figure. , It can be observed that ductile materials arecapable of absorbing much larger quantities of energy before failure.
Finally, it should be emphasized that not all materials can be easily classified aseither ductile or brittle. Material response also depends on the operatingenvironment; many ductile materials become brittle as the temperature isdecreased. With advances in metallurgy and composite technology, other materialsare advanced combinations of ductile and brittle constituents.Often in structural design, structural members are designed to be in service belowthe yield stress. The reason being that once the load exceeds the yield limit, thestructural members will exhibit large deformations (imagine for instance a roofsagging) that are undesirable. Thus materials with larger yield strength arepreferable.After work hardening, the stress-strain curve of a mild steel (left) resemblesthat of high-strength steel (right).
We will for now concentrate on steel, a commonly used structural material. Mildsteels have a yield strength somewhere between 240 and 360 N/mm2. When workhardened, the yield strength of this steel increases. Work hardening is the processof loading mild steel beyond its yield point and unloading as shown in Figure.When the material is loaded again, the linear elastic behavior now extends up topoint A as shown. The negative aspect of work hardening is some loss in ductilityof the material. It is noteworthy that mild steel is usually recycled. Because of this,the yield strength may be a little higher than expected for the mild steel specimenstested in the laboratory.Often in structural design, structural members are designed to be in service belowthe yield stress. The reason being that once the load exceeds the yield limit, thestructural members will exhibit large deformations (imagine for instance a roofsagging) that are undesirable. Thus materials with larger yield strength arepreferable.Generally, the stress strain distribution varies from a material to another and couldbe in different forms as follows. Consequently, the type of material and fracturepattern can be defined and determined according to its stress-strain distributiondiagram.
Various stress-strain diagrhams for different engineerin materials3.5.Yield strengthThe yield point, is defined in engineering and materials science as the stress atwhich a material begins to plastically deform. Prior to the yield point the materialwill deform elastically and will return to its original shape when the applied stressis removed. Once the yield point is passed some fraction of the deformation will bepermanent and non-reversible. Knowledge of the yield point is vital whendesigning a component since it generally represents an upper limit to the load thatcan be applied. It is also important for the control of many materials productiontechniques such as forging, rolling, or pressing.In structural engineering, yield is the permanent plastic deformation of a structuralmember under stress. This is a soft failure mode which does not normally causecatastrophic failure unless it accelerates buckling.It is often difficult to precisely define yield due to the wide variety of stress-strainbehaviours exhibited by real materials. In addition there are several possible waysto define the yield point in a given material.
Yeild occurs when dislocations first begin to move. Given that dislocations beginto move at very low stresses, and the difficulty in detecting such movement, thisdefinition is rarely used.Elastic Limit - The lowest stress at which permanent deformation can bemeasured. This requires a complex iteractive load-unload procedure and iscritically dependent on the accuracy of the equipment and the skill of the operator.Proportional Limit - The point at which the stress-strain curve becomes nonlinear. In most metallic materials the elastic limit and proportional limit areessentially the same.Offset Yield Point (proof stress) - Due to the lack of a clear border between theelastic and plastic regions in many materials, the yield point is often defined as thestress at some arbitrary plastic strain (typically 0.2%). This is determined by theintersection of a line offset from the linear region by the required strain. In somematerials there is essentially no linear region and so a certain value of plastic strainis defined instead. Although somewhat arbitrary this method does allow for aconsistent comparison of materials and is the most common.Yield point.If the stress is too large, the strain deviates from being proportional to the stress.The point at which this happens is the yield point because there the material yields,deforming permanently (plastically).Yield stress. Hooke's law is not valid beyond the yield point. The stress at theyield point is called yield stress, and is an important measure of the mechanicalproperties of materials. In practice, the yield stress is chosen as that causing a
permanent strain of 0.002, which called as proof stresss. The yield stress measuresthe resistance to plastic deformation.The yield strength is the stress required to produce a small-specified amount ofplastic deformation. The usual definition of this property is the offset yieldstrength determined by the stress corresponding to the intersection of the stressstrain curve and a line parallel to the elastic part of the curve offset by a specifiedstrain. In the United States the offset is usually specified as a strain of 0.2 or 0.1percent (e 0.002 or 0.001).A good way of looking at offset yield strength is that after a specimen has beenloaded to its 0.2 percent offset yield strength and then unloaded it will be 0.2percent longer than before the test. The offset yield strength is often referred to inGreat Britain as the proof stress, where offset values are either 0.1 or 0.5 percent.The yield strength obtained by an offset method is commonly used for design andspecification purposes because it avoids the practical difficulties of measuring theelastic limit or proportional limit.
Determination of proof stressSome materials have essentially no linear portion to their stress-strain curve, forexample, soft copper or gray cast iron. For these materials the offset method cannotbe used and the usual practice is to define the yield strength as the stress to producesome total strain, for example, e 0.005.Determination of Yield Strength in Ductile MaterialsIn many materials, the yield stress is not very well defined and for this reason astandard has been developed to determine its value. The standard procedure is toproject a line parallel to the initial elastic region starting at 0.002 strain. The 0.002strain point is often referred to as theoffset strain point. The intersection ofthis new line with the stress-strain curve then defines the yield strength as shown inFigure .
4.Elastic Properties of MaterialsWhen the stress is removed, the material returns to the dimension it had before theload was applied. Valid for small strains (except the case of rubbers).Deformation is reversible, non permanent
Materials subject to tension shrink laterally. Those subject to compression, bulge.The ratio of lateral and axial strains is called the Poisson's ratio.When a material is placed under a tensile stress, an accompanying strain is createdin the same direction.Poisson’s ratio is the ratio of the lateral to axial strains.The elastic modulus, shear modulus and Poisson's ratio are related by E 2G(1 ν) Theoretically, isotropic materials will have a value for Poisson’s ratio of0.25. 9.The maximum value of ν is 0.5Most metals exhibit values between 0.25 and 0.35Plastic deformation.When the stress is removed, the material does not return to its previous dimensionbut there is a permanent, irreversible deformation.
For metallic materials, elastic deformation only occurs to strains of about0.005. After this point, plastic (non-recoverable) deformation occurs, andHooke’s Law is no longer valid.On an atomic level, plastic deformation is caused by slip, where atomic bonds arebroken by dislocation motion, and new bonds are formed.5.AnelasticityHere the behavior is elastic but not the stress-strain curve is not immediatelyreversible. It takes a while for the strain to return to zero. The effect is normallysmall for metals but can be significant for polymers.6.Tensile strength.When stress continues in the plastic regime, the stress-strain passes through amaximum, called the tensile strength (sTS) , and then falls as the material starts todevelop a neck and it finally breaks at the fracture point.Note that it is called strength, not stress, but the units are the same, MPa.For structural applications, the yield stress is usually a more important propertythan the tensile strength, since once the it is passed, the structure has deformedbeyond acceptable limits.The tensile strength, or ultimate tensile strength (UTS), is the maximum loaddivided by the original cross-sectional area of the specimen.
The tensile strength is the value most often quoted from the results of a tensiontest; yet in reality it is a value of little fundamental significance with regard to thestrength of a metal. For ductile metals the tensile strength should be regarded as ameasure of the maximum load, which a metal can withstand under the veryrestrictive conditions of uniaxial loading. It will be shown that this value bearslittle relation to the useful strength of the metal under the more complex conditionsof stress, which are usually encountered.For many years it was customary to base the strength of members on the tensilestrength, suitably reduced by a factor of safety. The current trend is to the morerational approach of basing the static design of ductile metals on the yield strength.However, because of the long practice of using the tensile strength to determine thestrength of materials, it has become a very familiar property, and as such it is avery useful identification of a material in the same sense that the chemicalcomposition serves to identify a metal or alloy.Further, because the tensile strength is easy to determine and is a quitereproducible property, it is useful for the purposes of specifications and for qualitycontrol of a product. Extensive empirical correlations between tensile strength andproperties such as hardness and fatigue strength are often quite useful. For brittlematerials, the tensile strength is a valid criterion for design.7.DuctilityThe ability to deform before braking. It is the opposite of brittleness. Ductility canbe given either as percent maximum elongation emax or maximum area reduction.
At our present degree of understanding, ductility is a qualitative, subjectiveproperty of a material. In general, measurements of ductility are of interest in threeways:1. To indicate the extent to which a metal can be deformed without fracture inmetal working operations such as rolling and extrusion.2. To indicate to the designer, in a general way, the ability of the metal to flowplastically before fracture. A high ductility indicates that the material is"forgiving" and likely to deform locally without fracture should the designererr in the stress calculation or the prediction of severe loads.3. To serve as an indicator of changes in impurity level or processingconditions. Ductility measurements may be specified to assess materialquality even though no direct relationship exists between the ductilitymeasurement and performance in service.The conventional measures of ductility that are obtained from the tension test arethe engineering strain at fracture ef (usually called the elongation) and thereduction of area at fracture q. Both of these properties are obtained after fractureby putting the specimen back together and taking measurements of Lf and Af .Because an appreciable fraction of the plastic deformation will be concentrated inthe necked region of the tension specimen, the value of ef will depend on the gage
length L0 over which the measurement was taken. The smaller the gage length thegreater will be the contribution to the overall elongation from the necked regionand the higher will be the value of ef. Therefore, when reporting values ofpercentage elongation, the gage length L0 always should be given.The reduction of area does not suffer from this difficulty. Reduction of area valuescan be converted into an equivalent zero-gage-length elongation e0. From theconstancy of volume relationship for plastic deformation A*L A0*L0, we obtainThis represents the elongation based on a very short gage length near the fracture.Another way to avoid the complication from necking is to base the percentageelongation on the uniform strain out to the point at which necking begins. Theuniform elongation eu correlates well with stretch-forming operations. Since theengineering stress-strain curve often is quite flat in the vicinity of necking, it maybe difficult to establish the strain at maximum load without ambiguity. In this casethe method suggested by Nelson and Winlock is useful.8.ResilienceThe resilience of the material is the triangular area underneath the elastic region ofthe curve. Resilience generally means the ability to recover from (or to resist beingaffected by) some shock, insult, or disturbance. However, it is used quitedifferently in different fields.In physics and engineering, resilience is defined as the capacity of a material toabsorb energy when it is deformed elastically and then, upon unloading to have
this energy recovered. In other words, it is the maximum energy per volume thatcan be elastically stored. It is represented by the area under the curve in the elasticregion in the Stress-Strain diagram.Modulus of Resilience, Ur, can be calculated using the following formula:,where σ is yield stress, E is Young's modulus, and ε is strain.The ability of a material to absorb energy when deformed elastically and to returnit when unloaded is called resilience. This is usually measured by the modulus ofresilience, which is the strain energy per unit volume required to stress the materialfrom, zero stress to the yield stress.The ability of a material to absorb energy when deformed elastically and to returnit when unloaded is called resilience. This is usually measured by the modulus ofresilience, which is the strain energy per unit volume required to stress thematerial from, zero stress to the yield stress s. The strain energy per unit volumefor uniaxial tension isTable 1 gives some values of modulus of resilience for different materials.Table 1. Modulus of resilience for various materials
Materials0, psi30 1064500033,7High-carbon spring steel 30 10614000032010,5 1061800017,0Cooper16 10640005,3Rubber1503003000,5 10620004,0Medium-carbon steelDuraluminiumAcrylic polymer9.Modulus of resilience,E, psiUrToughnessThe area underneath the stress-strain curve is the toughness of the material- i.e. theenergy the material can absorb prior to rupture. It also can be defined as theresistance of a material to crack propogation.In materials science and metallurgy, toughness is the resistance to fracture of amaterial when stressed. It is defined as the amount of energy that a material canabsorb before rupturing, and can be found by finding the area (i.e., by taking theintegral) underneath the stress-strain curve.The ability of a metal to deform plastically and to absorb energy in the processbefore fracture is termed toughness. The emphasis of this definition should beplaced on the ability to absorb energy before fracture. Recall that ductility is ameasure of how much something deforms plastically before fracture, but justbecause a material is ductile does not make it tough. The key to toughness is a
good combination of strength and ductility. A material with high strength and highductility will have more toughness than a material with low strength and highductility. Therefore, one way to measure toughness is by calculating the area underthe stress strain curve from a tensile test. This value is simply called “materialtoughness” and it has units of energy per volume. Material toughness equates to aslow absorption of energy by the material.The toughness of a material is its ability to absorb energy in the plastic range. Theability to withstand occasional, stresses above the yield stress without fracturing isparticularly desirable in parts such as freight-car couplings, gears, chains, andcrane hooks. Toughness is a commonly used concept, which is difficult to pindown and define. One way of looking at toughness is to consider that it is the totalarea under the stress-strain curve. This area is an indication of the amount of workper unit volume, which can be done, on the material without causing it to rupture.The following Figure shows the stress-strain curves for high- and low-toughnessmaterials. The high-carbon spring steel has a higher yield strength and tensilestrength than the medium-carbon structural steel. However, the structural steel ismore ductile and has a greater total elongation. The total area under the stresstraincurve is greater for the structural steel, and therefore it is a tougher material. Thisillustrates that toughness is a parameter that comprises both strength and ductility.The crosshatched regions in Figure indicate the modulus of resilience for eachsteel. Because of its higher yield strength, the spring steel has the greaterresilience.Several mathematical approximations for the area under the stress-strain curvehave been suggested. For ductile metals that have a stress-strain curve like that ofthe structural steel, the area under the curve can be approximated by either of thefollowing equations:
For brittle materials the stress-strain curve is sometimes assumed to be a parabola,and the area under the curve is given byAll these relations are only approximations to the area under the stress-straincurves. Further, the curves do not represent the true behavior in the plastic range,since they are all based on the original area of the specimen.
Comparison between resilience and toughness of metals9.1.Impact ToughnessThree of the toughness properties that will be discussed in
strain. So, Strain is the ratio of change in length due to deformation to the original length of the specimen, formally called engineering strain. strain is unitless, but often units of m/m (or mm/mm) are used The strain