Transcription
1Tensile Test ExperimentME 3228: Materials and Mechanics LabSection: 519Tyler MyersDue: March 6th, 2014Turn in to: Cargi M, Bakirci
2SummaryFor the Tensile Test Experiment, data was collected from using an MTS machineand lab computer. The data collected was the position and load of what was going onto a sample material. The materials used were two different types of aluminum andsteel. The simple tensile test was performed on each of the four samples. With thedata found in the experiment, calculations of stress and strain were done, finding thedifferent material properties of the four samples. With the stress and strain values,graphs were created to illustrate the experiment, and with those graphs some of thematerial properties were directly found. The material properties consisted ofelasticity, yield and ultimate strengths, resilience, toughness, percentage ofelongation, and percentage of reduction in area of the samples. As for most of thematerial properties, having to have been calculated, charts were drawn up for thecomparison of the experimental data to the real world reference data provided by anycommon engineering book. Details of the experiment and its results will be providedlater in the report, along with all the tables and graphs generated from theexperiment’s data.
3Table of ContentsList of Figures4List of Tables5List of Equations 6Summary2Introduction7Theory7Test Description ndix23
4List of FiguresFigure 1: Tensile Test in Action7Figure 2: The MTS Machine10Figure 3: Four Different Sample Materials10Figure 4: The Stress-Strain Graph of ASIS 101812Figure 5: The Stress-Strain Graph of AISI 104512Figure 6: The Stress-Strain Graph of Al 606113Figure 7: The Stress-Strain Graph of Al 707513Figure 8: The .2% Offset Graph of AISI 101814Figure 9: The .2% Offset Graph of AISI 104514Figure 10: The .2% Offset Graph of Al 606115Figure 11: The .2% Offset Graph of Al 707515Figure 12: The Young’s Modulus Graph of AISI 101816Figure 13: The Young’s Modulus Graph of AISI 104517Figure 14: The Young’s Modulus Graph of AL 606117Figure 15: The Young’s Modulus Graph of Al 707518Figure 16: The Elasticity Comparison Chart19Figure 17: The Yield Strength Comparison Chart19Figure 18: The Ultimate Strength Comparison Chart20Figure 19: The Comparison between Ductile and Brittle Fractures21
5List of TablesTable 1: Initial and Final Measurements of the Sampled Material11Table 2: Experimental Mechanical Properties of Four Samples23Table 3: The Comparison Table between the Experimental and Referenced Data 23
6List of EquationsEquation 1: The Stress Equation𝐹𝜎 𝐴𝑜Equation 2: The Strain Equation𝜀 𝑙 𝑙0𝑙0Equation 3: The Elasticity Equation𝐸 𝜎 𝜀Equation 4: Ultimate Strength Equation𝜎𝑢 𝐹𝑚 /𝐴0Equation 5: Resilience Equation1𝑈𝑟 2 𝜎𝑦 𝜀𝑦Equation 6: Toughness Equation1𝑈𝑇 (𝜎𝑦 𝜎𝑢 ) 𝜀𝑓2Equation 7: Percentage of Elongation𝑃𝑒𝑟𝑐𝑒𝑛𝑡𝑎𝑔𝑒 𝑜𝑓 𝐸𝑙𝑜𝑛𝑔𝑎𝑡𝑖𝑜𝑛 𝑙𝑙0 100%Equation 8: Percentage of Reduction in Area𝑃𝑒𝑟𝑐𝑒𝑛𝑡𝑎𝑔𝑒 𝑜𝑓 𝑟𝑒𝑑𝑢𝑐𝑡𝑖𝑜𝑛 𝑖𝑛 𝑎𝑟𝑒𝑎 𝐴𝐴0 100%
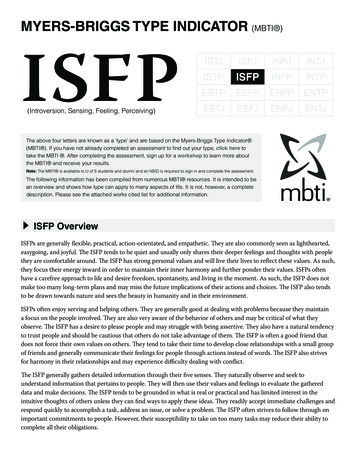
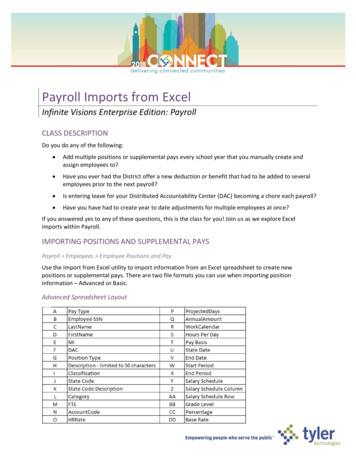
7IntroductionThis experiment consisted of measuring the mechanical properties of twodifferent types of materials using a tensile testing machine. The purpose of thisexperiment is to recreate a real world application of what these materials might besubjected to when the materials are put to work. These experiments are done oftento construct a set of data for all engineers to be able to have quick access to correctinformation and material specifications and properties. So with this type ofexperiment, the elastic modulus, the ultimate strength, and the yield strength can becalculated and compared to old references from previous experiments to see how thematerial properties have changed, if any. The two materials being tested in thisexperiment will be steel and aluminum. Those two types of materials have also beensplit into two sub-types: Steel: 1018 and 1045, Al: 7075 and 6061.TheoryThe idea of this tensile test experiment is to calculate the specific materialproperties from each material tested and see how they compare to a standardreference of the same material’s properties already provided in the real world. Belowis a snap shot of an actual tensile test being taken on a sample material.Figure 1: Tensile Test in Action
8The specific properties the experiment will provide will be elasticity, yield andultimate strengths, resilience, toughness, percentage of elongation, and percentageof reduction in area of the samples. Finding these will have to come from finding thetensile stress of the experiment being performed. The tensile stress, σ, is calculatedthrough this equation:𝐹𝜎 𝐴𝑜(Equ. 1)Where F is the load being applied and A0 is the original cross-sectional area at the gagesection of the sample. Then the strain, ε, is also needed for calculations purposes tomeasure what is being done to the sample in terms of it being stretched out. Theengineering strain is calculated by:𝜀 𝑙 𝑙0(Equ. 2)𝑙0Here, l is the new gage length and l0 is the original gage length. With the calculationsof both the stress and strain of the sample, a Stress vs. Strain graph can then be createdto see how the sample acts while the tensile test is being performed. After setting upa proper stress-strain graph, the calculation of the modulus of elasticity, E, can befound using the simple slope definition:𝐸 𝜎 𝜀(Equ. 3)With the elasticity, obtaining the yield strength is done by performing a .2% offset onthe stress-strain graph, and figuring out where the two lines intersect. The Ultimatetensile strength, σu, is found by:𝜎𝑢 𝐹𝑚 /𝐴0(Equ. 4)With Fm being the maximum load applied to the sample. Resilience, or the energyabsorbed by the sample when it is being deformed elastically, is found by using:1𝑈𝑟 2 𝜎𝑦 𝜀𝑦(Equ. 5)
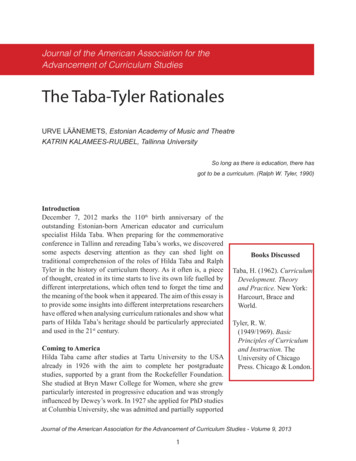
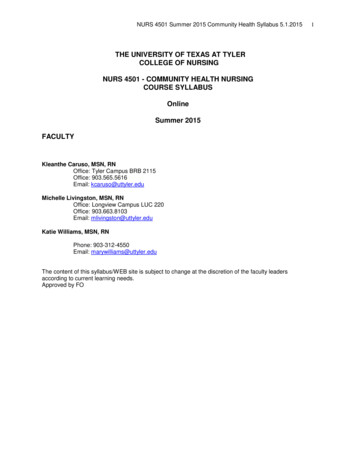
9Where σy is the yield strength and εy is the strain at which the yield strength is locatedfor the sample. Finding the toughness, UT, can be found by:1(Equ. 6)𝑈𝑇 2 (𝜎𝑦 𝜎𝑢 ) 𝜀𝑓The strain level at fracture is represented by ε f. Ductility, or the ability of the sampleto be deformed before complete fracture, can be measured by the percentage ��� 𝑜𝑓 𝐸𝑙𝑜𝑛𝑔𝑎𝑡𝑖𝑜𝑛 𝑙𝑙0 100%(Equ. 7)A material with a lower ductility can be classified as brittle, and a material with highdensity can be classified as ductile. Also the percentage of area reduction is anotherform of measuring the ductility of the material. This can be calculated by:𝑃𝑒𝑟𝑐𝑒𝑛𝑡𝑎𝑔𝑒 𝑜𝑓 𝑟𝑒𝑑𝑢𝑐𝑡𝑖𝑜𝑛 𝑖𝑛 𝑎𝑟𝑒𝑎 𝐴𝐴0 100%(Equ. 8)Here, Ao is the original cross-sectional area of the sample. With all these propertiescoming from a simple tensile test, there can be a lot said about different types ofmaterials when the test is completed.Test DescriptionThis test will consist of experimenting on four different types of materials using aMTS tensile testing machine, shown below.
10Figure 2: The MTS MachineThe samples being tested in this experiment are AISI 1018, AISI 1045, Aluminum 6061T6, Aluminum 7075-T24.Figure 3: Four Different Sample Materials
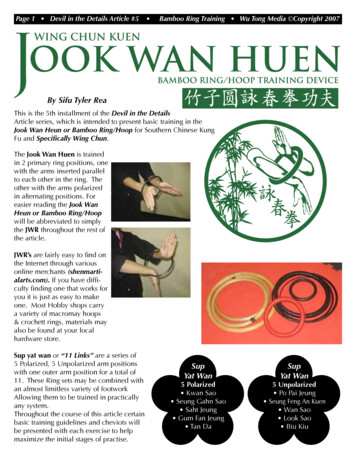
11During the Tensile Test experiment, the four samples were measured for their originalgage length and diameters. Each sample was then put in and clamped down by theupper and lower hydraulic grips. Then using the lab computer, the MTS machine wasactivated, calibrated, and began pulling the sample down with the lower grip while theupper grip remained stationary. During this, the computer stores the data of theposition of the grips, and the load that is being applied to the sample at the currenttime. The sample was then pulled until fracture. Once fracture was reached, themachine was deactivated. The sample was then measured once more for its final gagelength and diameters.ResultsThe first thing in this experiment was to document the initial gage length anddiameters of the sample, immediately following fracture of the sample, the final gagelength and diameters were taken.Table 1: Initial and Final Measurements of the Sampled MaterialSample1018104560617075Gage 640.58Gage 4.48Cross-SectionalArea ter the experiment, calculations to find the stress and strain were done on eachsample. With those stress and strain values, a Stress-Strain graph was created persample. Shown next are the four samples Stress-Strain graphs.
12Stress vs Strain Graph, 1018900800Stress (Pa)700600500400Exp. gure 4: The Stress-Strain Graph of ASIS 1018Stress vs Stain Graph , 10451200Stess (MPa)1000800600Exp. Data4002000-0.0200.020.040.060.080.1StrainFigure 5: The Stress-Strain Graph of AISI 10450.12
13Stress vs Strain Graph, 6061700600Stress (MPa)500400300Exp. Data2001000-0.0500.050.10.150.20.25StrainFigure 6: The Stress-Strain Graph of Al 6061Stress vs Strain Graph, 7075700600Stress (MPa)500400300Exp. Data200100000.020.040.060.080.1StrainFigure 7: The Stress-Strain Graph of Al 70750.12
14With the Stress-Strain graphs generated per sample, a .2% Offset graph was created tofind the values of the yield strength of the samples.2% Offset Graph, 1018900800700Stress (MPa)600500400Exp. Data300.2% 0120.0140.0160.0180.02StainFigure 8: The .2% Offset Graph of AISI 1018.2 % Offset Graph, 1045700600Stress (MPa)500400Exp. Data300.2% .0140.016StrainFigure 9: The .2% Offset Graph of AISI 10450.018
15.2% Offset Graph, 6061500450400350Stress (MPa)300250Exp. Data200.2% Offset150100500-0.005-50 00.0050.010.0150.020.0250.030.035StrainFigure 10: The .2% Offset Graph of Al 6061.2% Offset Graph, 7075700600Stress (MPa)500400Exp. Data300.2% StrainFigure 11: The .2% Offset Graph of Al 70750.045
16To do so, a simple calculation of Young’s Modulus had to be done in order to find, E,the elasticity of the sample to create the .2% Offset Graph. The Young’s Modulus wascalculated by finding the slope of the original data of stress and strain using up to thefirst one hundred to two hundred megapascals of stress for ease of finding theequation of the line. The following four graphs illustrate the linear relationship of theYoung’s Modulus for the samples.Young's Modulus Graph, 1018200180Stress (MPa)160140120100Exp. Data80Linear (Exp. 0030.0035StrainFigure 12: The Young’s Modulus Graph of AISI 1018
17Young's Modulus Graph, 1045140120Stress (MPa)10080Exp. Data60Linear (Exp. trainFigure 13: The Young’s Modulus Graph of AISI 1045Young's Modulus Graph, 6061180160Stress (MPa)14012010080Exp. Data60Linear (Exp. ainFigure 14: The Young’s Modulus Graph of AL 6061
18Young's Modulus Graph, 70758070Stress (MPa)605040Exp. Data30Linear (Exp. e 15: The Young’s Modulus Graph of Al 7075With the all the data taken from the stress-strain graphs, a comparison of theexperimental elasticity, yield strength, and ultimate strength of the four individualsamples were taken to a reference data provided by common engineering charts usedon an everyday basis. Here is a comparison of the elasticity for each of the foursamples.
19Elasticity 101810456061Exp.7075Ref.Figure 16: The Elasticity Comparison ChartNext is the comparison of the Yield strengths for the four samples.Yield Strength 1810456061Exp.7075Ref.Figure 17: The Yield Strength Comparison Chart
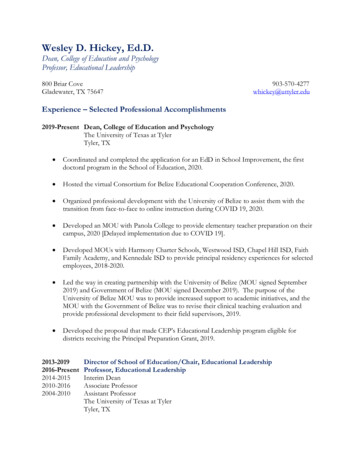
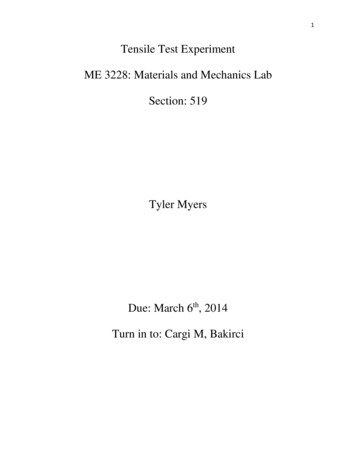
20Lastly, illustrated below is the comparison of the Ultimate Strengths of the foursamples.Ultimate Strength 0101810456061Exp.7075Ref.Figure 18: The Ultimate Strength Comparison ChartDiscussionThere appears to be a clear difference between the two steel and the twoaluminum materials upon completion of the results for the experiment. When talkingabout the two steel materials, AISI 1045 shows a clear difference in its ability to hold agreater force when compared to the AISI 1018. Its ultimate strength is greater, but itsyield strength is lower. AISI 1045 also has a greater elasticity, meaning it is less brittle.When comparing the two aluminum materials, the Al 7075’s yield and ultimatestrengths are higher than the Al 6061. But the elasticity of the Al 6061 is greater thanthe Al 7075 as far as the experimental data, but in a perfect analysis, the Al 7075 shouldhave a greater elasticity, meaning that the Al 6061 is less ductile than the Al 7075.Looking at the aluminum and steel materials together, even from the tensile testexperimental data, the steel’s properties of elasticity, yield and ultimate strengths arefar beyond those of the aluminums. Which makes sense knowing that the steel shouldbe far more brittle and the aluminum more ductile. With being more brittle, the steel
21should come out fractured with a more of a flat break, and the aluminum being moreductile, should come out with a more slanted break.Figure 19: The Comparison between Ductile and Brittle FracturesConclusionThe tensile test made it easy to see first-hand what would happen to differenttypes of material when under a tensile load. Having not been able to perform anythinglike this before, the test made a connection from the conceptual schoolwork to thephysical application. The data achieved seemed a bit off, most likely due to somephysical and mechanical error while undertaking the experiment. Overall, the tensiletest was enjoyable.
22References1. Chaudhuri, Jharna, 2014. Material and Mechanics Laboratory Experiments,Texas Tech University, Cognella, INC., United States of America
For the Tensile Test Experiment, data was collected from using an MTS machine and lab computer. The data collected was the position and load of what was going on to a sample material. The materials used were two different types of aluminum and steel. The simple tensile test was performed on each of the four samples. With the data found in the experiment, calculations of stress and strain were .