Transcription
The Paradox of U.S. Public Education:Better Than Ever, but Not Good EnoughBy: Malbert Smith, Ph.D., Jason Turner, Steve Lattanzio and Andrew AshleyVISIT WWW.METAMETRICSINC.COM FOR MORE INFORMATIONSeptember 2015
About MetaMetrics MetaMetrics, founded in 1984, is an educational measurement and technology organizationwhose mission is to connect assessment with instruction. The company’s distinctiveframeworks for English and mathematics bring meaning to measurement and are used bymillions to differentiate instruction, individualize practice and improve learning across alllevels of education.The Paradox of U.S. Public Education1
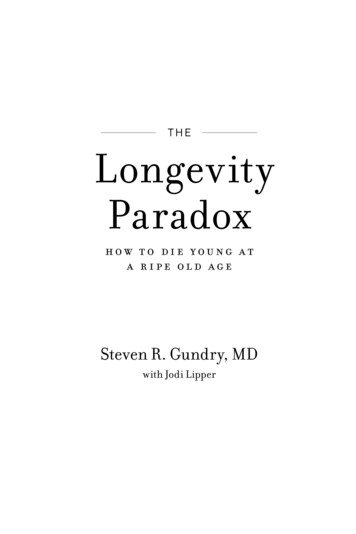
The Paradox of U.S. Public EducationSince 1973, Gallup has annually polled the American public to gauge their confidence in variouspublic institutions. The institutions in question cut across a wide swath of public life—encompassingsuch entities as congress, banks, small business, the military and the police. Included in the Gallup surveyare questions about confidence in K–12 public education. In 1973, the inaugural year for the survey, 58%of the respondents expressed a ‘great deal’ or ‘quite a lot’ of confidence in public schools. Unfortunately,that high degree of confidence has been steadily eroding ever since. Other than a few brief upticks inconfidence in the late 80s and early 90s, the confidence of the American public in K–12 education hasbeen trending downward at an alarming rate (Gallup, 2015).Figure 160Public School 01995Year20002005201020152020Sadly, the 2014 Gallup survey brought the lowest degree of public confidence since thesurvey began. Just 26% of respondents expressed confidence in public education (Gallup, 2014).However, it is worth noting that declining confidence in public education reflected the growingcynicism of citizens across most institutions. With the exception of the military and small business,Americans have been steadily losing confidence in our public institutions at an alarming rate.The Paradox of U.S. Public Education2
In fact, confidence in Congress hit an all-time low in 2014 by plunging into the single digits (a historicalfirst) at seven percent (Gallup, 2014). This year Congress fared about the same, ticking up just a notch toeight percent (Gallup, 2015).For 2015, however, the number of Americans expressing a ‘great deal’ or ‘quite a lot’ of confidencein public schools experienced a slight rise from 26% to 31% (Jones, 2015). Though modest, this movementupward is statistically significant and, we hope, could portend an upward trend. Of course, we shouldbe cautious in concluding one data point connotes a consistent positive swing. Yet given the assiduousperformances of our public educators and policy-makers around the country, we hope that this slightimprovement notes the beginning of a trend as citizens come to recognize and find confidence in thesuccessful work being done.Since 2012 we have responded to each Gallup Public Confidence Survey, analyzing educationaldata in an attempt to explain the public’s disheartening lack of confidence (see here, here and here). Ourwork was informed by a pair of questions: within the realm of public education are things really as dire asthe low level of public confidence indicates, and, similarly, are public perceptions tethered to the reality ofour students’ academic performance? By our analysis, we have found that U.S. educational performanceis, in fact, improving, and that public education has made steady progress when considered across a widerange of metrics (Turner, Smith, & Lattanzio, 2014). The fact that public confidence continues to erodedespite educational outcomes improving over the last three decades, argues for an explanation beyondjust the performance of our students.In our earlier papers we argued that the reasons for the decline are multi-layered andvarious, having little to do with the actual performance of U.S. students. When it comes to trust inour leaders and faith in some of our long-standing institutions, the Gallup results point to a growingcynicism and distrust among our citizens. In recent years, the negative and political firestorm ignitedby the Common Core State Standards (CCSS) helped fuel the perception that public educationwas headed in the wrong direction. During that same period, many states adopted third-gradereading policies that mandated third grade students be reading on grade level or be retained.The Paradox of U.S. Public Education3
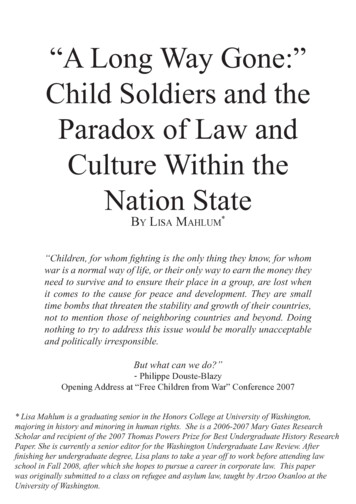
Those policies were well-intentioned and bolstered by research demonstrating the importance of readingon grade level by the end of third grade. Nevertheless, for some parents the consequences of thosepolicies seemed draconian and punitive, feeding the idea that something must be terribly wrong in thesphere of public education (see Turner, Smith, & Lattanzio, 2014 for a detailed analysis).This year, by contrast, a slightly higher percentage of respondents reported ‘a great deal’ or‘quite a lot’ of confidence in K–12 public education (Jones, 2015). That is good news. When we considereducational performance across a wide range of metrics we find that the U.S. has been steadily improvingfor at least three decades. Consider, for example, our performance on the National Assessment ofEducational Progress Long Term Trends (NAEP LTT). In Figure 2 we mapped the NAEP LTT math andreading performances onto the public confidence graph as a way to contrast academic performance andpublic perception. Although new long-term trends from NAEP data will not be available until 2016, Figure2 illustrates performance for both nine-year-old and 13-year-old students. Despite small dips throughoutthe 1980s, scores for nine- and 13-year-old students rebounded in the 1990s and have been rising eversince to currently sit at an all-time high for both reading and mathematics (National Center for EducationStatistics, 2010).Figure 260Public School Confidence55NAEP Reading (13-year-olds)45NAEP Math (9-year-olds)40ScorePercent50NAEP Math (13-year-olds)3530251970NAEP Reading 0152020The Paradox of U.S. Public Education4
Graduation rates provide even more evidence of success. Graduation rates in the U.S. have risensteadily over the past 20 years. In 1999 the graduation rate was 66%, and by 2009 it had risen to 73%(National Center for Education Statistics, 2013). By 2013 graduation rates had risen to 81%—a 15 pointjump in just 14 years (National Center for Education Statistics, 2014).Additionally, the drop-out rate has declined from 17% in 1967 to just seven percent in 2013, evenas the number of Title 1 schools and low-income students have increased (Child Trends Data Bank, 2014).In 2002, there were around 47,000 schools identified as Title 1 schools in the U.S. (U.S. Department ofEducation, 2002). Ten years later, that number had risen to almost 67,000 (National Center for EducationStatistics, 2012). In 1989, less than 32% of students were identified as low-income. Twenty-four years laterthat number had risen to 51% (Bidwell, 2015). In other words, even as the number of low-income studentsincreases, U.S. educators continue to reduce the drop-out rate and graduate even higher numbers ofstudents.In addition to higher graduation rates and lower drop-out rates, a greater number of U.S. studentsare enrolling in Advanced Placement (AP) courses. In 2013, for example, over 2.2 million students tookan AP exam, of which 275,864 were low-income students. That is a dramatic jump from 10 years earlier in2003 when less than 59,000 students took an AP exam. In 2014, the number of AP exams continued to rise,growing by almost seven percent to 4.1 million exams. Even more compelling is the fact that the numberof students scoring a three or higher continues to climb. In 2003, only 12% of the test takers scored athree or higher. Last year, in 2014, that number was close to 60% (College Board, 2015).While it is true that our domestic performance offers much to celebrate, many have argued(including us—see here and here) that our performance on the international stage has been less thanstellar. While the U.S. has made incremental gains in some areas, we have lost ground in others. In termsof international comparisons, there are three major assessments that are most often cited: Trends inInternational Mathematics and Science Study, Progress in International Reading Literacy Study and theProgram for International Student Assessment.The Paradox of U.S. Public Education5
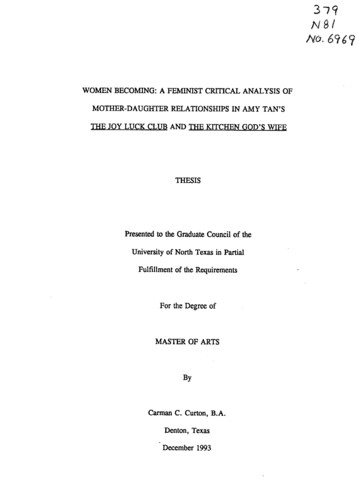
A review of the Trends in International Mathematics and Science Study (TIMSS) reveals that theactual score in mathematics for U.S. fourth-grade students has risen rather dramatically from a score of518 in 1995 to 541 in 2011.1 While not as dramatic, U.S. eighth-grade student’s average math score hasrisen from 492 in 1995 to 509 in 2011.2 On the science front scores for fourth-grade students have beenrelatively stable over time, whereas scores for eighth-grade students have risen from 513 in 1995 to 525in 2011.3 Scores and international rankings from TIMSS are displayed in Table 1 (National Center forEducation Statistics).Table 1Trends in International Mathematics and Science Study (TIMSS)Mathematics4th Grade1995Science8th Grade4th Grade8th GradeU.S. ScoreRankingU.S. ScoreRankingU.S. ScoreRankingU.S. 25447/5052510/42TIMSS fourth-grade math scores have had statistically significant increases (2-tail, alpha 0.05) between consecutiveadministrations 2003 – 2007 (p 1.00) and 2007 – 2011 (p 1.00), and also between the first and last administration,1995 – 2011 (p 1.00).2TIMSS eighth-grade math scores had a statistically significant increase (2-tail, alpha 0.05) between the first and lastadministration, 1995 – 2011 (p 1.00).3TIMSS eighth-grade science scores have had statistically significant increases (2-tail, alpha 0.05) between consecutiveadministrations 1999 – 2003 (p 0.97) and also between the first and last administration, 1995 – 2011 (p 0.95).1The Paradox of U.S. Public Education6
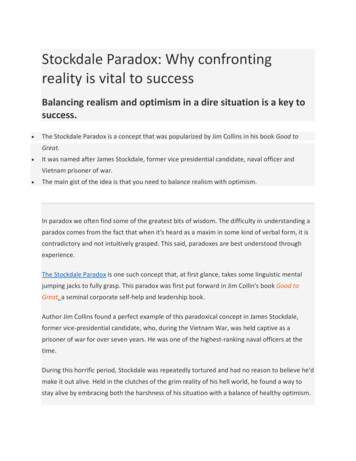
The Progress in International Reading Literacy Study (PIRLS), which focuses exclusively on readingscores of fourth graders has fewer data points. PIRLS has only been administered three years (2001, 2006and 2011). While U.S. fourth graders’ average score fell from 542 in 2001 to 540 in 2006, those scoresrebounded to 556 by 2011.4 This improvement strengthened our relative ranking as well, moving us froma position of 14th out of 39 countries to six out of 46 countries (National Center for Education Statistics).The next PIRLS will be administered in 2016. The results will be published in December, 2017.Table 2Progress in International Reading Literacy Study (PIRLS)4th GradeU.S. ScoreRanking20015429/35200654014/3920115566/45The third international assessment, the Program for International Student Assessment (PISA),which assesses 15-year-old students in reading, mathematics and science was last administered in 2012.U.S. students’ average scores in reading, math and science have been relatively stable over the variousadministrations from 2003 to 2012. Our reading scores over three testing periods have varied from 495 to500; our science scores have been as low as 489 and as high as 502; and our math scores have been as lowas 474 and as high as 487. Our scores and ranking on PISA tests are displayed in Table 3. It is important tonote that these rankings are highly influenced not only by our performance, but the composition of theparticipating countries.5PIRLS fourth-grade reading scores have had statistically significant increases (2-tail, alpha 0.05) between consecutiveadministrations 2006 – 2011 (p 1.00) and also between the first and last administration, 2001 – 2011 (p 1.00).5PISA 15-year-old math scores had a statistically significant decrease (2-tail, alpha 0.05) between the consecutiveadministrations 2000 – 2003 (p 0.96), relative to the OECD average.4The Paradox of U.S. Public Education7
Table 3Program for International Student Assessment ever, as Diane Ravitch has argued, we should be very careful about placing too much weighton these international results. If one controls for poverty, U.S. students fare just as well, if not better, thanstudents from any of the other high-ranking countries.Second, American students in schools with low poverty—the schools where less than 10percent of the students were poor—had scores that were equal to those of Shanghai andsignificantly better than those of high-scoring Finland, the Republic of Korea, Canada, NewZealand, Japan, and Australia. In U.S. schools where less than a quarter of the studentswere eligible for free or reduced-price lunch (the federal definition of poverty), the readingscores were similar to those of students in high-performing nations. (Ravitch, 2013)Ravitch argues that the idea that our poor performance on international assessments augers direeconomic consequences for our nation has simply proven to be empirically false. Ravitch referencesKeith Baker, a retired analyst from the U.S. Department of Education, whose article “Are InternationalTests Worth Anything?” appeared in Phi Delta Kappan. Baker’s study serves as a rejoinder to all thoseclaiming that American student’s low scores on international tests were predictors of an economicdoomsday (Ravitch, 2013). Baker rightly observes that the idea that the results of international testsare predictive of a nation’s future success suffers from the correlation fallacy. That is, just becauseassessments within a nation often serve as good predictors of economic success, employment, futureopportunity, etc it does not mean that assessments between nations offer the same predictivepower (Baker, 2007). Baker goes on to analyze student performance on a host of internationalThe Paradox of U.S. Public Education8
assessments and cross-references those performances to other markers, like GDP, wealth, productivity,quality of life, democracy and creativity (using patents as a proxy for creativity). What he found wasstartling! There was no correlation between those markers and poor performance on internationalassessments. In fact, nations with the highest assessment scores scored the lowest in markers likedemocracy, creativity and wealth. As Baker writes, “No matter how you look at it, high test scores in1964 were not positive predictors of how the world would turn out. At best, international test scores areuseless and may well be harbingers of failure, rather than success” (Baker, 2007).Assuming that national tests are good predictors of future economic and academic success, andthat, therefore, international tests must likewise serve as a bellwether for how the nation as a whole willfare is an understandable fallacy. This assumption is what has led so many policy-makers and educatorsto argue that we are trailing the rest of the world in considerable ways (Ravitch, 2013). That bell haspersistently echoed since A Nation at Risk was first published in 1983, even as the U.S. economy continuedto grow into the largest in the world.We would argue that U.S. education has greatly improved since Gallup first began conducting itssurvey, and that public education continues to improve along a host of important benchmarks. So giventhe level of disconnect between our actual performance and public perception, what can account for thepublic’s declining level of confidence?First, the recent conflagration in many states over the Common Core State Standards (CCSS)has fostered a negative impression of what is happening within the sphere of education. Draftedin 2010 and rapidly adopted by 46 states, the CCSS were quickly integrated into school districtsthroughout the U.S. and implementation efforts were underway before parents and media ever tooknotice. In 2011, there were 86 mainstream news stories written on the Common Core. In 2012 thatnumber rose to 252 stories, which is still a miniscule amount relative to other stories populating thenews cycle. In 2013 the CCSS began to take on a political hue as the existence and implementationof the CCSS began to filter down to parents, local media and local political leaders. As parentsand political leaders became aware of the CCSS and implementation efforts were underwayThe Paradox of U.S. Public Education9
in earnest, that number rose to over 2,700 stories in 2014. As of June 2015, there were already over 2,100stories.Some have argued that the CCSS are simply a clever way to implement national standards, wrestingeducation from state and local control. Others worry that the CCSS will lead to unfair methods forassessing teacher effectiveness and that seasoned educators will be ejected in the transition. Though theCCSS was a non-partisan effort authored by the National Governor’s Association and the College Board,and partially financed through the Bill and Melinda Gates Foundation, the standards have proven to be aflashpoint for many school districts and state legislators have felt the heat. Fueled by the multitudinousnegative coverage, many parents have voiced passionate concern over the CCSS and have lobbied hardto have the new standards repealed or watered down.Second, much of the media continues to espouse that our children are woefully unprepared forcollege and career. US News & World Report observed that more than 60% of 2012 graduates did not meetACT’s benchmark for college readiness (Sheehy, 2012). A recent article in Education World argued thatemployers report that students lack the technological skills that make them suitable for the workplace(Caron, 2011). A survey in Education Week reported that 83% of college students reported some gapsin preparation in one or more subject areas (Adams, 2014). With so many stories labeling our publicschools a failure and propagating the idea that today’s students are deficient and unable to embrace thechallenge of college and career, it is little wonder that so many Americans report so little confidence inpublic education.The recent ascent from 26% to 31% of Americans expressing confidence in public schoolsmay be the start of a positive trend. Since we wrote our response last year, the educational tidehas shifted across many states and 17 states have either repealed or renamed the CCSS (Quinlan,2015). The CCSS has never been free of the notion that it is a federally mandated curriculum. Asa point of fact, such a federal mandate is completely false. Yet the idea persists and has become asort of cultural meme, propagating the idea that the feds authored and compelled the adoptionof the CCSS. Implementation efforts were well underway across the U.S. when grassrootsThe Paradox of U.S. Public Education10
efforts across a few scattered districts and municipalities to castigate and demonize the CCSS metastasizedand spread across the nation. A surprising coalition of tea-party conservatives, liberal educators andteacher unions sought to make political hay of the conflagration and political leaders have swiftlyacquiesced in efforts to repeal or rename the standards. The end result of this shifting tide is that formany parents control over education appears to be shifting from the federal level back to the state level(Associated Press, 2014). Perhaps then, polling indicating a rise in confidence reflects this supposedreacquisition.An abundance of parents across the U.S. choose to ‘opt-out’ their children (that is, just not take thestate mandated assessment). This trend only bolsters the notion that parents not only have a deep well ofantipathy towards the CCSS, but want local control when it comes to curriculum and assessment. Sixtyeight percent of parents do not believe that standardized tests help teachers teach (Hess, 2015). This year,1.1 million students in New York opted out of their state test. There have been considerable numbers ofstudents opting out in states like Maine, New Mexico, Oregon, and Pennsylvania (Cassidy, 2015). Here isAllison Hertog on the opt-out movement:The reasons for opting-out of the tests are nearly as diverse as the people of this country.Some, in Utah for instance, are opting-out because they see the new tests as commandeeringtheir God-given right to direct their child’s education. In New York, for example, manyrefusers align the tests with a “corporate takeover” of the public education system. Others,such as parents of struggling learners, simply object to holding their children to academicstandards that they believe they can’t, or haven’t been taught to, meet. (Hertog, 2015)Having so many students opt-out is a constitutionally-afforded form of civil disobedience; and parents(or students) are well within their rights to do so. What many parents may not realize is that by optingout they are depriving the state of valuable data on student performance. Furthermore, Title 1 schoolsrely on that data for their funding. In a state where over one million students simply refuse to take anassessment—one that figures into educational funding formulas—parents are unintentionally skewingthe data and almost certainly guaranteeing that some low-income schools receive even less funding(Strauss, 2015). Ultimately, that decision trickles down, hurting students and teachers.The Paradox of U.S. Public Education11
Across the country, state legislators have successfully framed the debate over the CCSS as thearchetypical David verses Goliath showdown, the battle between federal bureaucrats and local educators.That sort of verbiage has caught on. As states repeal or rename the CCSS, the general public is left withthe impression that Washington bureaucrats have been bested and that control of education is backwhere it belongs: in the hands of state and local leaders. Coupling the shifting tide of the CCSS with theopt-out movement has, for many parents, fostered the idea that public education may once again beon the right track. For some respondents this notion that the future of education has reverted to localcontrol may leave them feeling more positive and confident about the future of education.This tension over federal, state and local control of public education is on full display in thedebate and drafting of bills for the reauthorization of the ESEA (Elementary and Secondary EducationAct, or No Child Left Behind). The most current version of the bill (House and Senate) would maintain thecurrent annual federal testing schedule and the disaggregation of student achievement data, but wouldeliminate the current accountability system (Adequate Yearly Progress – AYP) and allow states to insteaddevelop their own accountability models. The shift towards state control is also reflected in the fact thatboth bills under consideration would not force states to evaluate their teachers and would prohibit theU.S. Secretary of Education from requiring (or offering incentives to compel) states to adopt any specificstandards, including the Common Core.In conclusion, there is ample evidence that, in terms of empirical student outcome measures,our students are performing better today than they were in the 1970s when public confidence was atan all-time high. Clearly the perception that our schools are broken is not warranted by the data. Whileour schools are not broken—and in fact, performing better than any other time in our history—we havedramatically altered the scorecard for success. Today the litmus test for public education is best describedin Secretary of Education, Arne Duncan’s assertion:If we can dramatically increase high school graduation rates, if we can dramaticallyincrease the number of graduates who are college and career ready, that’s what this isabout. Everything’s a means to that end. That’s the Holy Grail here. Are our students beingprepared to be successful? (Education Week, 2009)The Paradox of U.S. Public Education12
Let us be clear: this is a momentous goal. No country in the world has ever achieved such aparamount objective. Having every student graduate college and career ready will require us to payattention to both equity and excellence. Our schools with less than 10% low-income students perform aswell as any school in the world. Time will tell whether we will marshal the resources and commitment toshore up the equity issues to achieve the “Holy Grail” of college and career readiness for all.The Paradox of U.S. Public Education13
ReferencesAdams, C. (2014, December 18). High School Graduates Feel Unprepared for College and Work, Survey Finds.Retrieved July 2015, from edweek.org: http://blogs.edweek.org/edweek/college bound/2014/12/high schoolgrads unprepared for future.html#Associated Press. (2014, September 02). 50-State Look At How Common Core Playing Out In U.S. RetrievedJuly 2015, from huffingtonpost.com: -commoncore n 5751864.htmlBaker, K. (2007, October). Are International Tests Worth Anything?, Phi Delta Kappan, 101-104.Bidwell, A. (2015, January 16). Most U.S. Students Live in or Near Poverty. Retrieved July 2015, from U.S. News &World Report: aron, S. (2011). Tomorrow’s Workforce: What Students Need. Retrieved July 2015, from educationworld.com:http://www.educationworld.com/a Cassidy, C. (2015, April 18). Thousands of Students Opt Out of Common Core Tests in Protest. Retrieved July 2015,from pbs.org: ents-opt-common-core-tests-protest/Child Trends Data Bank. (2014, October). High School Dropout Rates. Retrieved July 2015, from tors high-school-dropout-rates# ednCollege Board. (2015). AP Program Participation and Performance Data 2014. Retrieved July 2015, from research.collegeboard.org: participation/ap-2014Education Week. (2009, December 2). An Interview with Arne Duncan. Retrieved July 2015, from edweek.org.Gallup. (2015, June). Business: Confidence in Institutions. Retrieved June 2015, from Gallup.com: tions.aspxHertog, A. (2015, May 7). Parent Opt-Out Movement: Engine of Common Core Unraveling? Retrieved July2015, from huffingtonpost.com: gout-is-silly-butpa b 7214478.htmlHess, F. (2015, May 5). Opt-Out Parents Have a Point. Retrieved July 2015, from usnews.com: -a-pointJones, J. M. (2015, June 15). Confidence in U.S. Institutions Still Below Historical Norms. Retrieved June 2015, fromGallup.com: tutions-below-historical-norms.aspx?utmsource position5&utm medium related&utm campaign tilesNational Center for Education Statistics. (n.d.). International Data Exporer. Retrieved August 2015, from onal Center for Education Statistics. (2010). NAEP 2004 Trends in Academic Progress and 2008 NAEP Long-TermTrends Mathematics Assessment. Retrieved July 2015, from NCES.ed.gov: http://nces.ed.gov/programs/digest/d10/tables/dt10 140.aspNational Center for Education Statistics. (2012). Numbers and Types of Public Elementary and Secondary Schoolsfrom the Common Core of Data: School Year 2010-11. Retrieved July 2015, from nces.ed.gov: able 02.asp#f4National Center for Education Statistics. (2013). Projections of Education Statistics to 2021. Retrieved July 2015,from nces.ed.gov: ns2021/tables.aspNational Center for Education Statistics. (2014). Public high school 4-year adjusted cohort graduation rate forthe United States, the 50 states, and the District of Columbia. Retrieved July 2015, from National Center ofEducation Statistics: http://nces.ed.gov/ccd/tables/ACGR 2010-11 to 2012-13.aspThe Paradox of U.S. Public Education14
National Center for Education Statistics. (n.d.). Progress in International Reading Literacy Student. RetrievedAugust 2015, from http://nces.ed.gov/surveys/pirls/National Center for Education Statistics. (n.d.). Trends in International Mathematics and Science Study. RetrievedAugust 2015, from nces.ed.gov: http://nces.ed.gov/timss/Quinlan, C. (2015, April 29). States Ditch Common Core Name But Keep Common Core Ideas. Retrieved July 2015,from thinkprogress.org: ideas/Ravitch, D. (2013). Reign of Error. New York: Vintage Books.Sheehy, K. (2012, August 22). High School Students Not Prepared for College, Career. Retrieved July 2015, fromusnews.com: for-college-careerStrauss, V. (2015, May 3). Why the Movement to Opt Out of Common Core Tests Is A Big Deal. Retrieved July 2015,from washingtonpost.com: core-tests-is-a-big-deal/Turner, J., Smith, M. I., & Lattanzio, S. (2014, October). A Crisis of Confidence: How Public Educators Can RestoreFaith in Public Education. Retrieved July 2015, from www.lexile.com: http://cdn.lexile.com/cms pagemedia/122/A%20Crisis%20of%20Confidence.pdfU.S. Department of Education. (2002, August). Fact Sheet on Title 1, Part A. Retrieved July 2015, from v/title1-factsheet.pdfThe Paradox of U.S. Public Education15 page
the 1980s, scores for nine- and 13-year-old students rebounded in the 1990s and have been rising ever since to currently sit at an all-time high for both reading and mathematics (National Center for Education Statistics, 2010). The Paradox of U.S. Public Education 4 Figure 2 1970 1975 1980 1