Transcription
View metadata, citation and similar papers at core.ac.ukbrought to you byCOREprovided by Scholarly Commons @ MiamiOH (Miami University)Maybe Elephants Can Dance:Two Decades of Progress in DeliveringLong-Term Services and Supports in OhioShahla Mehdizadeh, Robert applebaumIan M. Nelson, Jane Straker, Malinda DeaconScripps Gerontology CenterAn Ohio Center of Excellence
Maybe Elephants Can Dance:Two Decades of Progress in Delivering Long-TermServices and Supports in OhioShahla MehdizadehRobert ApplebaumIan M. NelsonJane StrakerMalinda DeaconScripps Gerontology CenterMiami UniversityJuly 2013Scripps Gerontology CenterMiami UniversityJune 2007This report was funded by a grant from the Ohio Department of Aging and the Ohio Legislature throughsupport from the Ohio Long-Term Care Research Project.1
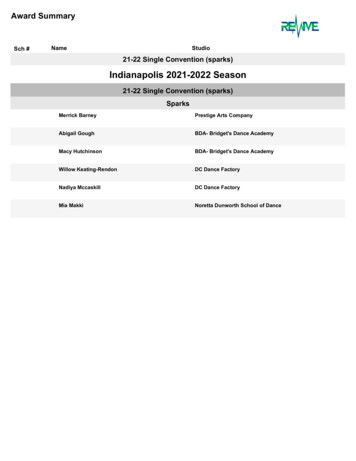
TABLE OF CONTENTSList of Tables . iList of Figures . iiAcknowledgments. iiiPrologue . ivExecutive Summary . vBackground . 1Demographics . 1Costs. 2The Range of Long-Term Service Settings . 3Community . 5County Levy Programs . 5Waiver Programs . 5Residential Care . 8Nursing Homes . 8Residential Care/Assisted Living Facilities . 10Tracking Long-Term Services and Support Use in Ohio . 11Nursing Facility Use . 11Nursing Facility Resident Characteristics and Costs . 13Costs. 22Residential Care Facility Use and Costs . 23PASSPORT . 24Use and Costs . 24Participant Characteristics . 27Program Disenrollment . 34Comparison Across Medicaid Long-Term Care Programs . 34Long-Term Care System Level Changes . 38System Balance . 38Utilization Patterns. 40Costs. 41Recommendations . 43References . 472
LIST OF TABLESTable 1. Ohio’s Projected Population with Severe Disability by Type . 2Table 2. Profile of Ohio’s Older Population: Disability and Utilization Rates by Region, 2012 . 7Table 3. Ohio’s Nursing Facility Characteristics, 2011 . 9Table 4. Ohio’s Residential Care Facility Characteristics, 2011 . 10Table 5. Ohio Nursing Facility Admissions, Capacity, and Occupancy Rates, 1992-2011 . 12Table 6. Comparison of the Demographic Characteristics of Ohio’s Certified Nursing FacilityResidents and Residents with Medicaid or Medicare as Source of Payment, April–June 2012 . 15Table 7. Comparison of the Demographic Characteristics of Ohio’s Certified Nursing FacilityResidents Over Time, 1994, 2004–2012. 16Table 8. Comparison of the Functional Characteristics of Ohio’s Certified Nursing FacilityResidents and Residents with Medicaid or Medicare as Source of Payment, April–June 2012 . 18Table 9. Comparison of the Functional Characteristics of Ohio’s Certified Nursing FacilityResidents Over Time, 1994, 2004–2012. 19Table 10. Comparison of the Demographic Characteristics of Medicaid Residents in Ohio’sCertified Nursing Facility by Age Group, April–June 2012. 20Table 11. Comparison of the Functional Characteristics of Medicaid Residents in Ohio’sCertified Nursing Facilities by Age Group, April–June 2012 . 21Table 12. Length of Stay for Medicaid Residents Under 60 in Ohio’s Certified NursingFacilities, April–June 2012 . 22Table 13. Comparison of Occupancy and Length of Stay in Ohio’s Residential Care Facilities,2009–2011. 24Table 14. Comparison of the Functional Characteristics of Ohio’s Residential Care FacilitiesResidents, 2011 . 25Table 15. Demographic and Functional Characteristics of Enrollees in the Assisted LivingWaiver Program, 2008–2012 . 26Table 16. PASSPORT Expenditures by Type of Service, 2004–2012 . 27Table 17. Demographic Characteristics of PASSPORT Consumers 2000-2012 . 28Table 18. Functional Characteristics of PASSPORT Consumers, 2000-2012 . 30Table 19. PASSPORT Participant Demographic Characteristics by Region, 2012 . 31Table 20. PASSPORT Participant Functional Disability Characteristics by Region, 2012 . 32Table 21. PASSPORT Participant Need for Supervision and Utilization by Region, 2012 . 33Table 22. Reasons Consumers Were Disenrolled from PASSPORT, 2008-2012 . 35Table 23. Demographic Characteristics of Ohio Medicaid Waiver Consumers, PACEParticipants and Medicaid Nursing Facility Residents, 2012 . 36Table 24. Functional Characteristics of Ohio Medicaid Waiver Consumers, PACE Participantsand Medicaid Nursing Facility Residents, 2012 . 37i
LIST OF FIGURESFigure 1. Proportion of Ohio’s Population with Physical/Cognitive Disability Receiving Care inDifferent Settings, 2011 . 4Figure 2. Average Daily Nursing Facility Census, 1997 – 2011 . 14Figure 3. Average Nursing Facility Per Diem by Source of Payment in 2011 Dollars, 1998 –2011. 23Figure 4. Percent Distribution of Ohio’s Long-Term Care Services and Supports Utilization byPeople Age 60 and Older, 2011 . 39Figure 5. Percent Distribution of Ohio’s Long-Term Care Services and Supports Utilization byPeople Under Age 60, 2011 . 39Figure 6. Number of People Age 60 and Older on Medicaid Residing in Nursing Facilities orEnrolled in HCBS Per 1000 Persons in Population . 40Figure 7. Average Number of People Under 60 Years of Age Receiving Medicaid Long-TermServices and Supports, 1997-2011 . 42Figure 8. Average Number of People Age 60 and Older Receiving Long-Term Services andSupports, Paid by Medicaid, Over Time, 1997-2011 . 42Figure 9. Comparison of Total Medicaid Expenditures on Services and Supports for People Age60 and Older 1997 – 2011 at 2011 PMPM Rates (in Thousands of Dollars) . 43ii
ACKNOWLEDGMENTSWe wish to thank many people whose assistance made this study possible. We areappreciative of the nursing home and residential care professional associations that supported ourdata collection efforts and to the more than 1400 facilities that responded to the survey. We alsoacknowledge the efforts of the staff at the two PACE sites who provided their participantassessment data. At the Ohio Department of Aging, Director Bonnie K. Burman providedongoing feedback and guidance, Mary Inbody carefully reviewed this report and M. E. Faizsupported our many data requests.At Scripps, we are thankful to Karl Chow for his great work on preparing the onlinesurvey of facilities and the outstanding report preparation work by Lisa Grant. We hope that thisreport will assist Ohio in its ongoing efforts to develop an efficient, effective, and compassionatesystem of long-term services and supports for people of all ages.iii
PROLOGUEIt was rumored that in the early days of computers when Apple CEO Steve Jobs heardthat IBM was planning on developing a personal computer, he remarked, “IBM will develop aPC when elephants can dance.” Experts have argued that big states like Ohio experience similarchange barriers and that is why the largest states in the nation have had difficulties reformingtheir long-term services system. The 20-year longitudinal data presented in this report, however,document that Ohio has made considerable progress in creating a more efficient and effectivesystem, suggesting that just maybe elephants can learn to dance.iv
EXECUTIVE SUMMARYFor many years Ohio’s system of long-term services and supports was criticized forhaving an institutional bias. In 1993, more than nine of ten older people (60 and over) with asevere disability who received Medicaid long-term services did so in a nursing home. Ohio’sexpenditure ratio of institutional to home and community-based services for older people duringthis era was heavily slanted toward the nursing facility side, and the state had one of the lowestrankings in the nation, consistently listed as 47th. Ohio had one of the highest rates of nursinghome use and reimbursement, and consequently Medicaid nursing home expenditures per capitawere in the top five in the country. With one of the largest aging populations in the United Statesand growing and unsustainable Medicaid expenditures, state policy makers charted a course tochange Ohio’s system. This longitudinal study, initiated by the General Assembly in 1993 andcontinuously funded by the Ohio Department of Aging, tracks how long-term utilization haschanged over the past two decades. Recent data indicate that the ratio of institutional care tohome and community-based services for older people with severe disability using Medicaid hasnow changed to 55/45. The 47th ranking is now 24th. Over the last 15 years, while the age 85 andolder population grew by 50%, Ohio decreased nursing home use for older people by 11%.During this same 15-year time period, the state increased the number of older people receivinghome and community-based services by 150%, while holding the Medicaid long-term servicesbudget relatively constant (7% increase over 15 years, in 2011 dollars). The data presented inthis report describe the substantial progress made in the state in creating a more efficient andeffective system of long-term services and supports.The summary below highlights the major findings of the report:DEMOGRAPHICS AND COSTS Ohio’s older population (2.4 million adults age 60 and older in 2012) is the 7th highest inthe nation—one in five older Ohioans report a moderate or severe disability requiringlong-term care. In 2011, 200,000 older Ohioans had severe disability, and that number will increase to249,000 by 2020, to 317,000 by 2030, and double by 2040. In 2011, 302,000 Ohioans of all ages had severe disability, and that group will grow to342,000 by 2020 and 405,000 by 2030. In 2011, Ohio spent 5.71 billion on Medicaid long-term services and supports for allOhioans with a severe disability: 3.43 billion on institutional care (60%) and 2.28billion on home and community-based services. The national average for Medicaid longterm care spending for institutional care was 56%.v
In 2011, the spending ratio for adults with severe physical and/or cognitive disability was72% institutional and 28% on home and community-based services; institutionalexpenditures accounted for 80% in 2006. As recently as 2004, Ohio’s balancing ratioranked 47th; today the state ranks 24th.LONG-TERM SERVICES Three in ten adults with severe physical and/or cognitive disability receive assistanceonly from family or privately purchased care. Thirty-five percent of Ohioans with severe physical and/or cognitive disability live innursing homes. Twenty-five percent of Ohioans with severe physical and/or cognitive disability receivein-home support through an array of Medicaid waiver programs, including: PASSPORTfor older people, the Ohio Home Care programs for physically disabled individuals underage 60, Choices, PACE, and the assisted living waiver for individuals age 21 and older. Itis estimated that about 60% of these individuals will become part of the Integrated CareDelivery System (ICDS) Demonstration. Ohio’s PASSPORT Medicaid waiver program providing in-home services to individualsage 60 and over with severe disability has grown from serving 15,000 each day in 1995to more than 30,000 in 2011. Ohio ranks 8th in per capita home and community basedcare expenditures. In 2011, Ohio had 967 nursing homes with 95,000 licensed beds. On a typical day morethan 81,000 individuals reside in nursing homes. Of this number 61% are paid for by theMedicaid program, 15% are funded by Medicare, and 24% are self-pay or privateinsurance. Between 1995 and 2011, Ohio quadrupled the number of residential care facility beds to44,000. Ohio has 585 residential care facilities and classifies 480 of these as assistedliving residences. As of May 2013, 299 of these facilities were participating in theAssisted Living Waiver Program.vi
RESEARCH FINDINGS ON LONG-TERM UTILIZATION IN OHIO Nursing homes have shifted their focus and now provide a combination of both long andshort-term care. In 1992 Ohio nursing homes had 71,000 admissions; in 2011 thatnumber had nearly tripled to 216,000. The number of short-term Medicare admissions has been a major reason for the growth innursing home admissions, going from 30,000 in 1992 to more than 149,000 in 2011.(396% increase). Many Ohioans use nursing homes for short stays; more than half spend three months orless, and two-thirds are residents for less than six months. Nursing homes are serving a higher proportion of individuals under age 60, increasingfrom 10% in 2004 to 13% in 2012. In our first report completed in 1994, 4% of residentswere under age 60. Almost 17% of Medicaid nursing home residents are under age 60. Nursing home occupancy rates increased slightly as a result of a higher number ofMedicare residents. Medicaid occupancy rates dropped slightly, and private payoccupancy remained stable. Over the past 15 years the Medicaid census in Ohio nursing homes has dropped by 9%from 54,242 in 1997 to 49,563 in 2011. The average daily census for the over 60Medicaid population has dropped by 11%, but has increased by 26% for those under age60. In 2011, Medicaid nursing home reimbursements were 167 per day, private pay rates(semi-private room) were 208 per day, Medicare fee for service was 442, and MedicareAdvantage was 372 per day. Ohio’s Medicaid reimbursement rates have dropped overthe last decade, with a 2001 inflation-adjusted Medicaid rate of 206. (Actual 2001 ratewas 172.) In 2011, residential care facility unit occupancy rates were 87%, a substantial increasefrom the 81% rate in 2009. This was driven largely by the growth of the assisted livingwaiver, which has an average daily census of 3000 individuals.Levels of disability do vary across Ohio’s Medicaid long-term care program participants.Nursing home residents average between four and five activity limitations; the OhioHome Care and Choices waiver participants average between three and four activitylimitations; PASSPORT and Aging Carve-Out consumers average three limitations; andvii
PACE enrollees and the assisted living waiver residents average between two and threeactivity limitations. Medicaid costs, after participant contributions, also vary by programs, ranging from 49per day for PASSPORT to 145 for nursing homes. PACE receives a 95 daily capitatedrate that covers both acute and long-term care costs under Medicaid. In part because ofhigher rates of resident contribution, the Medicaid cost for the assisted living waiver was 56 per day. Ohio has changed its approach to delivering long-term services for older people withsevere disability. In 1993, nine of ten older people with severe disability and supportedby Medicaid were in nursing homes; by 2011, that proportion using nursing homes haddropped to 55%. The proportions have also changed for the under 60 population,dropping from 64% using nursing homes in 1997 to 50% in 2011. The under 60 ratios,however, have not changed much since 1999. Over the last 15 years, although the state has expanded the number of older peoplereceiving in-home services, the Medicaid utilization rate for long-term services andsupports has remained relatively constant. In 1997, Medicaid had a utilization rate of32/1000, and in 2011 the rate was 34/1000. Utilization and cost analysis indicates that since 1997, Ohio has increased the totalnumber of older people with severe disability served from 61,820 to 78,480, reflectingthe growing number of older people in the state. In 1997, Ohio spent 2.69 billion onlong-term care (at 2011 rates); in 2011, expenditures on older people’s long-term carewere 2.88 billion. This 195 million difference (inflation adjusted) represents a 7%increase in Medicaid expenditures, while the number of older people served increased by27%.Despite these substantial improvements, Ohio still faces considerable challenges ahead.Over the next 25 years the older population with severe disability is projected to nearly double insize, a rate that is considerably higher than the major growth experienced in the last 20 years.Accompanying these population increases are data indicating that nursing home use for Ohio’sunder age 60 citizens has tripled over the last two decades and has been especially large forMedicaid recipients. While Ohio can build on its policy and implementation achievements, theroad ahead is likely to be more difficult than the path already traveled. Based on our work overthe last two decades, the report offers five major recommendations for consideration:(1) Ohio’s strategy to reform the system of long-term services has been effective, butstate policy makers will need to continue these efforts as the older population withviii
disability grows at an even faster rate than it has in the last 20 years. Even withthe substantial progress achieved, Ohio continues to have an oversupply ofnursing home beds, resulting in overutilization, particularly by youngerindividuals with disability. Creative approaches to right-sizing the number of bedscan ensure continued progress in developing a balanced system and help to ensurebetter success of the industry.(2) Despite the good progress, what is missing from Ohio’s overall strategy is asystematic effort to really prepare for the unprecedented increase in the olderpopulation. Today fewer than 10% of older Ohioans residing in the communityare Medicaid recipients, but six in ten of nursing home residents are supported byMedicaid. What Ohio policy has not addressed is how to help middle and upperincome older individuals from relying on Medicaid to finance their long-termservices and supports. Today about one-half of physically and/or cognitivelyimpaired Ohioans receive Medicaid long-term services and supports. As the olderpopulation increases, it will be critical to think about how Ohio can both reducethe prevalence of disability and assist individuals in adapting to theirenvironment. For example, can we provide better opportunities to prevent ordelay severe disability? How can we use technology to help individuals withdisability to remain in their own homes independently for as long as they desire?While such efforts will require a partnership between the public and privatesectors, state leadership will be critical to help develop and expand these efforts.Given Ohio’s emphasis on job development, can the state become a nationalleader in technology that will support independence for older people withdisability?(3) We again recommend that Ohio look carefully at utilization rates of the under 60population and formulate a strategy to respond to the needs of these individuals.This report indicates that Ohio has changed how it delivers long-term services andsupports to older individuals with severe disability, even lowering nursing homeuse in the face of an increasing older population. At the same time, Ohio hasexperienced a 26% increase in the population younger than 60 using Medicaidnursing homes. Evidence indicates that a portion of individuals under age 60 whoare using nursing homes have lower levels of disability and in some instances thenursing home may not be the best care setting. We found that 19% of the underage 60 population did not have an ADL impairment, and 26% had zero or oneADL limitation. In a previous study we had found 4.4% of Medicaid nursinghome residents did not appear to meet level-of-care, and many of those wereindividuals under age 60 who experienced chronic mental illness.ix
(4) Because of the high volume of nursing home admissions (almost 216,000), werecommend that the state develop a pre-admission review and follow-up approachthat would allow more careful attention placed on some residents and fewerresources allocated to individuals who will clearly be discharged in less than 20days as a result of Medicare coverage rules. This is applicable to Medicaid aswell, which is now being used for short-term care (90 days or less) for about onethird of those admitted. The tremendous increase in nursing home admissions anddischarges and the high number of individuals who spend a short time in nursinghomes suggest that the system has changed. This means that Ohio needs to alterits pre-admission approach in response to these changes.(5) As Ohio moves to a more unified system of long-term services it becomes evenmore important to be able to make sound comparisons across the system. Werecommend that Ohio have at least a core set of measures that are collected in acomparable way across settings. Although cost differentials are anticipated, itwould be important for Ohio to have a better understanding of programdifferences. In some instances programs appear to be serving similar targetpopulations at very different costs. However, without comparable data it isdifficult to understand programmatic differences in costs and utilization.Ohio has a window of opportunity to address these challenges before the baby boomers fullycome of age. Through its extensive efforts, Ohio has indeed responded; however, thedemographic and financial challenges of the future suggest that the current reforms representonly the first steps of a longer journey. Elephants can dance, but can they learn new steps to meetthe needs of a growing and ever changing older population in Ohio.x
BACKGROUNDProviding assistance to those individuals who need long-term services and supports doesnot capture the national headlines the way health care reform does, but it is an issue of criticalimportance to the citizens of Ohio and state policy makers. Even though Medicaid is afederal/state partnership, it is the states that bear responsibility for overall program design andoperations for long-term services. In most of the nation, including Ohio, the initial long-termcare strategy involved heavy investment in nursing homes. During the 1960s and 1970s this wasseen as a progressive move to ensure that older citizens had access to needed care in a safeenvironment. As the older population increased in number and issues of cost and quality began topermeate the nursing home industry, additional long-term service options were developed. As aresult, a shift to other types of long-term services and supports, such as in-home services,supportive housing, adult family care, and assisted living residences began across the UnitedStates.The tremendous increase in the older population, combined with the development of newoptions and a growing recognition that individuals with disability could live in a communityenvironment, has changed how individuals use—and how states finance—long-term services andsupports. In this report we track Ohio’s implementation strategy over the last two decades as ithas responded to the growing needs of its citizens. Ohio has made some important changes thathave improved its ability to meet the mounting challenges. This study documents Ohio’ssubstantial progress and highlights future areas for policy and programmatic consideration.DEMOGRAPHICSWith 2.4 million individuals age 60 and over, Ohio ranks 7th in the nation in the sheersize of the population in this age category (ohio-population.org). In less than ten years, by 2020,the number of Ohioans age 60 and older will grow by 30%, and by 2040, the population age 60and older will increase by 50%. Although the growth in our aging population is a marker ofsocietal advancement, it is accompanied by serious challenges, especially in the area of longterm services and supports. Today just over 200,000 older Ohioans experience a severe disabilityrequiring long-term assistance. Estimates indicate that the older population with severe disability(defined as individuals who meet the state’s nursing home level-of-care criteria) will grow to249,000 by 2020 (25% increase); by 2030 the number is projected to be 317,000 (60% increase);and by 2040 the number will nearly double in size (400,000).Looking at individuals across all age groups, we find that in 2010 there were about302,000 Ohioans experiencing severe disability. A more extensive breakdown of the entirepopulation with severe disability is provided in Table 1. Projections indicate that this numberwill grow to more than 342,000 by 2020 and 405,000 by 2030. These demographic changesindicate that today’s difficult issues are tomorrow’s considerable challenges.1
Table 1. Ohio’s Projected Population with Severe Disability by TypeTable 1Ohio’s Projected Population with Severe Disability by TypeYearTotalPopulationPhysical and/orCognitiveIntellectual and/orDevelopmentalSevere MentalIllnessTotalPopulationwith 01404,682Source: Based on Population Projections from www.ohio-population.org and the disability rates fromMehdizadeh, S. (2008). Disability in Ohio: Current and future demands for services. Oxford, OH:Scripps Gerontology Center, Miami University.COSTSWith national long-term serv
system, suggesting that just maybe elephants can learn to dance. v EXECUTIVE SUMMARY For many years Ohio’s system of long-term services and supports was criticized for having an institutional bias. In 1993, more than nine of ten older people (60 and over) with a severe disability who rec