Transcription
International Journal on Textile Engineering and Processes, ISSN: 2395-3578, Vol 1,Issue 2, April 2015To Reduce Non-Productive Time in Garment IndustrySapna Jain, Pranjali Chandurkar and Harshada Upasani,Centre For Textile Functions, Mukesh Patel School of Technology Management and Engineering, Narsee MonjeeInstitute of Management Studies (NMIMS) Shirpur Campus ,Shirpur Dhulia, Maharashtra. IndiaSapnajain3093@gmail.com, Pranjali.chandurkar@nmims.edu, upasaniharshada@gmail.comAbstractIn this research, root-cause identification methodology has been adopted to eliminate the non-productivities activitiesin sewing operation in apparel manufacturing. The fast changing economic conditions, such as global competition,declining profit margin, customer demand for high quality product, product variety and reduced lead–time etc. Thisplay a major impact on apparel manufacturing industries. For any industry cost and time related to production andquality management or wastages reductions have important impact on overall expenditure. Emphasizing on eachoperation of sewing section steps has been taken to investigate and eliminate non-productive time in order to save timeand cost and lessen internal process time. The outcome of this observation reflected that an industry may gain higherproductivity and profitability by eliminating non-productive activities. NPT analysis of efficiency saves 28% losses and54.67% improvement takes place in number of pieces produced and it saves 57.71% cost of production due tominimisations in machine break down, line setting and basic amenity.Keywords- Sewing Machines, Line Balancing, Machine Operators, I.E department.I. IntroductionGarment manufacturing units are now focusing on the improvement of overall efficiency. But they have manyproblems in their cutting, sewing and finishing sections. Now there efficiency level is not appreciable whichis between 40-50% and the reason behind it is practicing huge amount of non-value activities. The problemis encountered in the initial processing of the sewing section. The capacity utilization of section is around40% to 65% due to problems of non-value added time at each operational process. But, no root causes areidentified as to why there is such a problem. This reason is one of the key contributory factors for the lowerlevel of productivity. The different operation is performed in sewing section but how far it is related to or itis influencing the production processes had never been studied earlier. For this the loss of the company havebeen shown every hour by the using the Standard Allowed Minutes (SAM) with or without non valueactivities. Here Standard Minute Values (SMV) of different activities has also been shown which arecalculated in both ways of considering the non-productive activities.NPT in Industrial Engineering term is Non-Productive Time. Time that is spent by an operator withoutproducing any garment (standard minutes) like 'set up time' is called non-productive time. In garmentproduction Non-productive time is measured to analyze how much standard time is lost due to machine downtime. Lost time is recorded to show management a reason for low production in a particular day or lower lineefficiency. Here are few example of lost time.1. Line setting2. Machine Breakdown3. Cutting not available4. Stitching Quality issue5. Cutting quality problem6. Power failure7. Change of Feeding Plan8. Basic AmenityHow to capture NPTProvide a printed format to each line. Make one person responsible (line feeder, work study officer or linesupervisor) to record lost time in total man minutes in the format. During production hours whenever you seeoperators to sit idle, find the reasons of not having work (or not doing the task) and note down start time andstop time, according due to sample format. In case multiple operators are sitting idle for the same reasonmultiply lost time by number of operators to calculate total man-minutes lost and record on your NPTformat. Lost time recorded under the category need to be approved by supervisor or authorized person. Atthe end of the day calculate total lost time in each category.Flow Chart of the NPTStudy about the Non Productive TimeSelect Manufacturing Organization for Implementation the StudyVisiting the Industry and Visual Observation43
International Journal on Textile Engineering and Processes, ISSN: 2395-3578, Vol 1,Issue 2, April 2015Select an Operational SectionPrepare a Data Sheet for a specific product styleAnalysis of Current state by Calculating value added and non-value added timeIdentifying the area of Non-productive time before Root Cause AnalysisIdentifying Root Cause of Non-productive activitiesApplying Root Cause analysis process for Non-productive ActivitiesDue to Less Cost and Improve the Productive time after apply this projectConclusions and RecommendationsI have identify major problems in sewing line like that line setting, waiting for work, repair work inproduction line, no feeding, quality issue etc. These are the few example of loss of time. Different nonproductive works have a great impact on productivity. Higher non–value added activities, higher standardminute value (SMV) leads to less final time of each step involved. After that effective suggestion andrecommendations are made to reduce the non-productive time.Experimental WorkGarment – T-Shirt (Men)Style – L/S M’S CREW NECK TEEFabric – 100% cotton knitted fabric with single jersey structureGSM – 165Single knitted jersey fabricTable No.1 Non-Productive Record format (before 15days according to format)Table No.2 Non-Productive Record format (after 15days according to format)44
International Journal on Textile Engineering and Processes, ISSN: 2395-3578, Vol 1,Issue 2, April 2015Result & Graphical representation of NPTBefore ImprovementDayProduction(No.of Pieces /Shift)Day 1700Day 2800Day 3850Day 4800Day 5900Day 6750Day 7900Day 8650Day 9800Day 10800Day 11700Day12700Day 13850Day 14600Day 15750Avg770Table 3. Production and Efficiency Loss %.Efficiency 49%After ImprovementEfficiency Loss %Production(No.of Pieces/ 0%24%20%17%14%21%Following table shows the losses in manufacturing cost required per shiftBeforeAfterDayLoss of Sewing due to NPT ( Rs.)DayLoss of Sewing due to NPT ( 15014,7007,35012,25019,60045
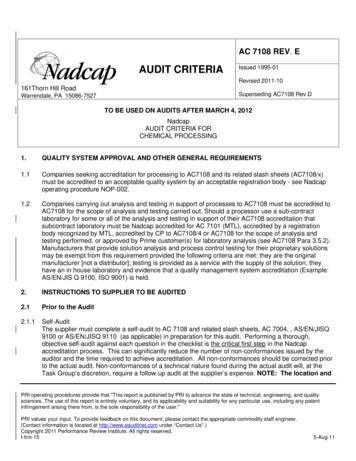
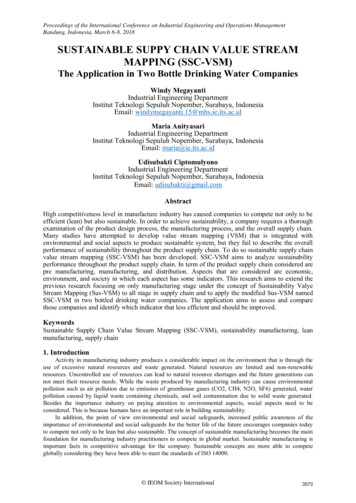
International Journal on Textile Engineering and Processes, ISSN: 2395-3578, Vol 1,Issue 2, April 2509,80015,124Table 4. Loss of Sewing due to NPT AnalysisDaily Production(Pcs/Shift)Daily Production Analysis150010005000BeforeAfter1 2 3 4 5 6 7 8 9 10 11 12 13 14 15DaysFigure 1. Daily Production AnalysisInference: In figure 3 shows that daily loss of sewing due to NPT analysis there is 770 pieces produce before trialand 1191 pieces produce after trial of this project, so that NPT analysis shows 54.67% improvement in numberof pieces. Due to avoided machine break down, line setting and basic amenity.Efficiency Loss %Efficiency loss %Daily Efficiency Loss %80%60%40%20%0%BeforeAfter12345678 9 10 11 12 13 14 15DaysFigure 2. Daily Efficiency Loss % AnalysisInference: In figure 3 shows that daily loss of sewing due to NPT analysis there is 49% loss before trial and 21%loss after trial of this project, so that NPT analysis of efficiency saves 28% loss due to avoided machine breakdown, line setting and basic amenity.46
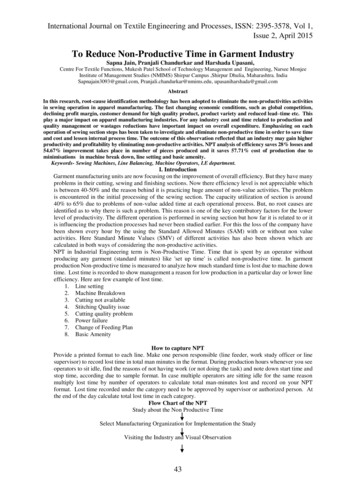
International Journal on Textile Engineering and Processes, ISSN: 2395-3578, Vol 1,Issue 2, April 2015Daily Loss of SewingDaily Loss of Sewing Due to NPT 1 2 3 4 5 6 7 8 9 10 11 12 13 14 15DaysFigure 3. Daily Loss of Sewing Due to NPT AnalysisInference: In figure 3 shows that daily loss of sewing due to NPT analysis there is 35,770 Rs loss before trial and15,124 Rs loss after trial of this project. So that NPT analysis saves 57.71% loss. Due to avoided machine breakdown, line setting and basic amenity.ReasonsWe found that three major problem of sewing line machine breakdown, loss due to feeding and basic amenity thisfactor will be affected on productivity that is the loss due to non-productive time in garment manufacturing. Wehave already discussed study on non-productive time in details of this project. These are the following threefactors find out due to loss time analysis. Before loss due to breakdown Avg 23 min and after improvement analysisloss time due to Avg 5 min. That means the 18% improvement of this factor. Before loss due to breakdown Avg30 min and after improvement analysis loss time due to Avg 8 min. That means the 22% improvement of thisfactor. Before loss due to breakdown Avg 43 min and after improvement analysis loss time due to 11 min. Thatmeans the 32% improvement of this factor.ConclusionWe found that sewing line is eight major factors are affected on NPT but loss time is very much affected by fourmajor factor 1)Line setting 2)Machine breakdown 3)Loss due to feeding and last one is 4)Basic Amenity. Thesefactors are responsible for Non- Productive Time. NPT analysis there is 49% loss before trial and 21% losses aftertrial of this project, so that NPT analysis of efficiency saves 28% losses. NPT are responsible for analysing theraw material, cutting, sewing and finish goods departments. Different non-productive works have a great impacton productivity. Higher non–value added activities, higher standard minute value (SMV) leads to less final timeof each step involved. To survive in the very competitive market the factory must remove non value-added timebetween processes or in the process and also improve the current capacity efficiently and effectively. Both forincluding and excluding non -productive activities, then current state of root because analysis has been analyzedand various improvement proposals are identified to reduce the non-value adding waste. After that effectivesuggestion and recommendations are made to reduce the non-productive time.AcknowledgementI wish to give my sincere gratitude to Pratibha Syntex Limited, Pithampur for giving mean opportunity forthis research work, and also I would like to thanks Centre For Textile Functions, MPSTME, Shirpur, for theirvaluable guidance throughout the project.References1. Zeleny, M, The Innovation Factory: On the Relationship between Management Systems,2. Knowledge Management and Production of Innovations. Innovations 2005, Zilina 20053. Guidelines for Industrial Engineering, KSA Technopak.4. http://www.lcmibd.com/industrialengineering.htm5. http://wiki.answsers.com/Q/Industrial engineering work study in garments6. Industrial engineering and engineering management in Australia by Professor John W H Price PhD,FIEAust Mechanical Engineering Department, Monash7. www.online clothing study.com8. www.textile learner.com9. www.fiber to fashion.com10. www.wikipedia.com11. www.google.com, Wikipedia, of Industrial Engineering .47
Figure 3. Daily Loss of Sewing Due to NPT Analysis Inference: In figure 3 shows that daily loss of sewing due to NPT analysis there is 35,770 Rs loss before trial and 15,124 Rs loss after trial of this project. So that NPT analysis saves 57.71% loss. Due to avoided ma