Transcription
OptimizationUsing Analytic Solver PlatformREVIEW BASED ONMANAGEMENT SCIENCE
What We’ll Cover Today Introduction Session ΙΙΙ beta training program goals Automating Optimization in Excel Defining Optimization in Solver SDK Platform Dimensional Modeling5/28/2014WE DEMOCRATIZE ANALYTICS2
Session ΙII Online Beta Training GoalsTo familiarize you with the following concepts: Automating your Excel spreadsheet optimization model Designing custom applications Modeling multi-dimensional business situationsTo empower you to achieve success State of the art tools Online educational training User guides and video demos5/28/2014WE DEMOCRATIZE ANALYTICS3
Typical Optimization ApplicationsStaff ngBlendingTransportationIndustryFinanceFunctional AreaAgricultureMedia planningSupply chainHealthInventory optimizationMiningVendor selectionDefensePortfolio optimizationForestry5/28/2014Capacity planningProduct mixWE DEMOCRATIZE ANALYTICS4
Why Automate OptimizationModels? Run predefined Solver models and get the results.Solve a complex problem by optimizing a “master” model and a “slave” model.Automatically update data, run the model, and retrieve the results.Run multi-period optimizations when the output of current model is the input tothe next model. Create an application to distribute to end users.5/28/2014WE DEMOCRATIZE ANALYTICS5
Why Use the Object-Oriented API? Create, modify and solve optimization models under the control of your customapplication written in VBA. Work with objects that correspond to the Problem, Model, Solver, Engine,Variables, and Functions. You can access sets of variables and constraints in the current model directly withexpressions such as myProb.VarDecision and myProb.FcnConstraint. You’ll receive IntelliSense prompts as you write code.5/28/2014WE DEMOCRATIZE ANALYTICS6
Examples in the User Guide Refinery.xls at C:\Program Files\Frontline Systems\Analytic Solver Platform\Examples. Example of how to call the Solver, and how to retrieve sensitivity information from VBA. Refinery Optimization - Model taken from Model Building In Mathematical Programming byH.P. Williams. How should the operations of the refinery be planned to maximize total profit. CuttingStock.xls at C:\Program Files\Frontline Systems\Analytic Solver Platform\Examples. Example of how VBA can be used to solve a cutting stock problem, using a column-generationalgorithm. Press the "Run Model" button to execute the RunModel macro that calls the Solverprogrammatically through VBA.5/28/2014WE DEMOCRATIZE ANALYTICS7
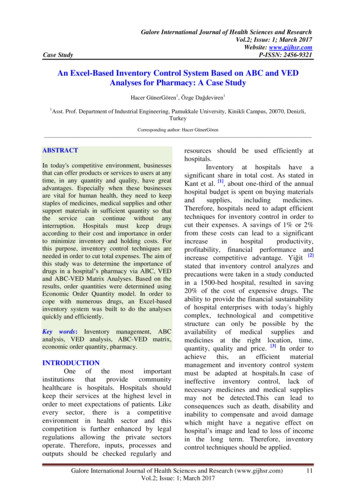
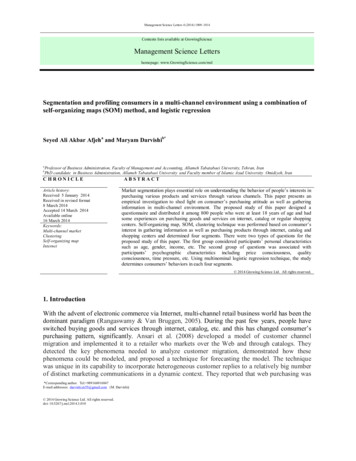
Automating Optimization Modelingin VBA Example Standard Examples - Example 4 Portfolio Optimization - Markowitz Method. Find the optimal allocation of funds to stocks that minimizes the portfolio risk,measured by portfolio Variance (a quadratic function).Stock 1Stock 2Stock 4Stock 5Total20.00%20.00%20.00%20.00%20.00%Expected Return7.00%8.00%9.50%6.50%14.00%Linear QP Terms00000Portfolio %Variance/Covariance MatrixStock 1Stock 2Stock 3Stock 4100.00%Stock 5Stock .85%Stock 31.00%-0.10%1.20%0.65%0.75%Stock 4-0.50%1.20%0.65%8.00%1.00%Stock 51.00%-0.85%0.75%1.00%7.00%Stock 15/28/2014Stock 3WE DEMOCRATIZE ANALYTICS8
Summary Automating PredefinedOptimization Models in VBA Step 1 – Press Alt F11 to open the Visual Basic Editor. Step 2 – Add a reference to the Analytic Solver Platform COM serverAnalytic Solver Platform 2014 Type Library. Step 3 – Create a new macro Step 4 – Add two lines of code for active worksheetDim prob As New Problemprob.Solver.Optimize5/28/2014WE DEMOCRATIZE ANALYTICS9
VBA Example Summary –Create and Solve the Model Step 1 – Create a command button on the worksheet.Step 2 – Assign a macro to the command button.Step 3 – Add a reference to the Analytic Solver Platform COM server.Step 4 – Create an instance of the problem.Dim myProb As New RSP.Problem Step 5 – Clear the existing model.myProb.Functions.ClearmyProb.Variables.Clear Step 6 – Set Cell or Objective VariableDim objective As New RSP.Functionobjective.Init Range("Portfolio Variance")objective.FunctionType Function Type Objective5/28/2014WE DEMOCRATIZE ANALYTICS10
VBA Example Summary –Create and Solve the Model Step 7 – Add the Objective to the problemmyProb.Functions.Add objectiveSet objective Nothing Step 8 – Set up the Variables and add the non-negativity constraintDim vars As New Variablevars.Init Range("Allocations")vars.NonNegative Step 9 – Add Variables to problemmyProb.Variables.Add varsSet vars Nothing5/28/2014WE DEMOCRATIZE ANALYTICS11
VBA Example Summary –Create and Solve the Model Step 10 – Set up the return threshold constraintDim constraint As New RSP.Functionconstraint.Init Range("Portfolio Return")constraint.LowerBound(0) 0.095 Step 11 – Set up the budget constraintDim constraint1 As New RSP.Functionconstraint1.Init Range("Total Portfolio")constraint1.UpperBound(0) 1constraint1.LowerBound(0) 1 Step 12 – Add the constraints to the problemmyProb.Functions.Add constraintmyProb.Functions.Add constraint15/28/2014WE DEMOCRATIZE ANALYTICS12
VBA Example Summary –Create and Solve the Model Step 13 – Set the problem typemyProb.Solver.SolverType Solver Type Minimize Step 14 – Perform the optimizationmyProb.Solver.Optimize Step 15 – Display the Solver Objective function resultMsgBox myProb.FcnObjective.FinalValue(0) Save the code. Now click on the command button and see the results. You can also set the desired engine and adjust its parameters.myProb.Engine prob.Engines("Standard LP/Quadratic")myProb.Engine.Params("MaxTime") 6005/28/2014WE DEMOCRATIZE ANALYTICS13
Solver SDK Platform A complete toolkit to move your optimization model from Excel to a custom desktop orweb-based application. Enables you to develop and deploy custom applications using optimization and MonteCarlo simulation, with most popular platforms and languages: Microsoft .NET, Java,MATLAB and COM, as well as C/C , Visual Basic and other languages. The SDK can load an Excel workbook containing an optimization model, solve themodel on a server without using Excel, and save the solution in the Excel workbook. SDK exposes a standards-based Web Service API - enabling you to create models in PHPand JavaScript, even in a web browser or mobile phone, solve them "over the wire," anddeliver the solution in your "zero-footprint" application!5/28/2014WE DEMOCRATIZE ANALYTICS14
Loading and Solving ExcelOptimization Models in SDK To load a model built with Premium Solver Platform (C#)Step 1 – Create an instance of the problem:Using (Problem prob new Problem()) {Step 2 – Point to the problem:prob.Load(“C:\\.",File Format.XLStd);Step 3 – Solve the model:prob.Solver.Optimize();5/28/2014WE DEMOCRATIZE ANALYTICS15
Solver SDK Evaluators Use Solver SDK evaluators or callback functions for: Checking the progress of the Solver during the optimization process (ProgressInformation Evaluators) Check the optimization iteration number, report the current objective, check for auser abort code, etc. Provide the crucial role of computing constraint function values or passing gradient orHessian values when solving an optimization problem (Computing Evaluators). Calculate the objective or constraint function values. Use an evaluator of type Eval Type Function.5/28/2014WE DEMOCRATIZE ANALYTICS16
SDK Example Summary –Creating a C# Project Step 1 – Create a new project. Start Microsoft Visual Studio, select File New Project, select C# on the left of thedialog and Windows Forms Application from the right of the dialog under Templates. Type a name of your choice in the Project name field, and then click OK. Construct a form of your choice using the Visual Studio Toolbox. Step 2 – Set a reference. Click References in the Solution Explorer and select Add Reference. Choose your .NETversion: 1.1, 2.0-3.5, or 4.0-4.5.5/28/2014WE DEMOCRATIZE ANALYTICS17
SDK Example Summary –Creating a C# Project Step 3 – add an (optional) directive Using SolverPlatform Step 4 – Choose your approach to create the model In a linear model or quadratic model, you can supply the Solver SDK with theobjective and constraint coefficient matrices. Or you can supply an evaluator (Eval Type.Function) to compute the function(objective and constraint) values. Create and pass the function evaluator. prob.Evaluators[Eval Type.Function].OnEvaluate This evaluator will be called at every iteration, to compute the values of the objective andconstraints.5/28/2014WE DEMOCRATIZE ANALYTICS18
SDK ExampleSummary - Creating a C# Project Step 5 – Create the model Create an instance of the Problem class.Problem prob new problem(Solver Type.Minimize, nvars, ncons). Add variable and constraint definitions to the problem. Call prob.Solver.Optimize().5/28/2014WE DEMOCRATIZE ANALYTICS19
SDK ExampleSummary - Creating a C# Project Step 6 – Write the function evaluator if used.Problem p evaluator.Problem; Obtain a pointer, pVar, to the variables.double[] pVar p.VarDecision.Value.Array; Next, obtain a pointer to the constraint functions and calculate the constraints.double[] pFcn p.FcnConstraint.Value.Array;pFcn[0] formula; pFcn[1] formula; Calculate the objective.p.FcnObjective.Value[0] formula; Pass the constraint values back to the SDK.p.FcnConstraint.Value.Array pFcn; Tell the SDK to continue optimizing.Return Engine Action.Continue;5/28/2014WE DEMOCRATIZE ANALYTICS20
Building Multi-DimensionalAnalytical ModelsASP Dimensional Modeling5/28/201421WE DEMOCRATIZE ANALYTICS
Why Use Dimensional Modeling? Dimensional modeling turns a very complex, hard-to-maintain spreadsheet problem intoa simple, well-structured, easily maintained and expandable model. Where there are multiple products, projects or investments, multiple customer types,geographic regions, or time periods, multiple sources and destinations. Excel with PowerPivot is an industrial-strength tool for slicing and dicing multidimensional data from a variety of data sources. Now create multi-dimensional models, with formulas that reflect the dynamics ofexisting and future business situations, and easily link those models to Pivot Table data.5/28/2014WE DEMOCRATIZE ANALYTICS22
Elements of Dimensional Modeling –Dimensions A set of DecemberWest Give a name ( “Region”) for the dimension, and provide names/labels or numbersfor the elements of the dimension – “North,” “South,” “East” and “West.” A dimension doesn’t define the data itself – it defines a structure, relevant foryour business situation, for the data.5/28/2014WE DEMOCRATIZE ANALYTICS23
Elements of Dimensional Modeling –Cubes Cubes are multi-dimensional arrays holding the data. Other names used in data warehouse and business intelligence systems, aremeasures and/or fact tables. A cube holds a single attribute or measure (a set of numbers). Example: create a cube named “Sales,” defined over the “Regions” dimension, withnumeric values representing sales in the North, South, East and West regions. The structure of a cube is very much like a Pivot Table, and you can create a cube byplacing a PsiPivotCube() function in a cell, referencing an existing Pivot Table.5/28/2014WE DEMOCRATIZE ANALYTICS24
Cube Formulas –Operations and Dimensions You can multiply, add, subtract, divide, and perform other operations on cubes. If all participating cubes have the same dimensions, result cube will have those dimensions. Cube (4 dimensions) X Cube (same 4 dimensions) Cube (same 4 dimensions). Otherwise, the result cube will be a union of the participating dimension sets. Cube B2 (2 dimensions) X Cube C3 (1 dimension that also appears in the first cube) B2*C3(2 dimensional). Cube B2 (2 dimensions) X Cube C3 (1 dimension that doesn’t appear in the first cube) B2*C3(3 dimensional).5/28/2014WE DEMOCRATIZE ANALYTICS25
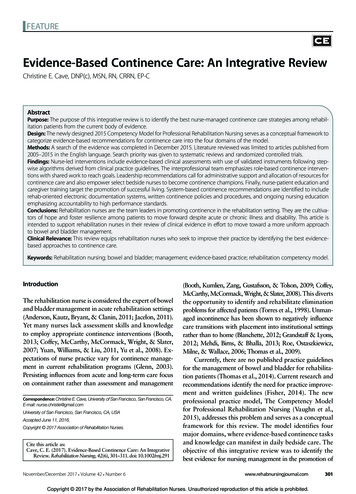
Cube Formulas – Reduction Cube Reduction is an operation of eliminating one or more dimensions by aggregating(for example summing) values along those dimensions. PSI supports reduction along one dimension only or along all dimensions. A cube reduced along all its dimensions will be a single value, or scalar. A cube can be aggregated using : Average, Sum, Maximum, Minimum, Variance, std.Deviation, Element, or Index.NorthSouthWestEastDimension: RegionCube: “Sales”100 120 150 300Reduce Cube using Sum: 100 120 150 300 6705/28/2014WE DEMOCRATIZE ANALYTICS26
Elements of Dimensional Modeling –Output Cell Range When we want to see results of optimization of a dimensional model on thespreadsheet, we use {PsiOptData()}. When we want to see other computed cube results on the spreadsheet, we use{PsiCubeData()}. The cell range will display all the values of the cube that is an argument to PsiOptData()or PsiCubeData(). PsiOptData() results appear after optimizing. PsiCubeData() results appear after Model – Cube Result – Calculate.5/28/2014WE DEMOCRATIZE ANALYTICS27
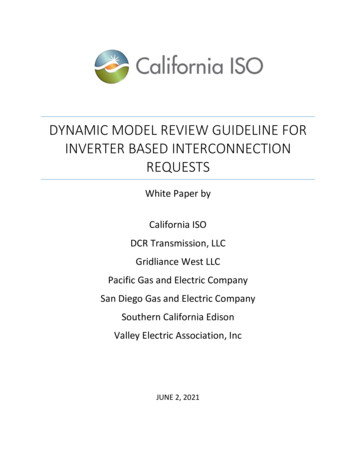
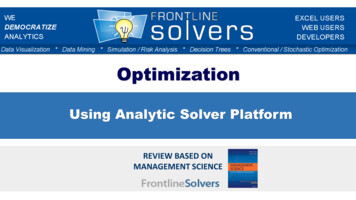
Transshipment Problem(2-Stage-Transport, Multi-Commodity)Factory Minimize the costs of shipping 3 differentgoods from factories to warehouses andcustomers, and warehouses tocustomers. While not exceeding the supply availablefrom each factory or the capacity of eachwarehouse, and meeting the demandfrom each 5/28/2014WE DEMOCRATIZE ANALYTICS28
Dimensional Modeling –Summary of Steps To add a dimension clickModel – Cube – From CellRange. To add a cube click on Model Click Model – Reduction.Tab on the RSP Ribbon.Choose Cube. Define Outputs. Select from Cell Range. Select the data range, relatedInput name, range, location,dimension/s and the locationand type.of the cube.5/28/2014WE DEMOCRATIZE ANALYTICS29
Third Session Summar
Loading and Solving Excel Optimization Models in SDK To load a model built with Premium Solver Platform (C#) Step 1 – Create an instance of the problem: Using (Problem prob new Problem()) { Step 2 – Point to the problem: prob.Load(“C:\\.",File_Format.XLStd); Step 3 – Solve the model: prob.Solver.Optimize(); 5/28/2014