Transcription
UNDERSTANDING BY DESIGN UNIT PLANStage 1 – Desired Results (NOTE: # these and include #s in Stage 3)Established GoalsAFDA.2 The student will useName: Brittany FrenchContent Area: MathUnit Topic: Function TransformationsGrade Level: Algebra 2 (10th/11th)Meaningknowledge of transformations to writean equation, given the graph of afunction (linear, quadratic,UNDERSTANDINGSESSENTIAL QUESTIONSStudents will Understand THAT.Students will keep considering.exponential, and logarithmic).AFDA.3 The student will collect dataand generate an equation for thecurve (linear, quadratic, exponential,and logarithmic) of best fit to modelreal-world problems or applications.Students will use the best fit equationto interpolate function values, makeU1: Graphs can be used to visualize the effectchanges have on the original equation.EQ1: How does using graphs help us analyzedata?U2: Where a constant is positioned determines theeffect it has on the graph.EQ2: How much of an effect does the placementof a constant have on an equation?U3: Linear, quadratic, exponential, and logarithmicgraphs can be used to represent real-world data.EQ3: What makes a line or curve the “best-fit” for aset of data?decisions, and justify conclusionswith algebraic and/or fy the effect on the graph ofreplacing f(x) by f(x) k, k f(x), f(kx),and f(x k) for specific valuesof k (both positive and negative); findthe value of k given the graphs.Experiment with cases and illustratean explanation of the effects on thegraph using technology.AcquisitionKNOWLEDGESKILLSStudents will know.Students will be able to. (include Bloom’s Label)K1: A transformation is a change applied to a function orgraph.K2: A parent function is the most basic form of a familyof functions.K3: A horizontal shift is represented by f(x k) andindicates a transformation directly to the left or right.K4: A vertical shift is represented by f(x) k and indicatesa transformation directly up or down.K5: A vertical stretch is represented by kf(x), where k isgreater than 1.K6: A vertical compression is represented by kf(x),where k is less than 1.D1: Identify the parent function for linear,quadratic, exponential, and logarithmic functions.(Comprehending)D2: Graph the following transformations for linear,quadratic, exponential, and logarithmic functions:f(x) k, f(x k), kf(x), f(kx). (Applying)D3: Construct and graph an equation from giventransformations. (Applying)D4: Determine the equation for linear, quadratic,Understanding by Design 2.0 - Wiggins and McTighe, 2011
UNDERSTANDING BY DESIGN UNIT PLANK7: A horizontal stretch is represented by f(kx), where kis less than 1.K8: A horizontal compression is represented by f(kx),where k is greater than 1.K9: A reflection over the x-axis occurs when f(x)becomes –f(x).K10: A reflection over the y-axis occurs when f(x)becomes f(-x).K11: The curve of best fit is the function that mostclosely approximates the values for a set of data.K12: To interpolate means to estimate new functionvalues from known function values.K13: The order to apply multiple transformations in.exponential, and logarithmic functions from agraph. (Analyzing)D5: Determine the curve of best fit for real-worlddata. (Analyzing)D6: Predict new values for real world data fromknown values. (Applying)Understanding by Design 2.0 - Wiggins and McTighe, 2011
UNDERSTANDING BY DESIGN UNIT PLANPerformance Assessment: Please Briefly Describe your GRASP and Rubric Categories here.ATTACH YOUR THOROUGH, DETAILED, STUDENT-FRIENDLY VERSION OF YOUR GRASP AND RUBRIC TO YOUR FINAL PROJECTStage 2 – EVIDENCE (PERFORMANCE ASSESSMENT)Rubric Criteria(Categories)GOAL: Determine when Tolland High School must build an addition in order to support the growingpopulation. Determine how many people this addition needs to fit in order to support another 20 years ofgrowth.ROLE: You are a population analyst who has been asked to determine when Tolland High School will reachmaximum capacity and propose how many people this addition should support.AUDIENCE: The Tolland Board of EducationSITUATION: Over the past few decades, Tolland’s population has been growing. Tolland High School isnearing its maximum capacity and therefore has decided it needs to start making a plan for adding anaddition to the school. They have decided the first step is to determine when the addition will be needed byand second they must decide how big the addition needs to be. They have hired a population analyst todetermine how quickly the population is growing, predict in what year the High School will reach capacity,and look at future predictions to determine how big the addition must be in order to support the populationfor at least 20 years following its construction. The analyst will present this material to the Board ofEducation so they can begin creating a timeline and budget for construction of the addition.PERFORMANCE/PRODUCT: A presentation that includes past population data, a curve of best fit thatrepresents the past data and can be used to predict future population levels, an explanation of the parentfunction chosen for the data and the transformations applied to it, an estimation of when the school willreach capacity, and a proposal on how many people the new addition must fit in order to support thepopulation for 20 years after its construction.Understanding by Design 2.0 - Wiggins and McTighe, 2011
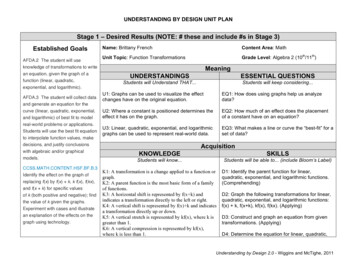
Tolland High School Is Running Out of Room!GOAL: Determine when Tolland High School will reach maximum capacity and how large of anaddition will be needed to accommodate that growth.ROLE: Population analyst(Someone who analyzes how a specific population with grow over a period of time)AUDIENCE: Tolland Board of EducationSITUATION: Over the past few decades, Tolland’s population has been growing! This growth isgreat for the town, but the High School is running out of room and quickly nearing theirmaximum capacity. They have decided it is time to begin making plans to add an addition to theHigh School to support the growing population.You have been hired to analyze how quickly the population is growing based on pastdata and predict when they will reach capacity. This will help the Board of Education create atimeline and budget for construction of the new addition. In addition, they want you todetermine how many people the new addition must fit in order to support the studentpopulation for at least another 20 years after 16Population (of studentsin high 52864878891932967Maximum Capacity of High School: 1,100 students
PERFORMANCE/PRODUCT: A presentation that includes:1. Your Curve of Best Fit (D5, K11) accompanied bya. Your chosen independent and dependent variables including what theyrepresentb. A scatter plot of the given datac. The parent function you chose and its graph (K2)i. Provide an explanation of this choiced. The transformations you applied (D2)i. Provide explanations of what transformations you used, in what order,and why (U1, U2, U3, K13)2. Your Capacity Predictiona. Use interpolation to predict when the school will reach capacity. (K12, D6)b. Prediction should be in the form of a school year (i.e. “In the 2022-2023 schoolyear, the high school will not fit the student population.”)c. An explanation for your prediction supported by algebraic and graphicalevidence (U1, U2, U3)3. Size of the Addition Proposala. Use interpolation to determine a proposal for how many people you think theaddition should fit to support the population for 20 years after the addition iscompleted (K12, D6)i. Estimation should be rounded to an appropriate amount of whole peopleb. An explanation for your prediction supported by algebra and graphical evidence(U1, U2, U3)
Rubric for Function Transformation Performance AssessmentCurve of Best Fit (D5)(24 points)*multiply by 637.5%4Includes all of the following: Appropriate choice ofindependent and dependentvariables Accurate scatter plot Parent function chosen isappropriate for the givendata (K2, U3) Parent function backed upwith sound mathematicalsupport (U1, U3) Transformations applied areappropriate for the givendata to get a curve of best fitand applied correctly (K11,U2) Transformations are backedup with sound mathematicalsupport (U1, U2) Order in whichtransformations are appliedis appropriate (K13) Order of transformations isbacked by soundmathematical support (U1,U2) At least 3 differenttransformations used. (D2) Accurate graph of curve ofbest fit is provided (D2)3Includes 2 of the followingunderdevelopments: Independent anddepend variables chosenare appropriate but notdefined or labeled Parent function chosenis appropriate for thegiven data but there is aminor error in theexplanation Transformations areappropriately chosen butthe wrong order isapplied to get the finalfunction A function and graph ofthe curve of best fitincluded but missingchoice of parentfunction, 3 (or more)transformations, scatterplot, OR explanations Minor errors in thescatter plot or graph ofcurve of best fit2Includes 2 or more of thefollowing: Inappropriate choice ofindependent ordependent variables The parent functionchosen is notappropriate for the givendata but there is someevidence ofunderstanding in theexplanation OR theparent function chosenis appropriate but thereis no explanation The transformationschosen are notappropriate for the givendata but there is someevidence ofunderstanding in theexplanation OR thetransformations areappropriate but there isno explanation The function of the curveof best fit is included butthe graph is not included Major errors in thescatter plot or graph1Includes 2 or more of thefollowing: The parent functionchosen is notappropriate for the givendata and there is noexplanation orexplanation is notaccurate The transformationschosen are notappropriate for the givendata and there is noexplanation orexplanation is notaccurate The scatter plot,function, and graph forthe curve of best fit ismissing No transformationsapplied No algebraic or graphicalevidence andexplanations provided
Capacity Predication(16 points)*multiply by 425%*evaluatedindependent of thecorrectness of thefunctionSize of AdditionProposal(16 points)*multiply by 425%*evaluatedindependent of thecorrectness of thefunctionIncludes all of the following: Curve of best fit usedcorrectly to determine theprediction of when capacitywill be reached. (K12, D6) Prediction supported bysound algebraic evidenceshowing all work andgraphical evidence withprediction identified (U1, U2,U3) Appropriately estimated tothe nearest yearIncludes 1 of the followingunderdevelopments: The curve of best fit isused correctly to predictwhen capacity will bereached but there are 12 minor errors in thecalculations Mathematically accurateprediction provided, butmissing algebraic ORgraphical support Error in incorrectIncludes 2 of the followingunderdevelopments: The curve of best fit isused correctly to predictwhen capacity will bereached but there are 12 minor errors in thecalculations Mathematically accurateprediction provided, butmissing algebraic ORgraphical support Error in incorrectIncludes 2 or more of thefollowing: The curve of best fit isused incorrectly todetermine the predictionof when capacity will bereached No algebraic norgraphical supportprovided Estimation is incorrectIncludes all of the following: Curve of best fit usedcorrectly to determine theproposed size of theaddition. (K12, D6) Proposal supported by soundalgebraic evidence showingall work and graphicalevidence with proposalidentified (U1, U2, U3) Appropriately estimated to awhole number of peopleIncludes 1 of the followingunderdevelopments: The curve of best fit isused correctly todetermine the proposedsize of the addition butthere are 1-2 minorerrors in the math or thegraph Mathematically accurateproposal provided, butmissing algebraic ORgraphical support Error in incorrectIncludes 2 of the followingunderdevelopments: The curve of best fit isused correctly todetermine the proposedsize of the addition butthere are 1-2 minorerrors in the math or thegraph Mathematically accurateproposal provided, butmissing algebraic ORgraphical support Error in incorrectIncludes 2 or more of thefollowing: The curve of best fit isused incorrectly todetermine the proposalfor the size of theaddition No algebraic norgraphical supportprovided Estimation is incorrect
Presentation Quality(8 points)*multiply by 212.5% Well organized – an observercan make sense of all theinformation presentedwithout needing to askclarifying questions. The student cancommunicate informationand explanations clearly andhas obviously practicedmultiple times.The presentation medium(poster, PowerPoint, etc.) hasno written or technical errors Organized for the mostpart – an observer needsto ask only 1-2 clarifyingquestions to make senseof the informationpresented. The student cancommunicate most ofthe information andexplanations clearly buthas 1-2 fumbles. Itappears the studentpracticed at least once.The presentation medium(poster, PowerPoint, etc.)has 1 major or 1-3 minorwritten or technical errors Very little organization –an observer needs to ask3 or more clarifyingquestions to make senseof the informationpresented. The student has troublecommunicating one ortwo big ideas orexplanations. It appearsthe student didn’t gothrough a full practicerun beforehand. The presentationmedium (poster,PowerPoint, etc.) haseither 1 major and 1-3minor written ortechnical errors, 2 majorwritten or technicalerrors, or 4-6 minorwritten or technicalerrors. No organization – anobserver doesn’t knowwhat questions to ask tobegin to comprehendthe informationpresented. The student has troublecommunicating theinformation andexplanations throughoutthe presentation. It isclear the student didn’tpractice at allbeforehand. The presentationmedium (poster,PowerPoint, etc.) hasmore than 2 majorwritten or technicalerrors or more than 6minor written ortechnical errors.
UNDERSTANDING BY DESIGN UNIT PLANSTAGE 3: THE LEARNING/FORMATIVE ASSESSMENT PLAN (USE AS MANY ROWS AS NECESSARY)Lesson # &Topic/FocusLesson 1:ParentFunctions andVertical Shiftsf(x) kUKDs (You caninclude #sfrom Stage 1)U2, K1, K2, K4,D1, D2Concrete GROUP Formative Assessments(Thoroughly Describe and/or Attach)Concrete INDIVIDUAL Formative Assessments(Thoroughly Describe and/or Attach)This lesson will start out with an introductionto what function transformations are. This willinvolve learning what parent functions are andhow to identify them. Once this material isintroduced the students will play the gameMemory Match with parent functions. Theteacher will randomly sort students intogroups of 2-3. The deck of memory matchcards given to each group will have variousgraphs drawn on half and the labels linear,quadratic, exponential, and logarithmic on theother half. Students will lay all the cards facedown and take turns flipping two cards over ata time. If they flip over a graph and itscorresponding parent function (linear,quadratic, exponential, or logarithmic) thenthey have a match and get to go again! If it isnot a match then the next student takes aturn. While the games are occurring theteacher will walk around making note of whichmatches students are struggling with themost. When a group completes a game theymust raise their hands so that the teacher cancheck that all their matches are accurate. Ifthere are errors they will be told to work as agroup to find and correct the errors so that allmatches are accurate. If there are no errorsor they have fixed them all and there is stilltime, they will be provided with a new deck.The teacher will have multiple decks ofincreasing difficulty so that groups that areprogressing quicker with the concept andgame can develop a deeper understanding.At the end of the lesson students will completean exit slip that is an altered form of a FrayerDiagram. This will assess their understanding ofvertical shifts and their ability to work withvertical shifts by asking them to produceexamples and non-examples. It will also bring inthe topic of parent functions by having themidentify the parent functions that go with theirexamples. Based on how students do with thiswill determine how the next lesson will begin. Ifthere is confusion on parent functions, that willneed to be addressed before the teacher cancontinue on with teaching more transformations.If there are difficulties with vertical shifts, thenthe next lesson will begin with white boardpractice with vertical shifts to help students getmore comfortable with the concept and havemore practice time.Understanding by Design 2.0 - Wiggins and McTighe, 2011
UNDERSTANDING BY DESIGN UNIT PLANLesson 2:VerticalStretches/Compressionskf(x)U2, K2, K5, K6,D1, D2, D3, D4Lesson 3:Horizontal Shiftsf(x k)U1, U2, K1, K3,D3, D4After the teacher gives an introduction tovertical shifts and compressions and worksthrough some examples with the class on theboard, the will do a White Board activity.This will begin with the teacher writing afunction on the board that includes verticalshifts (from lesson 1) and/or vertical stretchesand compressions. Students will sketch thegraph on their white boards (which will havecoordinate planes on them) and then holdthem up for the teacher to see. While they aresketching the teacher will walk around andobserve how the students are doing with thesketching process to help determine if acertain type needs more practice (this willguide what functions they try to graph nextand how quickly the difficulty of the functionswill increase). After the students begin tograsp the ability to graph these verticaltransformations, the teacher will give them asecond marker in a different color. This timethey will graph two functions at the same timeto see how changing the constant affects the2graph. For example: graphing f(x) x 6 and22f(x) x -6 or graphing f(x) 3x and f(x) 2(1/3)x .At the end of this lesson the class will do aGraffiti Wall to help tie together all thetransformations covered so far and bring inthe order to apply them. Students will bedivided into 8 groups (probably 2-3 people pergroup). There will be 4 graphs (one linear,one quadratic, one exponential, and onelogarithmic) on large sheets of paper alongone wall and the same four along the oppositewall. Each group will be assigned to a startinggraph and a colored marker and will thenrotate among the four graphs on their side ofthe room. The instructions (which will beshown via a PowerPoint one step at a time)will be:At the end of the lesson students will completean Exit Slip. This exit slip will allow students todisplay their understanding of vertical stretchesand compressions via words and pictures aswell as practice with graphing a vertical stretch.Finally, it asks students to determine thefunction from a picture of a graph with a verticalcompression. It is important for students to bothbe able to produce the graphs and deduce thefunction from a graph to ensure a completeunderstanding of vertical stretches andcompressions. The results of this exit slip willbe used to determine if any review or reteaching needs to occur prior to continuing ontothe next topic.At the end of the lesson, students will completean Exit Slip. This exit slip will check in on theirunderstanding of transformations as a whole,have them practice explaining the concept tosomeone else, and have them deduce a functionfrom a graph that includes a horizontal shift.Asking students to explain the steps is veryimportant for this topic because many studentsfall trap to common misconceptions abouthorizontal shifts. By asking them to explain itwill allow the teacher to see if they know why“ k” means go k units to the left (not the right!).If they can understand why it happens then theyare much more likely to not make the commonmistake than if they just know that the algorithmUnderstanding by Design 2.0 - Wiggins and McTighe, 2011
UNDERSTANDING BY DESIGN UNIT PLANLesson 4:HorizontalStretches/U1, U2, K3, K7,K8, D2, D31. Write down the equation for yourgraph.2. Rotate one graph to your right.3. Check and make corrections to anyprior work. Then label the types oftransformations in the equation(vertical shift, vertical compression,etc )4. Rotate one graph to your right.5. Check and make corrections to anyprior work. Then describe the types oftransformations (vertical shift by afactor of 2, vertical compression by afactor of ½, etc )6. Rotate one graph to your right.7. Check and make corrections to anyprior work. Then number thetransformations in the order you thinkthey were applied.While students are working on this, theteacher will walk around to answer questionsand observe the work students are doing. Ifthere are errors in the work, the teacher willstep in and ask some probing questions to getstudents back on track.Once students complete this they will presenttheir graph (the one they ended at) to thegroup. Since there are two of each graph, thegroups that have the same ones will presentback to back so that comparisons can bemade. If there are still errors in thepresentation stage, then the class will worktogether to correct them with guidance fromthe teacher when necessary.This Graffiti Wall serves to bring together allthe information covered so far and see howstudents are doing putting it all together.After the teacher gives the introduction tohorizontal stretches and compressions,students will practice with a White Boardactivity. This will begin similarly to the whitetells them to go left for positive numbers. Theresults of this exit slip will be used to determineif students need more practice with horizontalshifts, specifically understanding how and whythey work, before continuing onto verticalstretches and compressions (especially sincethis is also another topic which many studentsmix up).At the end of the lesson, students will completean Exit Slip. This exit slip will check in withwhere students are with all of the horizontaltransformations covered so far by having themUnderstanding by Design 2.0 - Wiggins and McTighe, 2011
UNDERSTANDING BY DESIGN UNIT PLANCompressionsf(kx)Lesson 5:U1, U2, K1, K3-board activity from lesson 2 with the teacherwriting down functions on the board thatinclude horizontal shifts, stretches, andcompressions and the students drawing it ontheir white boards and holding them up. Aftera few practice problems as a whole class tomake sure everyone has the idea, the teacherwill divide students up into groups based onthe readiness they have displayed in the firstfew examples and throughout the unit so far(specifically with graphing thetransformations). The teacher will have threelists of functions prepared – each of whichincreases in difficulty at a different pace.Each of these lists includes all the horizontaltransformations for each of the four types offunctions (linear, quadratic, exponential, andlogarithmic). The more challenging list willinclude functions that include multipletransformations and bring in all the verticaltransformations as well. The less challengingone will begin with only one transformation ata time and slowly lead up to incorporatingmultiple. The one in the middle will focusmostly on functions with two transformationsand towards the end a couple with three orfour.In these groups students will work together tograph each of the functions on their list. Aworksheet will be provided as well for themto record their answers on after they haveworked them out on the white board. Theteacher will be randomly collecting oneworksheet from each group so all studentsmust be filling it out.The teacher will cycle around to the groupsanswering questions, listening to discussions,and asking probing questions to get them onthe right track.This lesson will begin with an introduction toreflections (which are a special type ofcomplete a Venn Diagram comparing andcontrasting them. It then has students practicespecifically with the horizontal stretches andcompressions taught that day by having themcompose a function from given transformationsand then graph it. Since horizontalcompressions and stretches are also a commonplace where students can fall trap tomisconceptions, they are asked at the end toexplain why what they are given is a stretch andnot a compression. Based on these exit slips,the teacher will decide if more practice withhorizontal transformations is needed beforemoving on. Specifically, the teacher will belooking for if students are falling trap to themisconception or not. If they are, then thiswould be an important thing to address throughmore activities and practice with horizontalstretches and compressions before moving on.This lesson focused on combining all thetransformations together. So at the end of theUnderstanding by Design 2.0 - Wiggins and McTighe, 2011
UNDERSTANDING BY DESIGN UNIT PLANReflections andCombiningTransformations10, K13, D2U3, K11, K12,vertical stretches and compressions). Afterthis, students will have been exposed to allthe different transformations covered in theunit so it would be beneficial to check in ontheir understanding of the concept oftransformations by seeing how students woulddefine a transformation. This will be donethrough a Think/Pair/Share. First studentswill be instructed to think about and writedown in their notebooks how they woulddefine a transformation. Next, they wouldshare their definitions with their elbow partnerand together create a new definition they bothagree on. Finally, the class as a whole woulddiscuss it and come up with a final definitionto hang up in the classroom. This discussionwill give insight to the teacher on how wellthey have grasped the concepts oftransformations and what can be considered atransformation. Based on how studentsdiscussion goes will determine how much theteacher must intervene to further explain theconcept or provide probing questions.lesson, the Exit Slip is going to be similar to thematrix done during class, but then take it onestep further and have students order and applythe transformations by graphing them one stepat a time. Finally, the last question on this exitslip allows students to reflect on how doing thisprocess helps them (or does not help them).This allows the teacher to see both how theylearn and helps the students to self-reflect onwhat works best for them. The responses to thisexit slip will help to determine how much morepractice with transformations is needed beforestudents are ready to applying them to realworld data. If students are still struggling (basedon results from both this exit slip and the groupformative assessment from this day), then moreactivities and white board practice will beincluded at the beginning of the next day. It isvery important for students to be able to pull allthe transformations together before they moveonto curve of best fit, which will require them tochoose and apply the appropriatetransformations.A second group formative assessment will bedone this lesson to help students practicewith identifying each of the transformationsthat different functions are composed of. Thiswill be done with a Matrix Activity. Studentswill be divided into groups of 3-4 students tocomplete the matrix. The teacher will walkaround to answer questions and provideprobing questions to get students on track ordeepen their understanding. If a groupfinishes early, they will be provided with whiteboards to then practice graphing each of thefunctions on the matrix. If time permits, eachgroup will get to graph at least somefunctions on the white boards.This last lesson focuses on the topic of thecurve of best fit and interpolating. Both ofAt the end of this lesson on using real worlddata and therefore introducing the topics ofUnderstanding by Design 2.0 - Wiggins and McTighe, 2011
UNDERSTANDING BY DESIGN UNIT PLANLesson 6;Curve of Best FitandInterpolatingD5, D6these directly relate to working with real worlddata. To practice identifying the curve of bestfit for real world data, students will partake ina Closed Sort. They will be randomly dividedinto groups of 2-3 students. Each group willbe given notecards that have either a table ofdata or a scatter plot representing real worlddata. The groups will then sort the notecardsinto the groups: linear, quadratic,exponential, and logarithmic. This means theywould be sorting the notecards based onwhich type of function would be used to makethe curve of best fit.Once a group completes the sort, they willcompare with another group who is finishedand discuss why they put each notecard in thecategory they chose. Some notecards will beable to go in multiple categories so it’simportant for the students to both be able toback up why they chose one over the otherand also be able to understand that there canbe more than one option as long as it isappropriately supported.After this, each group will pick one of thenotecards from each of their four categoriesand come up with a function (including sometransformations) that would be an appropriatecurve of best fit. Each notecard will also havea number in the upper right hand corner.Student will then use the function theyproduced to interpolate for the value writtenin that top right corner. They will write theirfunction, show their work for interpolating,and write a sentence interpreting what theirresult means for the set of data on the backof the notecard. These notecards will becollected by the teacher at the end of thelesson.Throughout this activity the teacher will becycling around to check in on how studentsare doing and listen to their discussions.curve of best fit and interpolating, students willcomplete an Exit Slip. This exit slip will beginby checking that students do know what a curveof best fit is and how they would describe it.Next, they are given a scatter plot and somequestions that
UNDERSTANDING BY DESIGN UNIT PLAN Understanding by Design 2.0 - Wiggins and McTighe, 2011 Stage 1 – Desired Results (NOTE: # these and include #s in Stage 3) Established Goals AFDA.2 The student will use knowledge of transformations to write an equation, given the graph of a fu