Transcription
The U.S. Trade Situation for Fruit andVegetable ProductsRenée JohnsonSpecialist in Agricultural PolicyDecember 1, 2016Congressional Research Service7-5700www.crs.govRL34468
The U.S. Trade Situation for Fruit and Vegetable ProductsSummaryOver the last decade, there has been a growing U.S. trade deficit in fresh and processed fruits andvegetables. Although U.S. fruit and vegetable exports totaled 6.3 billion in 2015, U.S. imports offruits and vegetables were 17.6 billion, resulting in a gap between imports and exports of 11.4billion (excludes nuts and processed nut products). This trade deficit has generally widened overtime as growth in imports has outpaced export growth. As a result, the United States has gonefrom being a net exporter of fresh and processed fruits and vegetables in the early 1970s to beinga net importer of fruits and vegetables today.A number of factors shaping current competitive market conditions worldwide, and global tradein fruits and vegetables in particular, partially explain the rising fruit and vegetable trade deficit.These include: a relatively open domestic import regime and lower average import tariffs in theUnited States, with products from most leading suppliers entering the U.S. dutyfree or at preferential duty rates;increased competition from low-cost or government-subsidized production;continued non-tariff trade barriers to U.S. exports in some countries, such asimport and inspection requirements, technical product standards, and sanitary andphytosanitary (SPS) requirements;opportunities for counter-seasonal supplies, driven in part by increased domesticand year-round demand for fruits and vegetables; andother market factors, such as exchange rate fluctuations and structural changes inthe U.S. food industry, as well as increased U.S. overseas investment anddiversification in market sourcing by U.S. companies.In the buildup to the 2008 farm bill (Food, Conservation, and Energy Act of 2008, P.L. 110-246),the trade situation contributed to demands by the U.S. produce sector that Congress considerexpanding support for domestic fruit and vegetable growers in farm bill legislation. Historically,fruit and vegetable crops have not benefitted from the federal farm support programs traditionallyincluded in the farm bill, compared to the long-standing support provided to the main programcommodities (such as grains, oilseeds, cotton, sugar, and milk).The 2008 farm bill provided additional support for specialty crop programs, as well as organicprograms. The farm bill also reauthorized two programs intended to address existing tradebarriers and marketing of U.S. specialty crops, including (1) USDA’s Market Access Program(MAP) to promote domestic agricultural exports, including specialty crops and organicagriculture; and (2) Technical Assistance for Specialty Crops (TASC) to address sanitary andphytosanitary (SPS) and technical barriers to U.S. exports. The 2014 farm bill (Agricultural Actof 2014, P.L. 113-79) reauthorized and expanded many of the provisions benefitting specialtycrop growers.Congressional Research Service
The U.S. Trade Situation for Fruit and Vegetable ProductsContentsFruit and Vegetable Trade Situation . 2Summary . 2Product Overview. 3Importing Country Overview . 3Competitive Market Situation . 5Domestic Import Regime . 5Global Competition . 7Non-Tariff Trade Barriers. 9Seasonal Supplies . 12Other Market Factors . 13Congressional Action . 15FiguresFigure 1. U.S. Fruit and Vegetable Trade (Excluding Nuts), 1990-2015 . 1TablesTable 1. Value of U.S. Fruit and Vegetable Trade, 1990-2015 . 2Table 2. Country Suppliers of U.S. Fruit and Vegetable Imports . 4Table 3. Import Share of U.S. Fresh Fruit and Vegetable Demand . 13ContactsAuthor Contact Information . 16Congressional Research Service
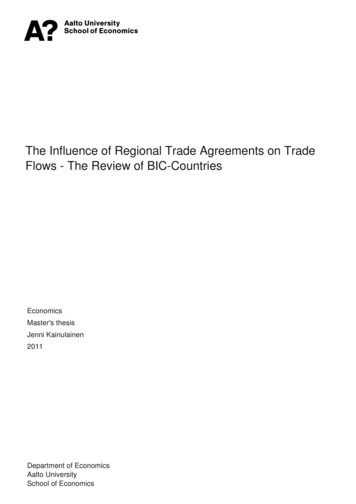
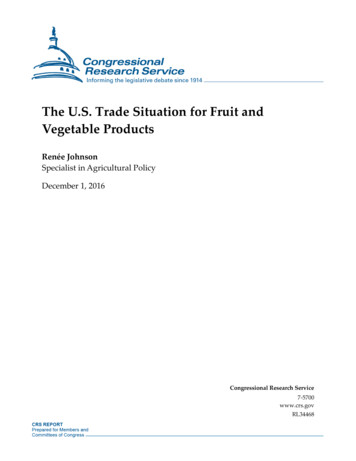
The U.S. Trade Situation for Fruit and Vegetable ProductsOver the last decade there has been a growing U.S. trade deficit in fresh and processedfruits and vegetables. Although U.S. fruit and vegetable exports totaled more than 6billion in 2015, U.S. imports were nearly 18 billion, resulting in a gap between importsand exports of more than 11 billion for the year (Figure 1). This trade deficit has widened overtime, as growth in imports has outpaced export growth. As a result, the United States has gonefrom being a net exporter of fruits and vegetables in the 1970s to having a net trade balance in themid-1990s to being a net importer today.Figure 1. U.S. Fruit and Vegetable Trade (Excluding Nuts), 1990-2015Source: Compiled by CRS from data in the U.S. International Trade Commission’s Trade DataWeb database(version 2.8.4). Includes fresh and processed products; excludes nuts.A number of factors are shaping current competitive market conditions worldwide and globaltrade in fruits and vegetables. In the buildup to the 2008 farm bill (Food, Conservation, andEnergy Act of 2008, P.L. 110-246), the trade situation contributed to demands by the U.S.produce sector that Congress consider expanding support for domestic fruit and vegetablegrowers in farm bill legislation. Historically, specialty crops1 had not benefitted from the federalfarm support programs traditionally included in the farm bill, compared to the long-standingsupport provided to the main program commodities (such as grains, oilseeds, cotton, sugar, andmilk). The 2008 farm bill, and later the 2014 farm bill (Agricultural Act of 2014, P.L. 113-79),provided additional support for programs supporting fruit and vegetable production, as well asprograms addressing existing trade barriers and marketing of U.S. specialty crops.This report presents recent trends in U.S. fruit and vegetable trade, and highlights some of thefactors contributing to these trends. This summary excludes trade data for tree nuts and processedtree nut products. Although not presented here, U.S. exports and imports of tree nuts andprocessed tree nut products (excluding peanuts) have shown continued increases and, generally, agrowing U.S. trade surplus.1Specialty crops include fruits and vegetables, tree nuts (not including peanuts), dried fruits, nursery crops, andfloriculture, as defined by the Specialty Crops Competitiveness Act of 2004 (P.L. 108-465).Congressional Research Service1
The U.S. Trade Situation for Fruit and Vegetable ProductsFruit and Vegetable Trade SituationSummaryThe U.S. trade deficit in fresh and processed fruits and vegetables totaled more than 11 billion in2015, following a decade of steady gains in U.S. imports, with more variable gains in U.S.exports (Table 1, Figure 1). In the early 1990s, U.S. imports and exports of fresh and processedfruits and vegetables were more or less in balance, with some years showing the United States asa net exporter. This situation reversed in the mid-1990s. Despite rising U.S. exports of fruits andvegetables, growth in U.S. imports has outpaced export growth. Since the 1990s, imports havegrown by an average of about 5% each year, whereas exports grew an average rate of about 1%during the same period, measured in terms of trade value (Table 1). The gap between imports andexports has grown from 0.5 billion in 1990 to more than 11 billion in 2015. The gap in tradereached an estimated high of 11.4 billion in 2015, given continued import gains accompanied bystagnated or decreasing exports. This deficit cannot be solely explained by imports of bananas(Table 1), which are generally not grown in the United States.Table 1. Value of U.S. Fruit and Vegetable Trade, 1990-2015Product Category199019952000200520102015( billions)% Change1990-2015ImportsFresh, dried, frozen fruit1.31.82.64.35.6Fresh, dried, frozen, preserved veg.1.82.33.24.87.35.55%Processed fruits and 65%Fresh, dried, frozen, preserved fruit1.41.71.92.02.83.44%Fresh, dried, frozen, preserved veg.2.22.92.53.24.71.6-1%Processed fruits and %Fresh, dried, frozen fruit0.1-0.1-0.9-2.3-2.7-3.2—-Fresh, dried, frozen, preserved 4Total6.67%ExportsTotalNet Trade (exports less imports)Processed fruits and vegetablesTotalImports, Fresh, dried, bananasb2.1—-Source: CRS using data in the U.S. International Trade Commission’s Trade DataWeb database. Includes freshand processed products as reflected in U.S. Harmonized Tariff Schedule (HTS) chapters 07, 08, and 20, excludingnut products (HTS 801, 802, 2008.11, and 2008.19). Totals may not add due to rounding. Data are actual(nominal) and not corrected for inflation.a. Based on compound annual rate of growth, or the year-over-year growth rate, over period.b. As of 2012, all products imported under HTS 0803.90. Previous years included plantains.Congressional Research Service2
The U.S. Trade Situation for Fruit and Vegetable ProductsProduct OverviewTable 1 breaks down U.S. trade into three major product categories: (1) fresh fruit, includingdried, frozen, or otherwise preserved, (2) fresh vegetables, including dried, frozen, or otherwisepreserved, and (3) processed fruit and vegetable products.Since the mid-1990s, the value of U.S. fruit and vegetable exports has nearly doubled, with thelargest gains in exports of fresh fruits and processed products. For fresh fruits, export gains weregreatest for strawberries/berries, peaches/pears, apples, grapes, and other miscellaneous freshfruit. For fresh vegetables, export gains were greatest for lettuce, spinach, tomatoes, potatoes, andlegumes/beans. For processed products, export gains were for processed potato products, certainpreserved vegetables, fruit juices and juice mixtures, and other processed fruit and vegetableproducts.Gains in imports, however, have exceeded those for exports, as the total value of U.S. fruit andvegetable imports has more than tripled since the 1990s. Increased imports were greatest for freshcitrus, strawberries/berries, tropical fruits (excluding bananas), grapes, peaches/pears,plums/apricots, and apples. Imports of fresh vegetables and processed products were higheracross most categories. Imports of preserved mushrooms and processed tomatoes declined overthe period.2Together, roughly one-half of this trade deficit for fruits and vegetables was composed of bananasand fresh tomatoes and other vegetables, including bell peppers. Given that the value of U.S.banana imports has remained largely unchanged, imports of fresh tomatoes and peppers, amongother fresh and frozen vegetables, have accounted for the widening gap in U.S. trade.3 Otherproducts with a large and increasing net trade value include other tropical fruits, grapes,asparagus, cucumbers, canned fruit, fruit juices and juice mixtures, olives, and miscellaneousfresh fruits and preserved vegetables.Importing Country OverviewTable 2 breaks down U.S. fruit and vegetable imports from the leading supplying countries in2015. In descending order (by the share of total import value in 2015), these include Mexico(44%), Canada (12%), Chile (8%), the European Union (7%), China (6%), Peru (5%), and CostaRica (3%). Other leading import suppliers were Guatemala, Thailand, Brazil, Argentina, Turkey,the Philippines, and Ecuador. All other importing countries accounted for about 5% of trade. Themajor imported products were tomatoes, peppers, bananas, other tropical fruits, potatoes, onions,garlic, cucumbers, melon, citrus, grapes, tree fruit, fruit juices, and various fresh and processedproducts.2Does not include ketchup and tomato sauces (HTS 2103.2), of which the United States remains a net exporter despiteincreasing product imports.3Both U.S. and Canadian tomato growers initiated import injury cases against each other, which were resolved in 2002with identical rulings of no material injury; a prior case brought by U.S. growers against Mexico was suspended. SeeUSITC, “Import Injury Investigations Case Statistics (FY 1980-2008),” February 2010, http://www.usitc.gov/trade remedy/documents/historical case stats.pdf.Congressional Research Service3
The U.S. Trade Situation for Fruit and Vegetable ProductsTable 2. Country Suppliers of U.S. Fruit and Vegetable Imports200520152005ShareLeading Product Imports ofFruits and Vegetables (2015)2015Share( millions)CountryMexico4,32410,41333%44%Tomatoes, avocados, peppers, grapes,cucumbers, melons, berries, onions, es, tomatoes, peppers, cranberries,cucumbers, other types of vegetables and fruitsChile1,1841,9509%8%Grapes, cranberries, avocados, apples, berries,fruit juices, plums, cherriesEU-281,10816309%7%Olives, mandarins, peppers, otherfresh/preserved fruits and vegetablesChina7231,4046%6%Fruit juices, processed fruit products,prepared/frozen vegetables/fruits, onions/garlic,preserved mushrooms.Peru2721,1142%5%Asparagus, other preserved/frozen vegetables,grapes, onions, tropical fruitsCosta Rica6347375%3%Pineapples, bananas, orange juice, melons,tropical and preserved fruits and vegetablesGuatemala4454673%2%Bananas and tropical fruits, preserved/frozenfruits/vegetables, melons, tomatoesThailand2764062%2%Pineapples, peaches, fruit juices, other tropicaland fresh/preserved fruits and vegetablesBrazil2623662%2%Orange juice, grapes, other fruit juices, tropicalfruits and vegetablesArgentina2513012%1%Fruit juices, berries, olives, strawberries, grapes,garlicTurkey1002281%1%Dried apricots, fruit juice, tomatoes, berries, figsPhilippines1882141%1%Fresh pineapples and juice, bananas, tropical fruitsand vegetables, mixturesEcuador3571893%1%Bananas, other tropical and fresh/preserved fruitsand vegetables, fruit juicesAll Source: CRS using data in the U.S. International Trade Commission’s Trade DataWeb database. Includes freshand processed products (HTS categories 07, 08, and 20), excluding nut products (HTS 801, 802, 2008.11, and2008.19). Totals may not add due to rounding. Data are actual (nominal) and not corrected for inflation.a. Based on compound annual rate of growth, or the year-over-year growth rate, over period.Congressional Research Service4
The U.S. Trade Situation for Fruit and Vegetable ProductsCompetitive Market SituationA number of factors are shaping current competitive market and trade conditions worldwide, andmay be contributing to trends in U.S. fruit and vegetable trade: a relatively open U.S. import regime and lower average import tariffs in theUnited States, with products from most leading suppliers entering the U.S. dutyfree or at preferential duty rates;increased competition from low-cost or subsidized production of fruit andvegetable products;continued non-tariff trade barriers to U.S. exports in some countries,including restrictive import and inspection requirements, technical productstandards, and sanitary and phytosanitary (SPS) requirements;opportunities for counter-seasonal supplies, driven, in part, by increaseddomestic and year-round demand for fruits and vegetables; andother market factors, such as exchange rate fluctuations and structural changesin the U.S. food industry, as well as increased U.S. overseas investment anddiversification in market sourcing by U.S. companies.Domestic Import RegimeLower tariffs on U.S. fruit and vegetable imports combined with relatively higher tariffs on U.S.exports into other countries, in part, may explain why U.S. export growth has not kept pace withimport growth. The U.S. Department of Agriculture (USDA) reports that the global average tarifffor fruits and vegetables is more than 50% of the import value.4 In the United States, however,about 60% of U.S. tariffs on fruits and vegetables are less than 5%. This compares to Japan andthe European Union (EU), where more than 60% of import tariffs range from 5%-25%;additionally, nearly 20% of tariffs exceed 25%. Import tariffs in some developing countries areoften higher, with more than 80% of tariffs ranging from more than 25% to over 100%.5Countries with relatively high tariffs on fruit and vegetable imports include China, Egypt, India,Korea, and Thailand.Most of the leading import suppliers of fruits and vegetables to the United States are granted tradepreferences under an existing free trade agreement (Canada and Mexico, Australia, Chile, Peru,and several Central American and some Middle Eastern nations), pending or negotiated free tradeagreements, or other types of preferential arrangements (Argentina, Brazil, Ecuador, Thailand).6Such trade preferences allow imports to the United States to enter duty-free or at reduced rates,and may be contributing to rapid import growth. In some cases, duty-free or reduced tariffsprovide an added advantage to supplying countries that may already benefit from lower-cost fruitand vegetable production compared to that in the United States.4B. Krissoff and J. Waino, “U.S. Fruit and Vegetable Imports Outpace Exports,” Amber Waves, USDA, June 2005.Expressed as an average; actual tariffs may vary substantially across products and countries.5Ibid.6For example, products from some countries are eligible for preferential treatment under the Generalized System ofPreferences (see CRS Report RS22541, Generalized System of Preferences: Agricultural Imports). Products from someSouth American countries may benefit under the Andean Trade Preference Act.Congressional Research Service5
The U.S. Trade Situation for Fruit and Vegetable ProductsMany of the countries that have entered into trade preference programs with the United Statessupply products such as bananas and other tropical fruits that are grown in limited supplies in theUnited States. Many also provide fruits and vegetables counter-seasonally (off-season) toproduction in the United States. However, there is concern that an increasing share of imports arenow directly competing with domestically produced commodities throughout the year.USDA reports significant gains in intraregional trade between the United States, Canada, andMexico following the adoption of the North American Free Trade Agreement (NAFTA) in 1994.7Cooperation on phytosanitary issues and tariff elimination has heightened integration in NorthAmerica’s fruit and vegetable markets, resulting in both higher U.S. imports (and exports) offruits and vegetables. In particular, U.S. imports of tomatoes and fresh peppers from Mexico haverisen sharply.8 Imports from Canada have also increased but from a smaller base. Mexico andCanada now account for about one-half of all U.S. produce imports (Table 2). Rising consumerdemand has also influenced imports, given the year-round availability of a wider diversity ofconsumer choices, including new products, varieties, and colors and hothouse-grown produce.Since the U.S.-Chile FTA entered into force in 2004, Chilean imports—particularly imports offresh fruits and fruit juices—have continued to increase (Table 2). Most imports from Chile,however, continue to be supplied during the U.S. off-season. Imports under the U.S.-DominicanRepublic-Central American (DR-CAFTA) FTA,9 which entered into force in July 2006, wereexpected to be limited since many of these countries already had duty-free access to the UnitedStates under previous trading arrangements, such as the Generalized System of Preferences (GSP)and the Caribbean Basin Economic Recovery Act. Imports under DR-CAFTA have increased,particularly imports of tropical fruits and vegetables but also other fresh fruits.Previously, some U.S. produce growers had complained that some FTAs were allowing forgreater access to the United States without creating equal U.S. access to foreign markets, and theyfurther claimed that with each FTA the U.S. produce sectors had been negatively impactedthrough higher imports, lower prices, and a growing trade deficit.10 More recent statements byindustry representatives, however, acknowledge the need to continue “leveling the playing field”of specialty crop exports and imports while also recognizing gains from opening up markets forU.S. exports in global markets in China and elsewhere.11 Industry representatives as well as theAgricultural Technical Advisory Committee (ATAC) for Trade in Fruits and Vegetables, a USTRadvisory group, have stated their general support for the Trans-Pacific Partnership (TPP)Agreement,12 an FTA involving the United States and several other countries.13 An investigationby the U.S. International Trade Commission (USITC) reports that TPP would benefit the U.S.produce sectors through reduced phytosanitary barriers to trade and improved market access.147USDA, NAFTA at 20: North America’s Free-Trade Area and Its Impact on Agriculture, WRS-15-01, February 2015.Because of concerns about the effects of NAFTA on U.S. fresh tomato and pepper markets, the NAFTAImplementation Act (P.L. 103-182, §316) required annual monitoring of these two markets until January 1, 2009.9Countries include the Dominican Republic, Costa Rica, El Salvador, Guatemala, Honduras, and Nicaragua.10See, for example, T. Linden, “Ag Trade Surplus Wiped Out by Imports,” Western Grower & Shipper, February2005; and T. Linden, “Ag Export Surplus Continues to Shrink,” Western Grower & Shipper, December 2004.11Testimony by Robert Guenther, United Fresh Produce Association (UFPA) for the U.S. House of RepresentativesCommittee on Agriculture on “The Importance of Trade to U.S Agriculture,” March 18, 2015.12ATAC report for Trade in Fruits and Vegetables regarding the TPP Agreement, December 3, 2015; UFPA, “UnitedFresh Welcomes Passage of Trade Promotion Authority,” June 24, 2015; and Western Growers Association, “PressStatement: Western Growers Reiterates Support for Trans-Pacific Partnership Agreement,” May 19, 2016.13Australia, Brunei, Canada, Chile, Japan, Malaysia, Mexico, New Zealand, Peru, Singapore, and Vietnam.14USITC, Trans-Pacific Partnership Agreement: Likely Impact on the U.S. Economy and on Specific Industry,(continued.)8Congressional Research Service6
The U.S. Trade Situation for Fruit and Vegetable ProductsGlobal CompetitionAmong the leading U.S. fruit and vegetable import suppliers, China and most European countriesdo not benefit from preferential import treatment under current U.S. trade laws. However, fruitand vegetable imports from these countries are growing, partly because of their lower costs ofproducing, packing, and/or processing fruits and vegetables, compared to producers in the UnitedStates. Among many developing countries, lower costs are generally associated with loweroverall production and input costs, particularly for labor. Among EU countries, lower costslargely are a function of farm subsidies and payments along with other forms of governmentsupport for fruit and vegetable production, as part of the Common Agricultural Policy.For example, in China, average farm-level costs are low because the majority of farm productionis labor-intensive on small-scale, low-technology operations, using little or no mechanized inputs.Generally, labor is abundant and costs are low. Marketing costs for produce also are low, givenonly basic packing and packaging techniques, and lack of uniform product sizes and gradingstandards. At modernized facilities, certain capital and production technology costs are higher, butper-unit labor costs and overall input costs still remain much lower than in the United States.Given such differences, available cost data show that average per-unit production costs in Chinafor tomatoes, peppers, and citrus are roughly one-tenth those in the United States.15 Chinaremains the world’s largest producer and exporter of many types of fruits and fruit juices.By comparison, U.S. production costs are relatively high and generally increasing due to risingcosts for energy, transportation, labor, and other farm inputs. In the United States, farm laboraccounts for 42% of the variable production expenses for U.S. fruit and vegetable farms (althoughlabor’s share may vary depending on the commodity).16 Most fruits and vegetables are fragile andperishable and must be hand-picked, which limits opportunities for mechanized harvesting.17 Inaddition, historically, many U.S. farmworkers have been largely unauthorized, and increasedenforcement of immigration laws is resulting in labor shortages in some production areas,especially for harvesting tree fruits and specialty row crops. As a result, immigrant guest workerprograms have been a growing priority for U.S. produce growers.18 Higher production costs in theUnited States might also be due to a generally more stringent regulatory regime—e.g., workers’compensation requirements; air, water quality, and land use regulations; and pesticide applicationand registration. Studies have shown that such regulations can be costly to producers, particularlyin California, where a large share of the nation’s fruits and vegetables are grown.19(.continued)Publication 4607, Investigation. TPA-105-001, May 2016.15S. Rozelle et al., “Rising Demand, Trade Prospects, and the Rise of China’s Horticultural Industry,” 2007.16P. Martin and L. Calvin, “Labor Trajectories in California’s Produce Industry,” Agricultural and ResourceEconomics Update, University of California, vol. 14, no. 4 (March/April 2011). See also University of CaliforniaDavis, “Labor: U.S. Fruits and Vegetables,” Rural Migration News, vol. 17, no. 1, January 2011. Sample cost data forindividual crops grown in California are available at University of California-Davis, “Current Cost and ReturnsStudies,” http://coststudies.ucdavis.edu/current/.17W.E. Huffman, “The Status of Labor-Saving Mechanization in U.S. Fruit and Vegetable Harvesting,” CHOICES, 2ndQuarter 2012.18See, for example, letter from several Members of Congress regarding concerns about the H-2A agricultural workerprogram to officials at the U.S. Department of labor and the U.S. Citizenship and Immigration Services, June 10, 2016.19See, for example, previous California Polytechnic State University studies by S. Hurley et al., “Analysis of theRegulatory Effects on California Specialty Crops: An Examination of Various Issues Impacting Selected ForestProducts, Tree Fruit, Nut, and Vegetable Crop Industries,” January 2006; and S. Hurley, “Comparison BetweenCalifornia and Its Domestic and International Competitors with Respect to Key Labor Issues,” June 2004.Congressional Research Service7
The U.S. Trade Situation for Fruit and Vegetable ProductsFarm costs in the EU also are relatively high. However, fruit and vegetable producers in mostEuropean countries directly benefit from support programs that effectively offset their productioncosts and allow them to become competitive on world markets. The EU’s fruit and vegetablesubsidies vary by commodity, but often include direct farm payments, compensation for furtherprocessing, co-financing of operational funds for producer organizations, export subsidies,promotional aid, and other types of support and financial aid.20 Commodities that benefit undersuch programs include tomatoes, cauliflowers, stonefruit, olives, grapes, citrus, eggplants, applesand pears, among others. The total value of support notified to the World Trade Organization(WTO) for EU’s fruit and vegetable sector (including olive oil) is estimated at about 39 million( 30.8 million) for the 2012/2013 marketing year.21 The EU wine sectors received another 809million ( 646.8 million) in support. This support includes direct product-specific support, whichis considered to be “production distorting” by the WTO and is subject to reduction commitments.Comparable expenditures for the U.S. fruit and vegetable sectors were negligible. Othernonproduct-specific support and other indirect support is not included in these estimates.In the United States, fruit and vegetable producers do not directly benefit from traditional federalfarm support programs that might help offset their production costs. However, they may benefitindirectly from certain government research and farm assistance programs that are generally notconsidered “production distorting.”22 The European Commission has been implementing reformsto the current subsidy program for fruits and vegetables that could increase the sector’s marketorientation.23 Even with reforms, the EU’s program would continue to provide governmentfunded income support and risk protection not similarly afforded to U.S. producers.Most developing countries do not directly support their fruit and vegetable production. However,some have gove
fruit. For fresh vegetables, export gains were greatest for lettuce, spinach, tomatoes, potatoes, and legumes/beans. For processed products, export gains were for processed potato products, certain preserved vegetables, fruit juices and juice mixtures, and other processed