Transcription
KickStarter Series15 Minutes Introduction to ELK15 Minutes Introduction to ELK(Elastic Search,LogStash,Kibana)KickStarter SeriesKarun Subramanianwww.karunsubramanian.com Karun Subramanian1
KickStarter Series15 Minutes Introduction to ELKContentsWhat is ELK and why is all the hoopla? .3The plumbing – How does it work? .4How can I get started, really? .5Installation process.5The Search .7Most important Plugins .8Marvel.9Head.9Shield.10Where to go next? .10 Karun Subramanian2
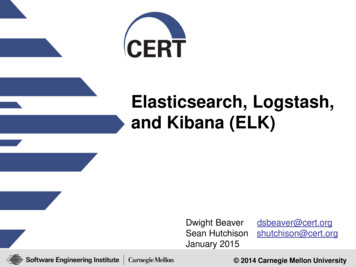
KickStarter Series15 Minutes Introduction to ELKWhat is ELK and why is all the hoopla?Elastic Search is a robust search and analytics tool that stores data in a document oriented datastore. It is open source, meaning you can download, use and modify the program free of charge. Themost popular usage of ElasticSearch today is Log Management. Similar products in the market todayare Splunk and Solr.Elastic Search is built on top of high performance open source search engine Apache Lucene. Thedocumented oriented storage differs sharply from traditional table oriented RDBMS (Such as Oracle,MS SQL Server). With document oriented data storage, data is stored as structured JSON (JavaScriptObject Notation) documents. Every field is indexed by default. This is why the search speed isincredible.The architecture of Elastic Search favors distribution, meaning you can scale your Elastic Searchinfrastructure massively and seamlessly. The infrastructure is resilient for failures – it automaticallyrelocates and balances resources. Note that you can install and maintain an Elastic Searchinfrastructure in your premise, or you can simply purchase a SaaS based solution where theinfrastructure is hosted and managed by Elastic Search for you.The user interface to perform search and analytics is Kibana, an open source data visualizationplatform. With its intuitive, clean and responsive interface Kibana makes searching for data a joy.Logstash, another open source tool does the heavy lifting of consuming the logs from various systemsand sends them to Elastic Search. Together, Elastic Search, LogStash and Kibana form the commonlyknown System ELK.Finally a powerful RESTFul API armors developers to do every action imaginable using the data set.Client libraries are also available for many languages.A sample screen from Kibana: Karun Subramanian3
KickStarter Series15 Minutes Introduction to ELKImage Source: www.elastic.coThe plumbing – How does it work?Logstash is the workhorse that collects the log files from Application Servers, parses them, formatsthem and sends them to Elastic Search. Elastic Search stores and indexes the data, which is presentedby Kibana. The end users access Kibana Web Interface to view the data.Let us explore the flow a bit more:1. Application Servers to LogStashTypically, a Logstash Forwarder component is installed on the Application Servers. This piece ofsoftware is responsible for collecting the logs based on the configuration that you setup via aconfiguration file. Logstash Forwarder is an instance of Logstash whose input is Application Log filesand output is Logstash Indexer (The 2nd block from the right in the above diagram). Karun Subramanian4
KickStarter Series15 Minutes Introduction to ELKOptionally you can introduce a Message queueing component between the Application Servers andthe LogStash Indexer. Rabbit MQ is a popular choice in ELK implementations.2. Logstash to Elastic Search ClusterLogstash (indexer) parses and formats the log (based on the log file content and the configurationof LogStash) and feeds Elastic Search Cluster. The protocol used is a Native Elastic SearchTransport. Elastic Search consumes data from Logstash and creates Indexes (for log files, typicallya date-based index is created by Elastic Search).3. KibanaKibana is a data visualization platform that is the presentation layer in the ELK stack. It consumesdata from Elastic Search Indexes. A user accesses Kibana interface via a web browser.How can I get started, really?Getting started with Elastic Search is straight forward, but may require some time and effort. The basicsoftware components are completely free and ready for you to download.You will need to download the following three components from ashKibanaInstallation processElasticsearch:Installing Elasticsearch is simply downloading the zip/tar file into a directory of your choice andunzipping it. If you are planning on a cluster that spans more than one physical node, you will have toinstall the software on each physical node.Almost everything in elastic search is preconfigured. For POC (Proof of concept) purposes, you shouldhave no trouble simply starting up Elastic Search without any custom configuration. Use the followingcommand to startup elastic search eshome /bin/elasticsarch(On windows platform, elasticsearch.bat)The primary configuration file for elastic search is elasticsearch.yml under conf directory. Karun Subramanian5
KickStarter SeriesThe log file elastic search clustername.log is found under logs directory.15 Minutes Introduction to ELKBy default Elastic Search will listen on port 9200 for http requests and port 9300 for requests fromElastic Search nodes (Log stash will be considered a node in elastic search).A quick way to test your installation is to access Elasticsearch using curlcurl –XGET http:// localhost :9200/You should see a JSON output with the cluster name and few other metrics.Logstash:Installing Logstash is simply downloading the zip/tar file into a directory of your choice and unzippingit. Unlike ElasticSearch, you will have to minimally configure the logstash configuration file beforestarting up logstash.The logstash configuration file (you must create one ) must have the following entries:a. Input block (required)b. Output block (required)c. Filter block (optional)For example:input {file {path "/path/to/mylog"start position beginning}}An output block might look like this for an elastic search clusteroutput {elasticsearch {}stdout {}}You can start logstash using the following command Karun Subramanian6
KickStarter Seriesbin/logstash agent –f logstash config file 15 Minutes Introduction to ELKOnce you start logstash, you can check elastic search log file to make sure the logstash instance gestadded as a Node.Kibana:Download kibana binaries from https://www.elastic.co/downloads/kibana. Unzip the zip/tar file andupdate config/kibana.yml to point to your elastic search instance. For example,# The Elasticsearch instance to use for all your queries.elasticsearch url: http://localhost:9200Then simply start kibana with the command bin/kibana (bin\kibana.bat in Windows). Kibana is nowlistening on 5601. You can access the Kibana interface via http:// hostname :5601.Note: In windows environment, you can also install Kiaban as Windows Service by using NSSM.The SearchThere are few ways you can interact with Elastic search.CURL:The simplest way is to use curl command. The format of the curl command is:curl -X VERB ' PROTOCOL :// HOST : PORT / PATH ? QUERY STRING ' -d ' BODY 'VERB: Can be one of GET, POST, PUT, HEAD, or DELETEHOST:PORT : Your Elastic Search Cluster. Default port is 9200PATH: This is the API endpoint. The API endpoints generally begin with the letterQUERY STRING: Optional query string. For example ?pretty will display output Json response in easilyreadable formatBODY: JSON body (if required).For example, if you want to know the number of nodes in your elastic search cluster, you would use:curl -XGET http://localhost:9200/ cat/nodesFor searching strings, you would use the API endpoint “ search”Java API:Elastic Search provides two built-in clients to use if you are a java shop. Karun Subramanian7
KickStarter Series15 Minutes Introduction to ELKA node client joins elastic search cluster as a non-data node and accesses the data in the clusterA transport client accesses Elastic search by sending requests to a remote elastic search cluster.Both node and transport client use port 9300 of Elastic search cluster with a native transport. Note thatthe Elastic Search cluster nodes talk among themselves using this port as well.SENSE:SENSE is a browser based tool that comes with the plugin MARVEL.Note: Elastic search uses plugin architecture, meaning there are tons and tons of plugin available foryou to simply download,install and start to use. Marvel is one such plugin that is extremely useful. It isused to monitor and troubleshoot the Elastic search cluster.With Sense dashboard, you can send curl commands to elastic search cluster and obtain the response.Note that sense uses a compact version of curl command (i.e it leaves out the host:port, etc)KIBANA:This is the obvious choice for querying elastic search. With the intuitive graphs and the powerful DSLquerying facility there is nothing you can’t find with Kibana. Kibana will be covered in detail in anotherarticle.Most important PluginsElastic Search is built with plugin architecture. This opens door for numerous plugins that are availablefor you to download and use. While some plugins are not free, lot of them are.Three important plugins are:1. Marvel – Used for monitoring Elastic Search2. Head – Used for managing Elastic Search indexes3. Shield – Security for Elastic SearchInstalling plugins is a snap with Elastic Search. For installing Marvel, use the following commandbin/plugin -i elasticsearch/marvel/latestTo install Headbin/plugin -i mobz/elasticsearch-head Karun Subramanian8
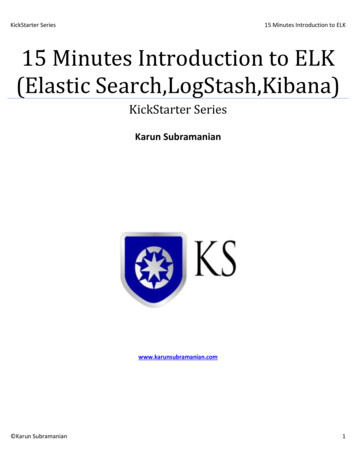
KickStarter SeriesTo install Shield: (Note: Shield is not a free plugin)15 Minutes Introduction to ELKbin/plugin -i licensebin/plugin -i shieldTo see the list of plugins installed in your systembin/plugin -lMarvel:You can monitor the health of the Elasticsearch cluster using Marvel. For example, you can find outhow much disk space is left in the volume where indexes are stored. You can also check the JVM heaputilization of Elasticsearch JVMImage Source: roduction.htmlHead:Most common use case of Head is to manage the indexes. You can view and delete indexes as youwish. Karun Subramanian9
KickStarter Series15 Minutes Introduction to ELKImage source: ield protects the data stored by Elastic Search. A basic username/password security is deployed. Butif/when needed, advanced security configurations such as encryption, ip filtering, RBAC (Role basedaccess control) and auditing can be deployed as well.Where to go next?Undoubtedly, the most useful resource for learning Elastic Search is https://www.elastic.co/learn.There you will find tons of tutorials, videos, articles and even the full content of the book ‘ElasticSearch – the definitive guide’.There are also meet-up groups available for you to join. For a local meeting, visit meetup.comElastic Search organizes frequent seminars and webminars. And then there is the Elastic ON yearlyconference which hosts numerous training sessions. For training schedule, you can visithttp://training.elastic.co/But by far the most effective way to learn Elastic Search is to simply download, install and startcollecting logs. It IS easy. Give it a shot and you will be glad you did. Karun Subramanian10
KickStarter Series15 Minutes Introduction to ELKHappy Monitoring !!! Karun Subramanian11
Feb 15, 2017 · Elasticsearch Logstash Kibana Installation process Elasticsearch: Installing Elasticsearch is simply downloading the zip/tar file into a directory of your choice and unzipping it. If you are planning on a cluster that spans more than one physical node, you