Transcription
Visitor Services ProjectReport 14Shenandoah National ParkVolume 1 of 2Cooperative Park Studies UnitUniversity of Idaho
Visitor Services ProjectReport 14Shenandoah National ParkVolume 1 of 2Gary E. MachlisDana E. DolsenAugust 1988Dr. Machlis is Sociology Project Leader, Cooperative Park Studies Unit, NationalPark Service, University of Idaho. Mr. Dolsen is Research Associate, CooperativePark Studies Unit, National Park Service, University of Idaho. We thank MichaelScialfa, Sara Baldwin and the staff at Shenandoah National Park for their assistancewith this study.
Executive Summary This report describes the results of a visitor study at Shenandoah National Parkduring the weeks of July 26 -August 1 and October 4-10, 1987.Questionnaires were given to 2960 visitor groups and 1017 were returned, a34% response rate. The survey provides a profile of the people who visited Shenandoah. Theirgeneral comments about the park are found in Volume 2 of the report; thisvolume has a summary of their comments. Visitors were most likely to be in family groups of two to four people.Amajority were visiting Shenandoah for at least their second time. The majority ofvisitors came from Virginia, Maryland and Pennsylvania. Most visitors stayed at least one day. Stopping at overlooks, using gasstations/stores/gift shops, hiking for less than 2 hours and visiting the BigMeadows Visitor Center were the most common activities. The sites that received the greatest use (in order) were Big Meadows, Skylandand the Dickey Ridge Visitor Center. Community and state origins from whichvisitors commonly started from on their arrival day were Front Royal and Virginiarespectively. The exits used most by departing visitors were Front Royal andThornton Gap. Information services most used by visitors included brochures and booklets andthe wayside/overlook exhibits. Services rated most useful included thebrochures and booklets and the ranger-led programs. The sources of information about the park that visitors commonly consulted priorto their visit were maps or brochures and their own experience from previousvisits. Few visitors had difficulty locating the park. Visitors to Big Meadows commonly participated in visiting the Visitor Centerand in using the gas stations/stores/gift.shops. Higher proportions of Fall visitor groups were in a group of 2 people, older than55 and repeat visitors. There were higher proportions of Summer visitorgroups who used gas stations/stores/gift shops, went on ranger-led walks/talksand attended evening slide programs. Higher proportions of Summer visitorgroups left the park via Rockfish Gap and used bulletin boards and the rangerled programs. Higher proportions of Fall visitor groups participated in most ofthe activities at Big Meadows. Visitors made many general comments about their visit to the park.
TABLE OF CONTENTSVOLUME 1: Visitor Mapping ReportINTRODUCTION1METHODSRESULTS: SUMMERA. Visitors contactedB. Visitor characteristicsC. Visitor use of timeD. Visitor activitiesE. Visitor locationsF. Special question 1: Visitor origin onarrival dayG. Special question 2: Park exit used bydeparting visitorsH. Special question 3: Park information andinterpretive servicesI. Special question 4: Information sourcesconsulted prior to visitJ. Special question 5: Difficulty locatingShenandoahK. Special question 6: Activity participationat Big Meadows3666121415RESULTS: FALLA. Visitors contactedB. Visitor characteristicsC. Visitor use of timeD. Visitor activitiesE. Visitor locationsF. Special question 1: Visitor origin onarrival day34343440424322242531323350
TABLE OF CONTENTS (continued)G. Special question 2: Park exit used bydeparting visitorsH. Special question 3: Park information andinterpretive servicesI. Special question 4: Information sourcesconsulted prior to visitJ. Special question 5: Difficulty locatingShenandoahK. Special question 6: Activity participationat Big Meadows5253596061SIGNIFICANT SEASONAL VARIATIONS62VISITOR COMMENT SUMMARIES66Introduction66Summer67Fall70MENU FOR FURTHER ANALYSIS72APPENDICES75Appendix A: Questionnaire75VOLUME 2: Visitor CommentsINTRODUCTION1COMMENT SUMMARIES2Summer2Fall5
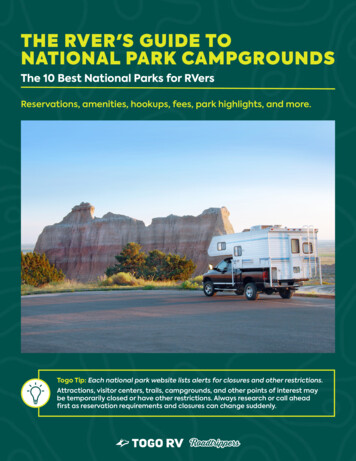
1INTRODUCTIONThis report describes the results of a visitor mapping study undertaken atShenandoah National Park (referred to as 'Shenandoah'). The study was conductedduring the weeks of July 26- August 1 and October 4-10, 1987 by the CooperativePark Studies Unit at the University of Idaho, as a part of its Visitor Services Project.A list of Visitor Services Project publications is included on the inside back cover ofthis report.After this Introduction, the Methods are presented, along with limitations to thestudies. The Results for each season follow, and then significant seasonal variationsare discussed. Summaries of visitor comments are next, after which a Menu forFurther Analysis is provided to help managers in requesting additional analyses.Finally, Appendix A contains the questionnaire used. Volume 2 of this reportcontains comments made by visitors who returned the questionnaires.Many of the graphs in this report are like the example on the following page.The large numbers refer to explanations below the graph.
2Introduction (continued)SAMPLE ONLY2N 447 respondents due to missing data1 person2 people3 people34 people5 peopleGroup size6 people7 people8 people9 people10 people4%10%525%6%1%1%1%2%0132%18%204406080100 120Number of respondents140160Figure 1: Visitor group sizes1: The figure title provides a general description of the information contained in thegraph and indicates which season the data represent.2: A note above gives the 'N', or number of cases in the sample, and a specificdescription of the information in the chart.3: The vertical information describes categories.4: The horizontal information shows the number of items that fall into each category.Proportions are shown in some graphs.5: In most graphs, percentages are included to provide additional explanation.
3METHODSGeneral strategyQuestionnaires were distributed to a sample of randomly selected visitorsentering Shenandoah during the two study periods of July 26 -August 1 andOctober 4-10, 1987. Visitors completed the questionnaire during their trip and thenreturned it by mail. Returned questionnaires were analyzed and this reportdeveloped.Questionnaire designThe questionnaire asked visitors to record where they went, what they did,where they began their trip on their arrival day and which exit they used whendeparting (see Appendix A for a copy of the questionnaire). The questionnairefollowed the standard format used in previous Visitor Services Project studies.Visitors also responded about the sources of park information consulted prior to theirvisit, whether it was difficult to locate the park, what activities they participated in atBig Meadows and how they rated the park's information and interpretive services.Space was provided for respondents' comments.SamplingVisitors were randomly contacted at the four entrance stations to Shenandoahduring each station's operating hours. Sampling consisted of approaching vehiclesbased upon different preselected intervals for each entrance. The sample size wasbased upon 1986 visitor counts, the park's operating hours and staff availability. Atotal of 2960 questionnaires were distributed, 1805 during the Summer and 1155during the Fall.
4Questionnaire administrationEach day of the study period interviewers would approach the occupants ofeach selected vehicle. Visitor groups were greeted, briefly introduced to thepurpose of the study, and asked to participate. If they consented, further instructionswere given. One adult member of the group was asked to complete thequestionnnaire.Data analysisA cut-off date was established for incoming questionnaires approximately tenweeks after distribution. Questionnaires received within this period were coded andentered into a computer. Frequency distributions and cross-tabulations werecalculated using a standard statistical software package. Respondents' commentswere summarized and are included in the Results, with copies of the commentsprovided in Volume 2 of this report.Sample size, missing data and reporting errorsMost of the information was collected on visitor groups, and some onindividual group members. Therefore, the 'N', or number in the sample, varies fromfigure to figure. For example, Figure 1.1 shows information from 619 respondentsrepresenting visitor groups, while Figure 1.3 shows information on 1739 individuals.Each figure contains a note above the graph that specifies which information itillustrates.
5Sample size, missing data and reporting errors (continued)Occasionally, a respondent may not have answered all of the questions in thequestionnaire, or may have answered some incorrectly. Unanswered questionscreate missing data and cause the number in the sample to vary from figure to figure.For example, although 619 Summer questionnaires were returned, Figure 1.5 onlyshows data for 608 respondents.Questions answered incorrectly due to carelessness, misunderstandingdirections, and so forth, turn up in the data as reporting errors. These create smalldata inconsistencies. For example, it is possible that some of the visitors' activitiesoccurred outside of the park - they may not have understood to report only thoseactivities done within the park.LimitationsLike all surveys, this study has limitations which should be taken into accountwhen interpreting the results.1. All visitors were asked to record sites visited and activities, however, it isnot possible to know whether their responses reflect actual behavior. Thisdisadvantage is applicable to all such studies and is reduced by having visitors fillout the questionnaire as they visit the park.2. The data reflect the use patterns of visitors during the designated studyperiods. The results do not necessarily apply to visitors using the park duringdifferent times of the year.3. Data are not collected on non-respondents. Thus, it is not known if visitorswho returned their questionnaires differ from those who did not.
6RESULTS: SUMMERA. Visitors contactedOne thousand, eight hundred and nine visitor groups were contacted duringthe summer study period. One thousand, eight hundred and five visitor groupsagreed to participate. Thus, the acceptance rate was 99.8%. Six hundred andnineteen visitor groups completed and returned their questionnaires, a 34%response rate. The 99.8% acceptance rate is higher than the average acceptancerate of previous visitor mapping studies (97%). The summer response rate atShenandoah (34%) was lower than the average response rate for previous visitormapping studies (40%).B. Visitor characteristicsFigure 1.1 shows Summer visitor group sizes, which ranged from one to 87people. The most common group size was two people. Nearly three-quarters ofthe visitors came in family groups, as shown in Figure 1.2.Figure 1.3 shows that there was a wide range of age groups represented;the most common were children and middle-aged adults. For 44% of the visitors,this was their first visit to Shenandoah.Map 1.1 shows that a majority of U.S. visitors originated from the statesaround Shenandoah (i.e. Maryland, Virginia and Pennsylvania-52%). Three percentof all visitors were from foreign countries (see Map 1.2 and Table 1.1).
7B. Visitor characteristics (continued)N 619 visitor groups;percentages do not equal 100 due to rounding.1 person4%2 people45%3 peopleGroup size16%4 people20%5 people7%6-10 people5%11 people2%050100150200Number of respondents250Figure 1.1: Summer visitor group sizesN 619 visitor groups.Alone6%FamilyGroup type71%Friends14%Family and friends8%Tour group 0%Other1%0100200300400Number of respondents500Figure 1.2: Summer visitor group types300
8B. Visitor characteristics (continued)N 1739 individuals;percentages do not equal 100 due to rounding.66 61-6556-6051-5546-5041-45Age group 2%12%9%6%4%8%14%050100150Number of individuals200250Figure 1.3: Ages of Summer visitorsN 1559 individuals.44%First visit2-4 visits32%Times visited5-9 visits8%10 visits16%0100200 300400 500Number of individuals600700Figure 1.4: Number of visits made by Summer visitors
11B. Visitor characteristics (continued)Table 1.1: Proportion of Summer visitors from foreigncountriesN 45 foreign visitors.CountryNumber of% of foreignindividualsvisitorsNorth eden44455Middle East/AfricaIsraelMorocco1147%49%4%
12C. Visitor use of timeFigure 1.5 shows that the most common hour of entry into the park bySummer visitor groups (14%) was from 11:00 a.m.-12:00 noon. Figure 1.6illustrates that most Summer visitor groups (64%) stayed at Shenandoah for oneday. Nineteen percent of the visitors stayed for two days.N 558 visitor groups;percentages do not equal 100 due to rounding.2%2%Before oon12:00-1:00pEntry :00p6:00-7:00pAfter 7:00p6%9%14%10%11%11%9%8%8%6%6%01020 30 40 50 60Number of respondents7080Figure 1.5: Summer visitors entering Shenandoah eachhour of the day
13C. Visitor use of time (continued)N 608 visitor groups.64%1219%Number of days39%4 8%0100200300Number of respondents400Figure 1.6: Number of days Summer visitors stayed
14D. Visitor activitiesFigure 1.7 shows the proportion of Summer visitor groups who engaged ineach activity during their visit. The activities pursued most by visitor groups includedstopping at the overlooks (85%), using the gas stations/restaurants/stores (55%),visiting the Big Meadows Visitor Center (37%) and going on a hike for less than 2hours (37%). Participation was less common for activities such as backcountrycamping, fishing and bicycling.Visit Dickey Ridge V.C.Visit Big Meadows V.C.Ranger-led walk/talkEvening slide programsStop at overlooksHike under 2 hrs.Hike over 2 hrs.ActivityFishPicnicBicycleBackcountry campingCampground campingOvernight at lodge/cabinsUse gas stn./restnt/storeOtherN 619 visitor groups;percentages do not equal 100 because visitorscould report more than one %0100 200 300 400 500Number of respondents600Figure 1.7: Proportion of Summer visitors participatingin each activity
15E. Visitor locationsMap 1.3 shows the proportion of Summer visitor groups that stopped ateach site. The largest proportion of visitor groups stopped at Big Meadows (48%),Skyland (38%) and the Dickey Ridge Visitor Center (34%).Map 1.4 shows the proportion of Summer visitor groups who visited eachsite first. Thirty-six percent of park visitor groups chose to make the Dickey RidgeVisitor Center their first stop, while 19% chose Big Meadows and 16% chose LoftMountainThe order in which visitor groups stopped at sites during their visit is shown inFigures 1.8 through 1.14. Figure 1.8 shows visitor groups to MathewsArm/Elkwallow commonly made it their second stop. Figure 1.9 shows visitorgroups to Thornton Gap/Panorama commonly made it one of their first three stops.Figure 1.10 shows visitor groups to Lewis Mountain tended to make it one of theearlier stops of their visit. Figure 1.11 shows visitor groups to Loft Mountaincommonly made it the first stop of their visit. As shown in Figure 1.12, BigMeadows' visitor groups commonly made it their first or second stop. Visitor groupsto Skyland tended to go there throughout their visit (Figure 1.13). Figure 1.14shows visitor groups to the Dickey Ridge Visitor Center commonly chose to make itthe first stop of their visit.
18E. Visitor locations (continued)N 149 visitor groups who stopped at this site;percentages do not equal 100 due to rounding.First Stop18%Second47%ThirdStop order4%Fourth1%Fifth3%Sixth1%No order given27%01020304050Number of respondents6070Figure 1.8: Order in which Summer visitors stopped atMathews Arm / ElkwallowN 159 visitor groups who stopped at this site.20%First stopSecond19%22%ThirdStop orderFourth7%Fifth6%No order given26%010203040Number of respondents50Figure 1.9: Order in which Summer visitors stopped atThornton Gap / Panorama
19E. Visitor locations (continued)N 97 visitor groups who stopped at this site.First stopStop order13%Second17%Third17%Fourth6%Fifth9%Sixth12%No order given26%05101520Number of respondents2530Figure 1.10: Order in which Summer visitors stopped atLewis MountainN 151 visitor groups who stopped at this site;percentages do not equal 100 due to rounding.First stop39%Second7%ThirdStop order5%8%FourthFifth6%Sixth6%Seventh6%24%No order given010203040Number of respondents5060Figure 1.11: Order in which Summer visitors stoppedat Loft Mountain
20E. Visitor locations (continued)N 298 visitor groups who stopped at this site;percentages do not equal 100 due to rounding.First Stop23%Second24%ThirdStop order15%Fourth8%6%FifthSixth 1%No order given23%0102030405060Number of respondents7080Figure 1.12: Order in which Summer visitors stoppedat Big MeadowsN 233 visitor groups who stopped at this site;percentages do not equal 100 due to rounding.First stop16%Second28%Third18%Stop orderFourth14%Fifth1%24%No order given01020304050Number of respondents6070Figure 1.13: Order in which Summer visitors stoppedat Skyland
22F. Special question 1: Visitor origin on arrival dayThe survey asked Summer visitor groups where they started their trip on theday they arrived in the park. They were asked to specify both the nearest town andthe state from which they began on that day. Table 1.2 shows that Virginia was themost common state of origin on their arrival day (71%) and Table 1.3 shows thatFront Royal was the most common town of origin (18%).Table 1.2: State of visitor origin on arrival dayN 580 visitor groups.StateNumber of respondents Percent (%)VirginiaMarylandPennsylvaniaDistrict of ColumbiaWest VirginiaNew JerseyOhioNorth CarolinaNew YorkTennesseeOthers (1-2 per state)4134235231711109657717643222111
23F. Special question 1: (continued)Table 1.3: Place of visitor origin on arrival dayN 590 visitor groups;percentages do not equal 100 due to rounding.Community Number of respondents Percent (%)Front Royal106Charlottesville39Waynesboro27Washington, e7Gettysburg6Others ( 6 respondents/town)26418754433222211144
25H. Special question 3: Information or interpretive servicesThe survey asked Summer visitor groups if they used any of the informationor interpretation services and how useful each service was to them. A five pointscale was provided: 1 extremely useful, 2 very useful, 3 moderately useful, 4 somewhat useful and 5 not useful. Figure 1.16 illustrates the proportion of visitorgroups that used each service. A majority of visitor groups used the brochures andbooklets (60%) and the wayside/overlook exhibits (55%); the Visitor Centerexhibits (43%) were also commonly used. The least used service was the rangerled programs (14%).Table 1.4 shows how visitor groups rated the usefulness of each service.Services that received the highest average scores were the brochures and booklets,and the ranger-led programs. Services with the lowest scores were Visitor Centerfilms and bulletin boards.Figures 1.17 through 1.24 show the visitors' ratings of each service'susefulness.
32J. Special question 5: Difficulty locating ShenandoahThe survey asked Summer visitor groups if it was difficult to locateShenandoah. Two percent said that it was difficult to find the park. These visitorssaid that there was a lack of signs, signs were misleading as well as the maps andsigns being of poor quality. Some of the suggestions given for improving the parklocation process included additional signage, better maps and signs and betterplacement of signs.
33K. Special question 6: Activity participation at Big MeadowsSummer visitors were asked if they stopped at Big Meadows and in whichactivities they participated while there. Fifty-three percent of visitor groups stoppedat this location. Figure 1.26 shows the proportionate amount of visitor participation ineach activity. The two most popular activities included visiting the Visitor Center(36%) and using gas stations/stores/gift shops (32%).N 594 visitor groups;percentages do not equal 100 because visitorscould report more than one activity.Visited Visitor Center36%Dined at lodge19%Gas stn./store/gift shopActivitiesPicnic32%8%Meadow walkLodge stayCampground stayDrk. Hollow Falls hike0%18%6%9%15%10%20%30%Proportion of respondents40%Figure 1.26: Proportion of Summer visitors participating ineach activity at Big Meadows
34RESULTS: FALLA. Visitors contactedOne thousand one hundred and sixty-five visitor groups were contactedduring the fall study period. One thousand one hundred and fifty-five visitor groupsagreed to participate. Thus, the acceptance rate was 99%. Three hundred andninty-eight visitor groups completed and returned their questionnaires, a 34%response rate. The 99% acceptance rate is higher than the average acceptance rateof previous visitor mapping studies (97%). The fall response rate at Shenandoah(34%) was lower than the average response rate for previous visitor mappingstudies (40%).B. Visitor characteristicsFigure 2.1 shows Fall visitor group sizes, which ranged from one to 45people. The most common group size was two people (56%). Over three-fifths ofthe visitors came in family groups, as shown in Figure 2.2.Figure 2.3 shows that there was a wide range of age groups represented;the most common visitor age groups consisted of adults from 26-35 years old(22%) and those 56 years and older (24%). For 34% of the visitors, this was theirfirst visit to Shenandoah; 36% of the visitors had been to the park 2-4 times.Map 2.1 shows that the most common U.S. state origins of Shenandoahvisitors were Virginia and Maryland (51%). Two percent of all visitors were fromforeign countries (see Map 2.2 and Table 2.1).
35B. Visitor characteristics (continued)N 398 visitor groups;percentages do not equal 100 due to rounding.1 person5%2 people56%3 peopleGroup size13%4 people16%5 people3%6-10 people7%11 people2%050100150200Number of respondents250Figure 2.1: Fall visitor group sizesN 395 visitor groups;percentages do not equal 100 due to rounding.Alone8%FamilyGroup type62%Friends18%Family and friends9%Tour group 1%Other2%050100150200Number of respondents250Figure 2.2: Fall visitor group types
36B. Visitor characteristics (continued)N 1044 individuals.66 61-6556-6051-5546-5041-45Age group %11%11%9%3%4%9%020406080Number of individuals100120Figure 2.3: Ages of Fall visitorsN 935 individuals;percentages do not equal 100 due to rounding.34%First visit36%2-4 visitsTimes visited5-9 visits14%10 visits15%0100200300Number of individuals400Figure 2.4: Number of visits made by Fall visitors
39B. Visitor characteristics (continued)Table 2.1: Proportion of Fall visitors from foreigncountriesN 17 foreign visitors.CountryNumber of% of foreignindividualsvisitorsNorth %
40C. Visitor use of timeFigure 2.5 shows that Fall visitor groups commonly entered the park fromeither 10:00 a.m. to 12 noon (25%) or from 1:00-3:00 p.m. (27%). Figure 2.6illustrates that most Fall visitor groups (70%) stayed at Shenandoah for one day;17% stayed two days.N 352 visitor groups;percentages do not equal 100 due to rounding.2%Before oon12:00-1:00pEntry :00p6:00-7:00pAfter 7:00p3%7%12%13%10%13%14%9%5%4%3%4%0510 15 20 25 30 35 40 45 50Number of respondentsFigure 2.5: Fall visitors entering Shenandoah each hourof the day
41C. Visitor use of time (continued)N 388 visitor groups.170%217%Number of days8%34 5%050100150200Number of respondents250300Figure 2.6: Number of days Fall visitors stayed
42D. Visitor activitiesFigure 2.7 shows the proportion of Fall visitor groups who engaged in eachactivity during their visit. The activities pursued by the majority of visitor groupsincluded stopping at overlooks (89%), using a gas station/store/gift shop (45%),visiting the Big Meadows Visitor Center (33%), picnicking (32%) and hiking for lessthan 2 hours (32%). Participation was less common in activities such as fishing,bicycling, attending the evening slide program and participating in a ranger-ledwalk/talk.Visit Dickey Ridge V.C.Visit Big Meadows V.C.Ranger-led walk/talkEvening slide programsStop at overlooksHike under 2 hrs.Hike over 2 hrs.ActivityFishPicnicBicycleBackcountry campingCampground campingOvernight at lodge/cabinsUse gas stn./restnt./storeOtherN 398 visitor groups;percentages do not equal 100 because visitorscould report more than one activity.26%33%5%4%89%32%24%1%32%1%2%14%9%45%8%050 100 150 200 250 300 350 400Number of respondentsFigure 2.7: Proportion of Fall visitors participating ineach activity
43E. Visitor locationsMap 1.3 shows the proportion of Fall visitor groups that stopped at eachsite. The largest proportion of visitor groups stopped at Big Meadows (40%),Skyland (33%) and the Dickey Ridge Visitor Center (29%).Map 1.4 shows the proportion of Fall visitor groups who visited each sitefirst. Twenty-eight percent of park visitor groups chose to go to the Dickey RidgeVisitor Center first , while 19% chose to stop at either Big Meadows or LoftMountain first.The order in which Fall visitor groups stopped at sites during their visit isshown in Figures 2.8 through 2.14. Figure 2.8 shows visitor groups to MathewsArm/Elkwallow commonly stopped there early in their visit. Figure 2.9 shows thatvisitor groups to Thornton Gap/Panorama stopped there from the early to middlepart of their visit. Figure 2.10 shows visitor groups to Lewis Mountain stoppedthere throughout their visit. As shown in Figure 2.11, most of the Loft Mountainvisitor groups stopped there first. Figure 2.12 shows visitor groups to BigMeadows commonly stopped there earlier than later in their visit. Figure 2.13 showsvisitor groups to Skyland chose to stop there early to mid-visit. Figure 2.14 showsvisitor groups to the Dickey Ridge Visitor Center stopped there at the first of theirvisit.
46E. Visitor locations (continued)N 85 visitor groups who stopped at this site;percentages do not equal 100 due to rounding.First Stop29%Second39%ThirdStop order2%Fourth1%Fifth4%Sixth2%No order given22%0102030Number of respondents40Figure 2.8: Order in which Fall visitors stopped atMathews Arm / ElkwallowN 105 visitor groups who stopped at this site;percentages do not equal 100 due to rounding.First stop19%Second20%Third23%Stop orderFourth6%Fifth2%No order given31%0102030Number of respondents40Figure 2.9: Order in which Fall visitors stopped atThornton Gap / Panorama
47E. Visitor locations (continued)N 57 visitor groups who stopped at this site;percentages do not equal 100 due to rounding.16%First StopSecond19%16%ThirdStop orderFourth9%Fifth11%Sixth11%No order given19%02468Number of respondents1012Figure 2.10: Order in which Fall visitors stopped atLewis MountainN 78 visitor groups who stopped at this site.First stop54%Second3%6%ThirdStop orderFourth5%Fifth4%Sixth8%Seventh6%No order given14%010203040Number of respondents50Figure 2.11: Order in which Fall visitors stopped atLoft Mountain
48E. Visitor locations (continued)N 160 visitor groups who stopped at this site;percentages do not equal 100 due to rounding.First Stop27%Second26%ThirdStop order13%Fourth10%Fifth6%Sixth1%No order given18%010203040Number of respondents50Figure 2.12: Order in which Fall visitors stopped at BigMeadowsN 130 visitor groups who stopped at this site;percentages do not equal 100 due to rounding.First stop19%Second27%Third23%Stop orderFourth11%Fifth1%No order given20%0102030Number of respondents40Figure 2.13: Order in which Fall visitors stopped atSkyland
50F. Special question 1: Visitor origin on arrival dayThe survey asked Fall visitor groups where they started their trip on the daythey arrived in the park. They were asked to specify both the nearest town and thestate from which they began on that day. Table 2.2 shows that Virginia was themost common state of origin on their arrival day (73%) and Table 2.3 shows thatFront Royal was the most common town (16%).Table 2.2: State of visitor origin on arrival dayN 363 visitor groups;percentages do not equal 100 due to rounding.StateNumber of respondents Percent (%)VirginiaMarylandPennsylvaniaDistrict of ColumbiaWest VirginiaNorth CarolinaOthers (1-2 per state)27332201785873955212
51F. Special question 1 (continued)Table 2.3: Place of visitor origin on arrival dayN 384 visitor groups.Community Number of respondents Percent (%)Front ton, nia Beach5Staunton5Others ( 5 respondents/town)19116875332221150
53H. Special question 3: Information or interpretive servicesThe survey asked Fall visitor groups if they used any of the information orinterpretation services and how useful each service was to them. A five point scalewas provided: 1 extremely useful, 2 very useful, 3 moderately useful, 4 somewhat useful and 5 not useful. Figure 2.16 illustrates the proportion of visitorgroups that used each service. A majority of all visitor groups used the brochuresand booklets (62%) and the wayside/overlook exhibits (54%); the Visitor Centerexhibits (38%) were also commonly used. The least used service was the rangerled programs (6%).Table 2.4 shows how visitor groups rated the usefulness of each service.Services that received the highest average scores were the ranger-led programs,the self-guided trails and the brochures and bo
Shenandoah National Park (referred to as 'Shenandoah'). The study was conducted during the weeks of July 26- August 1 and October 4-10, 1987 by the Cooperative Park Studies Unit at the University of Idaho, as a part of its Visitor Services Project. A list of Visitor Services Project publications is included on the inside back cover of this report.