Transcription
Grade-Seven Chapterof theMathematics Frameworkfor California Public Schools:Kindergarten Through Grade TwelveAdopted by the California State Board of Education, November 2013Published by the California Department of EducationSacramento, 2015
8Grade Seven7As students enter grade seven, they have an under-6standing of variables and how to apply propertiesof operations to write and solve simple one-stepequations. They are fluent in all positive rational numberoperations. Students who are entering grade seven have been5introduced to ratio concepts and applications, concepts ofnegative rational numbers, absolute value, and all four quadrants of the coordinate plane. They have a solid foundation for4understanding area, surface area, and volume of geometricfigures and have been introduced to statistical variability anddistributions (adapted from Charles A. Dana Center 2012).3Critical Areas of InstructionIn grade seven, instructional time should focus on four2critical areas: (1) developing understanding of and applyingproportional relationships, including percentages; (2) developing understanding of operations with rational numbers andworking with expressions and linear equations; (3) solving1problems that involve scale drawings and informal geometricconstructions and working with two- and three-dimensionalshapes to solve problems involving area, surface area, andKvolume; and (4) drawing inferences about populations basedon samples (National Governors Association Center for BestPractices, Council of Chief State School Officers 2010n).Students also work toward fluently solving equations of theformCalifornia Mathematics Frameworkand.Grade Seven327
Standards for Mathematical ContentThe Standards for Mathematical Content emphasize key content, skills, and practices at eachgrade level and support three major principles: Focus—Instruction is focused on grade-level standards. Coherence—Instruction should be attentive to learning across grades and to linking majortopics within grades. Rigor—Instruction should develop conceptual understanding, procedural skill and fluency,and application.Grade-level examples of focus, coherence, and rigor are indicated throughout the chapter.The standards do not give equal emphasis to all content for a particular grade level. Clusterheadings can be viewed as the most effective way to communicate the focus and coherenceof the standards. Some clusters of standards require a greater instructional emphasis thanothers based on the depth of the ideas, the time needed to master those clusters, and theirimportance to future mathematics or the later demands of preparing for college and careers.Table 7-1 highlights the content emphases at the cluster level for the grade-seven standards.The bulk of instructional time should be given to “Major” clusters and the standards withinthem, which are indicated throughout the text by a triangle symbol ( ). However, standardsin the “Additional/Supporting” clusters should not be neglected; to do so would resultin gaps in students’ learning, including skills and understandings they may need in latergrades. Instruction should reinforce topics in major clusters by using topics in theadditional/supporting clusters and including problems and activities that support naturalconnections between clusters.Teachers and administrators alike should note that the standards are not topics to bechecked off after being covered in isolated units of instruction; rather, they provide contentto be developed throughout the school year through rich instructional experiencespresented in a coherent manner (adapted from Partnership for Assessment of Readiness forCollege and Careers [PARCC] 2012).
Table 7-1. Grade Seven Cluster-Level EmphasesRatios and Proportional Relationships7.RPMajor Clusters Analyze proportional relationships and use them to solve real-world and mathematical problems.(7.RP.1–3 )The Number System7.NSMajor Clusters Apply and extend previous understandings of operations with fractions to add, subtract, multiply,and divide rational numbers. (7.NS.1–3 )Expressions and Equations7.EEMajor Clusters Use properties of operations to generate equivalent expressions. (7.EE.1–2 )Solve real-life and mathematical problems using numerical and algebraic expressions and equations.(7.EE.3–4 )Geometry7.GAdditional/Supporting Clusters Draw, construct, and describe geometrical figures and describe the relationships between them.(7.G.1–3) Solve real-life and mathematical problems involving angle measure, area, surface area, and volume.(7.G.4–6)Statistics and Probability7.SPAdditional/Supporting Clusters Use random sampling to draw inferences about a population.1 (7.SP.1–2)Draw informal comparative inferences about two populations.2 (7.SP.3–4)Investigate chance processes and develop, use, and evaluate probability models. (7.SP.5–8)Explanations of Major and Additional/Supporting Cluster-Level EmphasesMajor Clusters ( ) — Areas of intensive focus where students need fluent understanding and application of the coreconcepts. These clusters require greater emphasis than others based on the depth of the ideas, the time needed tomaster them, and their importance to future mathematics or the demands of college and career readiness.Additional Clusters — Expose students to other subjects; may not connect tightly or explicitly to the major work of thegrade.Supporting Clusters — Designed to support and strengthen areas of major emphasis.Note of caution: Neglecting material, whether it is found in the major or additional/supporting clusters, will leave gapsin students’ skills and understanding and will leave students unprepared for the challenges they face in later grades.Adapted from Smarter Balanced Assessment Consortium 2012b, 87.11. The standards in this cluster represent opportunities to apply percentages and proportional reasoning. In order to makeinferences about a population, one needs to apply such reasoning to the sample and the entire population.2. Probability models draw on proportional reasoning and should be connected to the major work in those standards.California Mathematics FrameworkGrade Seven329
Connecting Mathematical Practices and ContentThe Standards for Mathematical Practice (MP) are developed throughout each grade and, together withthe content standards, prescribe that students experience mathematics as a rigorous, coherent, useful,and logical subject. The MP standards represent a picture of what it looks like for students to understand and do mathematics in the classroom and should be integrated into every mathematics lessonfor all students.Although the description of the MP standards remains the same at all grade levels, the way thesestandards look as students engage with and master new and more advanced mathematical ideas doeschange. Table 7-2 presents examples of how the MP standards may be integrated into tasks appropriatefor students in grade seven. (Refer to the Overview of the Standards Chapters for a complete descriptionof the MP standards.)Table 7-2. Standards for Mathematical Practice—Explanation and Examples for Grade SevenStandards forMathematicalPracticeMP.1Make sense ofproblems andpersevere insolving them.MP.2Reasonabstractly andquantitatively.MP.3Constructviable arguments andcritique thereasoning ofothers.MP.4Model withmathematics.Explanation and ExamplesIn grade seven, students solve problems involving ratios and rates and discuss how theysolved them. Students solve real-world problems through the application of algebraic andgeometric concepts. They seek the meaning of a problem and look for efficient ways torepresent and solve it. They may check their thinking by asking themselves “Does this makesense?” or “Can I solve the problem in a different way?” When students compare arithmetic and algebraic solutions to the same problem (7.EE.4a ), they identify correspondencesbetween different approaches.Students represent a wide variety of real-world contexts through the use of real numbersand variables in mathematical expressions, equations, and inequalities. Studentscontextualize to understand the meaning of the number or variable as related to theproblem and decontextualize to manipulate symbolic representations by applyingproperties of operations.Students construct arguments with verbal or written explanations accompanied byexpressions, equations, inequalities, models, graphs, and tables. They further refine theirmathematical communication skills through mathematical discussions in which theycritically evaluate their own thinking and the thinking of other students. For example, asstudents notice when geometric conditions determine a unique triangle, more than onetriangle, or no triangle (7.G.2), they have an opportunity to construct viable argumentsand critique the reasoning of others. Students should be encouraged to answer questionssuch as these: “How did you get that?” “Why is that true?” “Does that always work?”Seventh-grade students model real-world situations symbolically, graphically, in tables, andcontextually. Students form expressions, equations, or inequalities from real-world contextsand connect symbolic and graphical representations. Students use experiments or simulations to generate data sets and create probability models. Proportional relationships presentopportunities for modeling. For example, for modeling purposes, the number of people wholive in an apartment building might be taken as proportional to the number of stories in thebuilding. Students should be encouraged to answer questions such as “What are some waysto represent the quantities?” or “How might it help to create a table, chart, or graph?”
Table 7-2 (continued)Standards forMathematicalPracticeMP.5Use appropriate toolsstrategically.MP.6Attend toprecision.MP.7Look for andmake use ofstructure.MP.8Look forand expressregularity inrepeatedreasoning.Explanation and ExamplesStudents consider available tools (including estimation and technology) when solving amathematical problem and decide if particular tools might be helpful. For instance, students in grade seven may decide to represent similar data sets using dot plots with the samescale to visually compare the center and variability of the data. Students might use physicalobjects, spreadsheets, or applets to generate probability data and use graphing calculatorsor spreadsheets to manage and represent data in different forms. Teachers might ask, “What?”approach are you considering?” or “Why was it helpful to useStudents continue to refine their mathematical communication skills by using clear andprecise language in their discussions with others and in their own reasoning. Students definevariables, specify units of measure, and label axes accurately. Students use appropriateterminology when referring to rates, ratios, probability models, geometric figures, data displays, and components of expressions, equations, or inequalities. Teachers might ask, “What?mathematical language, definitions, or properties can you use to explainStudents routinely seek patterns or structures to model and solve problems. For instance,students recognize patterns that exist in ratio tables, making connections between theconstant of proportionality in a table with the slope of a graph. Students apply propertiesto generate equivalent expressions and solve equations. Students compose and decomposetwo- and three-dimensional figures to solve real-world problems involving scale drawings,surface area, and volume. Students examine tree diagrams or systematic lists to determinethe sample space for compound events and verify that they have listed all possibilities. Solvis easier if students can see and make use of structure,ing an equation such astemporarily viewingas a single entity.In grade seven, students use repeated reasoning to understand algorithms and makegeneralizations about patterns. After multiple opportunities to solve and model problems,if and only ifand construct other examples and modelsthey may notice thatthat confirm their generalization. Students should be encouraged to answer questions such?” or “How is this situation both similar to andas “How would we prove thatdifferent from other situations using these operations?”Adapted from Arizona Department of Education (ADE) 2010, Georgia Department of Education 2011, and North CarolinaDepartment of Public Instruction (NCDPI) 2013b.Standards-Based Learning at Grade SevenThe following narrative is organized by the domains in the Standards for Mathematical Content andhighlights some necessary foundational skills from previous grade levels. It also provides exemplars toexplain the content standards, highlight connections to Standards for Mathematical Practice (MP), anddemonstrate the importance of developing conceptual understanding, procedural skill and fluency, andapplication. A triangle symbol ( ) indicates standards in the major clusters (see table 7-1).California Mathematics FrameworkGrade Seven331
Domain: Ratio and Proportional RelationshipsA critical area of instruction in grade seven is developing an understanding and application of proportional relationships, including percentages. In grade seven, students extend their reasoning about ratiosand proportional relationships in several ways. Students use ratios in cases that involve pairs of rationalnumber entries and compute associated rates. They identify unit rates in representations of proportional relationships and work with equations in two variables to represent and analyze proportional relationships. They also solve multi-step ratio and percent problems, such as problems involving percentincrease and decrease (University of Arizona [UA] Progressions Documents for the Common Core MathStandards 2011c).Ratios and Proportional Relationships7.RPAnalyze proportional relationships and use them to solve real-world and mathematical problems.1. Compute unit rates associated with ratios of fractions, including ratios of lengths, areas and other quantities measured in like or different units. For example, if a person walks mile in each hour, compute theunit rate as the complex fractionmiles per hour, equivalently 2 miles per hour.2. Recognize and represent proportional relationships between quantities.a. Decide whether two quantities are in a proportional relationship, e.g., by testing for equivalentratios in a table or graphing on a coordinate plane and observing whether the graph is a straight linethrough the origin.b. Identify the constant of proportionality (unit rate) in tables, graphs, equations, diagrams, and verbaldescriptions of proportional relationships.c. Represent proportional relationships by equations. For example, if total cost is proportional tothe number of items purchased at a constant price , the relationship between the total cost and thenumber of items can be expressed as.d. Explain what a point ( , ) on the graph of a proportional relationship means in terms of the situation,with special attention to the points (0,0) and (1, ) where is the unit rate.The concept of the unit rate associated with a ratio is important in grade seven. For a ratioandwith,3 the unit rate is the number . In grade six, students worked primarily with ratiosinvolving whole-number quantities and discovered what it meant to have equivalent ratios. In gradeseven, students find unit rates in ratios involving fractional quantities (7.RP.1 ). For example, whena recipe calls forcups of sugar to 3 cups of flour, this results in a unit rate of. The fact thatany pair of quantities in a proportional relationship can be divided to find the unit rate is usefulwhen students solve problems involving proportional relationships, as this allows students to set up anequation with equivalent fractions and use reasoning about equivalent fractions. For a simple example,if a recipe with the same ratio as given above calls for 12 cups of flour and a student wants to knowhow much sugar to use, he could set up an equation that sets unit rates equal to each other—such as, where represents the number of cups needed in the recipe.23. Although it is possible to define ratio so that can be zero, this will rarely happen in context, so the discussion proceeds withthe assumption that both and are non-zero.
In grade six, students worked with many examples of proportional relationships and represented them numerically,pictorially, graphically, and with equations in simple cases.In grade seven, students continue this work, but theyexamine more closely the characteristics of proportionalrelationships. In particular, they begin to identify thesefacts: When proportional quantities are represented in atable, pairs of entries represent equivalent ratios. The graph of a proportional relationship lies on astraight line that passes through the point (0,0),indicating that when one quantity is 0, so is the other.43 Equations of proportional relationships in a ratio ofalways take the form, where is the constantif the variables and are defined so that the ratiois equivalent to. (The number is also knownas the constant of proportionality [7.RP.2 ]).Thus, a first step for students—one that is often overlooked—is to decide when and why two quantities areactually in a proportional relationship (7.RP.2a ). Studentscan do this by checking the characteristics listed aboveor by using reasoning; for example, a runner’s heart ratemight increase steadily as she runs faster, but her heartrate when she is standing still is not 0 beats per minute,and therefore running speed and heart rate are notproportional.The study of proportional relationships is a foundation forthe study of functions, which is introduced in grade eightand continues through higher mathematics. In gradeeight, students will understand that the proportionalrelationships they studied in grade seven are part of abroader group of linear functions. Linear functions arecharacterized by having a constant rate of change (thechange in the outputs is a constant multiple of the changein the corresponding inputs). The following examplesshow students determining whether a relationship isproportional; notice the different methods used.Ratios, Unit Rates, andProportional RelationshipsA ratio is a pair of non-negative, which are not bothnumbers,0. When there are units of onequantity for every units of anotherquantity, a rate associated with theis units of the first quanratiotity per 1 unit of the second quantity.(Note that the two quantities mayhave different units.)The associated unit rate is the number . The term unit rate refers tothe numerical part of the rate; the“unit” is used to highlight the 1 in“per 1 unit of the second quantity.”Unit rates should not be confusedwith unit fractions (which have a 1in the numerator).A proportional relationship is acollection of pairs of numbers thatare in equivalent ratios. A ratiowithdetermines a proportionalrelationship, namely the collectionof pairs ( , ), where is positive. Aproportional relationship is described,by an equation of the formwhere is a positive constant, oftencalled a constant of proportionality.The constant of proportionality, , isequal to the value . The graph ofa proportional relationship lies on aray with the endpoint at the origin.Adapted from UA Progressions Documents2011c.4. The formal reasoning behind this principle and the next one is not expected until grade eight (see 8.EE.5 and 8.EE.6 ).However, students will notice and informally use both principles in grade seven.California Mathematics FrameworkGrade Seven333
Examples: Determining Proportional Relationships7.RP.2a1. If Josh is 20 and his niece Reina is 10, how old will Reina be when Josh is 40?Solution: If students erroneously think that this is a proportional relationship, they may decide that Reina willbe 20 when Josh is 40. However, it is not true that their ages change in a ratio of 20:10 (or 2:1). As Josh ages20 years, so does Reina, so she will be 30 when Josh is 40. Students might further investigate this situation bygraphing ordered pairs ( , ), where is Josh’s age and is Reina’s age at the same time. How does the graphdiffer from a graph of a proportional relationship?2. Jaime is studying proportional relationships in class. He says that if it took two people 5 hours to paint afence, then it must take four people 10 hours to paint a fence of the same size. Is he correct? Why or whynot? Is this situation a proportional relationship? Why or why not?Solution: No, Jaime is not correct—at least not if it is assumed that each person works at the same rate. Ifmore people contribute to the work, then it should take less time to paint the fence. This situation is not aproportional relationship because the graph would not be a straight line emanating from the origin.3. If 2 pounds of melon cost 4.50 at the grocery store, would 7 pounds cost 15.75?Solution: Since a price per pound is typically constant at a grocery store, it stands to reason that there is aproportional relationship here:It makes sense that 7 pounds would cost 15.75. (Alternatively, the unit rate is 2.25 per pound. At that rate, 7 pounds costs. This equals, or 15.75.), for a rate of4. The table at right gives the price for different numbers of books. Do the numbers in the table represent aproportional relationship?Solution: If there were a proportional relationship, it should be possibleto make equivalent ratios using entries from the table. However, sincethe ratios 4:1 and 7:2 are not equivalent, the table does not representa proportional relationship. (Also, the unit rate [price per book] of the firstratio is , or 4.00, and the unit rate of the second ratio is , or 3.50.)Price ( )No. of Books4172103134Adapted from ADE 2010 and NCDPI 2013b.Focus, Coherence, and RigorProblems involving proportional relationships support mathematical practices asstudents make sense of problems (MP.1), reason abstractly and quantitatively (MP.2),and model proportional relationships (MP.4). For example, for modeling purposes,the number of people who live in an apartment building might be taken as proportional to the number of stories in the building.Adapted from PARCC 2012.334Grade SevenCalifornia Mathematics Framework
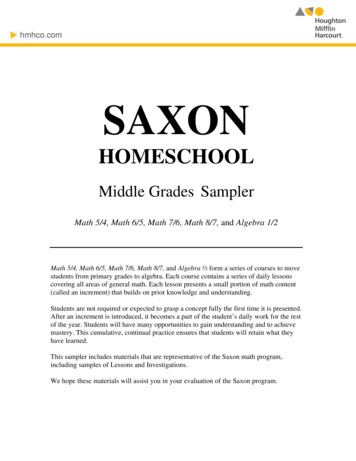
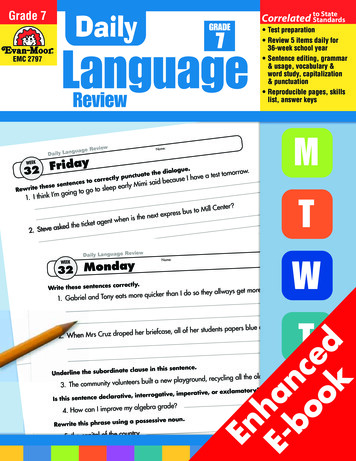
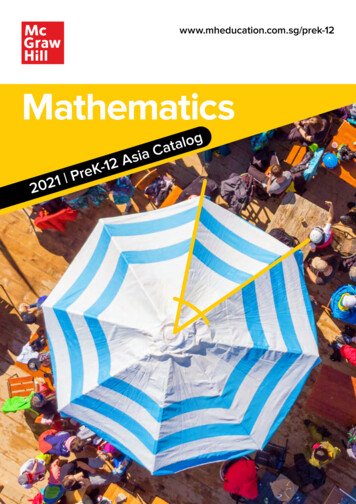
As students work with proportional relationships, they write equations of the form, whereis a constant of proportionality (i.e., a unit rate). They see this unit rate as the amount of increase inas increases by 1 unit in a ratio table, and they recognize the unit rate as the vertical increase ina unit rate triangle (or slope triangle) with a horizontal side of length 1 for a graph of a proportionalrelationship.Example7.RP.2Representing Proportional Relationships. The following example from grade six is presented from agrade-seven perspective to show the progression from ratio reasoning to proportional reasoning.A juice mixture calls for 5 cups of grape juice for every 2 cups of peach juice. Use a table to represent severaldifferent batches of juice that could be made by following this recipe. Graph the data in your table on a coordinate plane. Finally, write an equation to represent the relationship between cups of grape juice and cupsof peach juice in any batch of juice made according to the recipe. Identify the unit rate in each of the threerepresentations of the proportional relationship.Using a Table. In grade seven, students identify pairs ofCups of Grapevalues that include fractions as well as whole numbers.Cups of PeachThus, students include fractional amounts betweenBatch A005 cups of grape juice and 2 cups of peach juice in theirBatch B52tables. They see that as amounts of cups of grape juiceBatch C1Batch D2Batch E3Batch F4increase by 1 unit, the corresponding amounts of cupsof peach juice increase byunit, so that if we addcups of grape juice, then we would addcupsof peach juice. Seeing this relationship helps studentsto see the resulting equation,. Another wayto derive the equation is by seeingmultiplying each side by would yieldwhich results inAny batchmadeaccording tothe recipe, and so,.Using a Graph. Students create a graph, realizing that even non-whole-number points represent possiblecombinations of grape and peach juice mixtures. They are learning to identify key features of the graph—inparticular, that the resulting graph is a ray (i.e., contained in a straight line) emanating from the origin andthat the point (0,0) is part of the data. They see the point(1, ) as the point corresponding to the unit rate, andthey see that every positive horizontal movement ofpositive vertical movement ofaddingof a unit (e.g.,cup of peach juice). The connectionbetween this rate of change seen in the graph andthe equationshould be made explicit fory 2x52.5Cups of Peach1 unit (e.g., adding 1 cup of grape juice) results in ay32(x,y)1.51 0.5 1students, and they should test that every point onthe graph is of the form ( ,).California Mathematics Framework00.511.525x22.533.544.55Cups of GrapeGrade Seven335
Example: 7.RP.2 (continued)Deriving an Equation. Both the table and the graph show that for every 1 cup of grape juice added, cup ofpeach juice is added. Thus, starting with an empty bowl, when cups of grape juice are added,cup ofpeach juice must be added. On the graph, this corresponds to the fact that, when starting from (0,0), everyunits. In either case, the equationmovement horizontally of units results in a vertical movement ofbecomes.Adapted from UA Progressions Documents 2011c.Students use a variety of methods to solve problems involving proportional relationships. They shouldhave opportunities to solve these problems with strategies such as making tape diagrams and doublenumber lines, using tables, using rates, and by relating proportional relationships to equivalent fractions as described above.Examples: Proportional Reasoning in Grade Seven7.RP.2Janet can sew 35 scarves in 2 hours. At this rate, how many scarves can she sew in 5 hours?Solution Strategies(a) Using the Rate. Since Janet can sew 35 scarves in 2 hours, this means she can sew at a rate ofscarves per hour. If she works for 5 hours, then she can sew,which means she can sew 87 scarves in 5 hours.(b) Setting Unit Rates Equal. The unit rate in this case iscan sew in 5 hours, then the following equation can be set up:. Ifrepresents the number of scarves Janetalso represents the unit rate. To solve this, we can reason that since, it must be true that, yielding, which is interpreted to mean that Janet can sew 87 scarves in 5 hours.Alternatively, one can see that the equation above is of the formIn that case,., where and are rational numbers.(c) Recognizing an Equation. Students can reason that an equation relating the number of scarves, , and thenumber of hours, , takes the form, so that can be found by. Again, the answeris interpreted to mean that Janet can sew 87 scarves in 5 hours.Adapted from ADE 2010.A typical strategy for solving proportional relationship problems has been to “set up a proportion andcross-multiply.” The Common Core State Standards move away from this strategy, instead promptingstudents to reason about solution strategies and why they work. Setting up an equation to solve aproportional relationship problem makes perfect sense if students understand that they are settingunit rates equal to each other. However, introducing the term proportion (or proportion equation) may336Grade SevenCalifornia Mathematics Framework
needlessly clutter up the curriculum; rather, students should see this as setting up an equation in asingle variable. On the other hand, if after solving multiple problems by reasoning with equivalentprecisely when,fractions (as in strategy [b] above) students begin to see the pattern thatthen this is something to be examined, not avoided, and used as a general strategy if students are ableto justify why they use it. Following are additional examples of proportional relationship problems.Further Examples of Proportional Reasoning for Grade Seven7.RP.21. A truck driver averaged about 300 miles in 5.5 hours of driving. At the same rate, approximately howmuch more driving time will it take him to cover the remaining 1000 miles on his route?Solution: Students might see the unit rate asand set up the following equation:In this equation, represents the number of driving hours needed to cover the remaining 1000 miles.Students might see that; so it must also be true that. This means thatTherefore, the truck driver has around 18 hours and 20 minutes of driving time remaining.2. Ifgallon of paint coversof a wall, then how much paint is needed to cover the entire wall?Solution: Students may see this as asking for the rate—that is, how much paint is needed per 1 wall. In thatcase, students would divide:, so that 3 gallons of paint will cover the entire wall.Or, a student might see that one full wall could be represented by, so to get the amount of paint needed.to cover the entire wall, he would need to multiply the amount of paint by 6 also:Adapted from Kansas Association of Teachers of Mathematics (KATM) 2012, 7th Grade Flipbook.3. The recipe for Perfect Purple Paint calls for mixing cup blue paint with cup red paint. If a personwanted to mix blue and red paint in the same ratio to make 20 cups of Perfect Purple Paint, how manycups of blue paint and how many cups of red paint would be needed?Solution (Strategy 1): “If I make 6 batches of purple, then that means I use 6 times more blue and red paint.This means I usecups of blue andcups of red, which yields a total of 5 cups of purple paint(i.e., 6 batches yields 5 cups). So to make 20 cups, I can multiply these amounts of blue and red by 4 to get 12cups of blue and 8 cups of red.”Solution (Strategy 2): “One batch iscup in volume. The fraction of one batch that is blue is then. The fraction of one batch that is red isof 20, that gives me how much blue and red to use:. If I find these fractionsandThis means I need 12 cups of blue and 8 cups of red.”Adapted from UA Progressions Documents 2011c.California Mathematics
Grade-Seven Chapter of the Mathematics Framework for California Public Schools: Kindergarten Through Grade Twelve Adopted by the California State Board of Education, November 2013. Published by the California Department of Education