Transcription
Journalof Public Economics15 (1981) LAugustDOESPublishingANYONECompanyELSE?on the provision of public goods, IVUniversity of , revised versionE. AMES*WI 53706, USAreceived January1981Eleven closely related experimentstesting the free rider hypothesisunder different conditions,and sampling various subpopulations,are reported. Results question the empirical validity andgenerality of a strong version of the hypothesis. Some reasons for its failure are discussed.1. IntroductionThe free rider hypothesis[Hardin(1968), Olson (1968)] has been one ofthe most widely accepted propositionsin the literatureon the provisionofpublic goods by groups. This acceptance, however, has been based primarilyon the strength of the theoretical argument, and the citation of commonplaceexample, rather than rigorous empirical test. In this paper we report on aseries of experimentsexpressly designed to test the hypothesisand relatedaspects of the theory. Some of these experimentshave been extensivelyreportedin the sociologicalliterature[Marwelland Ames (1979, 1980)containexperiments1, 2, 5, 6; Alfano and Marwell(1980) reportsonexperiment111. Others will be reported here for the first time. Our objectiveis to review and consider the sum of our findings.The experimentsreported here add substantiallyto a small, but quicklygrowing experimentalliterature whose general trend has been to question thepower of the free rider hypothesis for predicting behavior in collective actionsituations.A large portion of this work has been done by psychologistsandhas recently been reviewed by Dawes (1980) and Edney (1980). Almost all ofthis work, however, has dealt with free riding in small groups. Similarly, thefew articles by economistsand sociologistswhich have appearedin theliteraturealso tend to deal with relativelysmall numbersof subjects in*This research was supportedby NationalScience Foundationgrants No. GS-3742 and No.GS-43507. A version was presented at the Public Choice Associationmeeting in March, 1980.We would like to thank GeraldineAlfano and John Fleishmanfor their advice on andparticipationin this work. We also thank Gene Smolensky,Michael Rothschild,Lee Hansonand Arthur Goldbergerfor their patience.004772727/81/0000 0000/ 02.50G North-HollandPublishingCompany
296G. Marwelland R.E. Ames, Free rider hypothesisrelatively small groups [Bohm (1972) Brubaker (1975) Sweeney (1973) Smith(1978) Schneider and Pommerehne(1979)]. These latter works also tend touse very complex experimentaldesigns, running individualsubjects throughmultipletrials, each of which involves a somewhatdifferent experimentalcondition.In the research reported below standard social psychologicalexperimentalprocedures are employed. Care is taken to have subjects understandthe taskand the situation.Subjects are not used in more than one conditionso thatthere is no contaminationfrom order effects, etc. Equally important,thenumberof experimentsand subjects involved serves to replicate and giveweight to our conclusions.In our experiments‘free riding’ refers to the absence of contribution.towards the provision of a public good by an individual,even though he orshe will not be excluded from benefitingfrom that good. The free riderhypothesisis based on the assertionthat under such conditionsit isirrationalfor an individualto voluntarilycontribute.FollowingBrubaker(1975) however, we will consider two versions of the group-level implicationof this assertion: the ‘weak’ version of the free-rider hypothesis, which statesthat the voluntaryprovision of public goods by groups will be sub-optimal;and the ‘strong’ version, which argues that (virtually) no public goods at allwill be provided through voluntary means.2. The research paradigmTo test the free rider hypothesis,and related aspects of the theory, wecreateda highly controlled,very abstract,experimentalsituation.Theoriginal experimentswere designed to maximize the probabilityof free ridingby minimizingthe possible effects of normativeand other pressuresforcontributingtowards the public good. Althoughaspects of the paradigmchanged for different experiments,it is useful to begin by describingthesimplest version that we used. All experimentsin the program may be seenas variants of this situation.2.1. Dependentvariable:Investmentin the public goodThe central ingredient in the research paradigm was the operationalizationof our dependentvariable - investmentin a public good. For this purpose,subjects were providedwith a given amountof resources, in the form oftokens, which they had to invest in one of two ‘exchanges’: The ‘groupexchange’or the ‘individualexchange’.The group exchangewas ouroperationalizationof a public good, while the individualexchange was aprivate good. Tokensinvestedin the individualexchangeearned a setamount, regardless of the behaviourof other group members or anything
G. Marwell and RX. Ames, Free rider hypothesis297else. In a typical experiment this might be one cent per token. The individualexchange was thus like a bank in assuring a specific return on investment.The return was ‘excludable’ in neither affecting, nor being affected by, returnsto other group members.The group exchange, on the other hand, paid its cash earningsto allmembers of the group by a pre-set formula, regardless of who invested. Thesubject received a share of the return on his own investmentin the groupexchange (if any), and also the same share of the return on the investmentof each of the other group members. Thus, the group exchange provided ajoint, nonrival,nonexcludable,or public form of payoff. What made thegroup exchange a public good when compared with the individualexchange,was that it was possible to have the group exchange return substantiallymore than the fixed amount set for the individualexchange. For example, inseveral experimentsreported below the group exchange returned 2.2 cents tothe group for every token invested by any group member.Under thesecircumstances,all members of the group would be better off if all the group’sresources were invested in the group exchange than if all were invested in theindividualexchange. On the other hand, each individualwould be best off ifs/he invested in the individualexchange while everyone else invested in thegroup exchange. This is the incentiveto ‘free ride’ on the investmentsofothers in the public good.Subjectswere allowedto dividetheir investmentbetweenthe twoexchangesin any way they wished. The investmentdecision they madecomprised the measure of the dependentvariable.2.2. ProceduresIn general, all contactwith the subjects of these experimentswas bytelephone and mail. The subjects were first reached by telephone and asked ifthey were interested in participatingin an experiment concerninginvestmentdecisions.If they wishedto participatethey were sent a packetofinstructions.The instructionsgave a complete, and (in all but one particular)honest descriptionof the nature of the study, the investmentdecision to bemade, and all other factors that might be relevant to that decision. Ourintention was to have the subject act with ‘full information’.The instructionswere carefully designed, with cartoons and tables, and were repetitive, so thatwe might make as clear as possible a mildly complex situation.A few days after the mailing an experimentercalled the subject and wentover each point in the instructions,testing and reviewing until the subjectfully understoodthe situation and the decision to be made. The subject wasthen given one or two days to decide on an investment,and was again calledby the experimenter.At this point the subject reportedthe investmentdecision,answeredseveral questionscheckingfor understandingof thesituation, and verbally explained the reasons for his or her behavior. Finally,
298G. Marwelland R.E. Ames, Free rider hypothesissubjects respondedto a mailed questionnaireregarding certain backgroundand personalitycharacteristicsand their reactions to the experiment.3. Consensual validation of the operationalizationLargely because neither of us is a trained economist,we felt somewhatinsecure in defendingour operationalizationof economictheory, and inasserting the predictionsof theory for behavior in our experimentalsituation.In responseto these problemswe decided to validate our approachbyconsultingwith acknowledgedexperts in this area. Some of our consultation,of course, was of the usual kind, and helped us in refining our hypotheses,methodsand procedures.In addition,however,we pursueda moresystematic method of validationwhich can be usefully summarized.Using our own knowledgeof the literature,advice from our consultingeconomists,and excluding all those experts with whom we had previouslydiscussedthis project,we selected six economistsand one sociologistprominentin this area.’ Each expert was sent a version of our experimentalsituation (see experiment3, below) along with a questionnaire.He was askedto indicate what he thought relevant theory would predict about our subjects’investmentbehavior,and also whetherhe personallyagreed with theprediction from theory. If he did not agree with the theory (as he saw it), hewas asked to indicate the bases on which he disagreed.One economistdeclined to answer our questions,arguing that economictheory made no relevant predictions.A second economist had major qualmsabout making predictions,since he felt the situation was too ‘rich’ for a puretest of relevant theories. Nevertheless,he did make predictions,and we willinclude them below. The six panel members who did make predictions all feltthat either ‘economic theory’ or ‘game theory’, or both, were relevant to thissituation.Five of the six respondentsagreed that theory clearly supported the strongfree rider hypothesis. Four stated that theory predicted that group memberswould invest no tokens at all, while the fifth estimated investmentsof lessthan 5”/;; of the tokens in the group exchange. The sixth respondentsaid thetypical individual would invest 30% of his or her tokens, but added that thispredictioncame from a combinationof theory and his reading of previous,vaguelyrelated,empiricalresearch.In general,then, we considerourdescriptionof the theoreticalpredictionsfor our operationsto be stronglysupported.We should add, however, that four of the experts felt that the subjectswould actually invest more than the theory predicted, and suggested 25 “/,,25 “/,, ‘5 to 15 7: and ‘10 to 20% of available tokens as typical investments.In all, the average predictionby our experts was approximately20 ‘%, of‘Namesavailableon request,but we’d prefer you didn’t ask
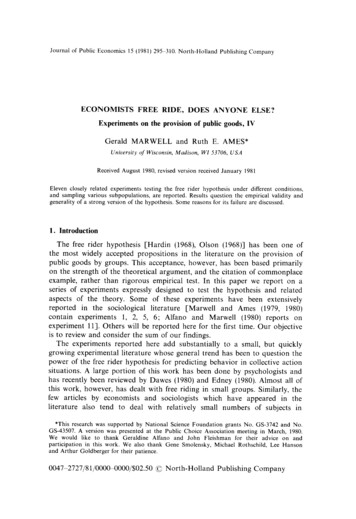
G. Marwell and R.E. Ames, Free rider hypotheses299resources, with a range from 0 to 30%. The major reasons given for these‘non-theory’predictionswere that people either liked taking risks and werewilling to pay for them, or were altruistic (equated to some extent with being‘silly’ or ‘irrational’).It should be remembered,however, that even thesesomewhat higher predictionsenvision behavior that is primarily free riding,with only small amounts of investmentresulting from ‘irrationality’.4. Experiment1: The basic experimentIn the simplest version of our experimentsall subjects were presented witha single set of conditions,and their behavior compared with predictions fromtheory. Subjects were sixteen male and sixteen female high school juniorsand seniors selected from a list of such students for Madison, Wisconsin.Inthis study, as in the other studies reported below, about 40”/, of all studentsasked to participatein the research declined. Nevertheless,differences on aseries of backgroundfactors among those who participatedand those whodid not were negligible,and the sample is much less of a ‘convenience’sample than is usuallyfound in experimentalwork. For an extendeddiscussionof samplingand other methodologicalissues, see Marwell andAmes (1979).Subjects were told that they belonged to a group of eighty high schoolall of whom were making a similar economicstudents‘like themselves’,decision. Each was provided with 225 tokens which he or she could invest ineither the group or the individualexchange.The individualexchangereturnedone cent for each token invested. The group exchange paid inaccordancewith the schedule containedin table 1. This table was actuallymailed to every subject. Returnswere given in a table, and were notcontinuous,because pretestingindicatedthat subjects were better able tounderstandthe structure of payoffs under these conditions.In addition, pretests indicatedthat subjects did not make the fine predictionsof others’investmentsthat would be requiredfor them to calculatewhetheranadditionalinvestmenton their part would ‘put the group over’ the border ofspecific intervals.Payoffs for the group exchange averaged 2.2 cents pertoken.ResultsInvestmentin the public good by members of the group certainly did notfit a strong version of the free rider problem. The mean investmentwas 93.8tokens or 42% of available resources. Although this is clearly sub-optimal,itis just as clearly not zero, or insignificant.Consideringthe explicitlydepersonalized,profit-oriented,full informationnature of the experiment,thestrong free rider propositiondid not appear to predict behavior accurately.
1 0.000.551.101.652.202.753.303.854.404.95 2.00396.000 and 1999 tokens2000 and 39994000 and 59996000 and 79998000 and 999910000 and 1199912000 and 1399914000 and 1599916000 and 1799918000you1 and comparableTablestudyHow much moneyget (1.25 cent of eachgroup dollar)exchange,Total moneyearned bythe group isStudy 1from groupIf the total tokensinvested in thegroup exchange by allgroup members is betweenPayoffs 0.00450.00Total moneyearned bythe group is’in study 3.Study 3condition0.180.400.684.004.384.885.255.505.63 0.00How much money youget (1.25 cent of eachgroup dollar)
G. Marwell and R.E. Ames, Free rider hypothesisThe weak version,very stringent.5. Experimentof course,fared better.However,its requirements301are not2: Skewed resources and interestAt the same time as we ran experiment1, nt,morecomplexconditions.Sincevariationsin these conditionsdid not producesignificantvariationsininvestmentwe will not describe them in detail. It should be sufficient toindicate that the key independentvariables were the perceived distributionofresources within the group, and the perceived distributionof interest. Insome conditionsa number of subjects were given 165 tokens to invest, whileothers received 405 tokens each. The subjects were aware of this skeweddistributionof resources.Under other conditionssome subjects received2.25 ‘x of returns to the group from the group exchange, while other subjectsreceived 0.92%. Again, subjects were aware of this skewed distributionofinterest. Finally, under some conditionsboth interest and resources wereskewed.Alongwith the conditionsreportedaboveas experiment1, theseconditionsconstituteda multifactor,fully crossed experimentaldesign, whoseindependentvariableshad little consistenteffect on investment.What isimportantto report, however, is that for these 96 additionalsubjects meaninvestmentin the public good was even higher than for the subjects reportedon under experiment1. For the 96 additionalsubjects mean investmentwas119.8 tokens, or 53 % of availableresources. If all 128 subjects (includingthose from experiment1) are consideredas participatingin a singleexperiment,the mean investmentwas 113 tokens, or 507: of the possiblemaximum.In all, these results certainly reinforce our earlier conclusions.6. Experiment3: Provision pointOne characteristicof some public goods that was not consideredin theexperimentsreported above, but which many sociologists,at least, considercrucial, is the fact that they are ‘lumpy’. Small amountsof the good areworth little or nothing. Only when some specified provision point is passed isthe good valuable. For example, 49 % of the workforce joining a union mightjust as well be 4.9 y0 - in neither case does the union get bargainingpower,recognition,or a contract.Experiment3 was identical to experiments1 and 2 (combined) in design,with one fundamentalexception the payoff schedule for the groupexchangewas altered. The right-handside of table 1 presentsthe newschedule, as given to the participants.The key difference here was the
302G. Marwell and R.E. Ames, Free rider hypothesispresenceof a ‘provisionpoint’. For the first 8000 tokens invested by thein the group exchange(i.e. up to 44% of the group’s availableresources) returns to investmentwere near zero. If more than 8000 tokenswere invested however, the group exchange returned approximately3.8 centsfor every token invested, including the first 8000.groupResultsAgain,the resultsstronglytreatments,an average of 112.8individualsas comparedwithcomprised51 “/0 of the availablewere not significant. Consistency7. Experimentsupportthe previousfindings.Over alltokens were invested in the public good by113 in experiments1 and 2. This againresources.Differencesamong treatmentswith the previous studies was remarkable.4: Small groupsExperiment4 was identical to experiment3 in every way except one subjects were informedthat their groups containedfour rather than 80persons. Under these conditionssome subjects perceive that they are in aposition to profit even if they provide the public good all by themselves.They have sufficient interest that they should not free ride.2 Of course, it waspartly to see if these subjects would provide the good that these conditionswere examined in the first place.ResultsAs expected, subjects with sufficient interest in the public good to profitexchangeinvestedatfrom any investmentthey made in the groupparticularlyhigh levels - an average of 87 % of their available resources.More importantfor this paper, the remainingsubjects invested an average of124 tokens, approximately60% of their available resources. For this groupthe strong free rider hypothesiswas once again not supported.Subjectsinvested at high levels. Only the weak free rider hypothesisreceived anysupport.8. Experiment5: Experienced subjectsOne threat to the generalizabilityof the above experimentsis the fact thateach subject confrontedhis or her investmentdecision only once. Sincesubjects were in a highly abstract, ‘unrealistic’ situation, their initial decisionsmight have reflected a lack of understanding- or lack of full information.2Because of the provision point, and the fact that many of the subjects did not have sufficientresources to reach that point, investment was not always their dominant strategy.
G. Marwell and R.E. Ames, Free rider hypothesis303Experiment5 therefore replicated the proceduresof experiment1, with thekey exceptionthat all 32 subjects were experienced.Each had previouslyparticipatedin either experiment1 or experiment2. In addition, all payoffswere doubled, partly to meet some of the effects of inflation on the value ofthe decision, and generally to increase the importanceof the decision. Thus,for example, returns from the individualexchange were now 2 cents pertoken.ResultsThe most importantresult from this experimentis the full replicationoffindings from experiment1. Subjects invested an average of 106 tokens in thegroup exchange,or 47% of their available&esources. Comparingthesesubjects with those in experiment1 reveals no Sgnificant difference in meaninvestment.In general, subjects tended to invest in much the same way theyinvested the first time, the correlationbetween first and second investmentbeing 0.42.9. Experiment6: High stakesThe departurefrom theoreticalexpectationsfoundin the previousexperimentsmight also arise from the fact that subjects were deciding aboutrelatively small amounts of money. With such ‘low’ stakes they might havebeen willing to gamble, or be altruistic. Thus, experiment6 was designed tocompletelyreplicateexperiment1, except that the stakes were raisedsubstantially- by a factor of live. Every token invested in the individualexchange returned live cents. Group returns were similarly affected, and itappeared to subjects that up to 1,980 could now be earned by the group.This meant that the maximumany of the subjects under these conditionscould earn was 33.25 - if he or she free rode while everyone else investedin the public good. This was certainly a meaningfulamount for the typicalhigh school student.ResultsResults from this study are somewhat complex because of a problem thatdevelopedwith new experimenters.For the only time in the researchprogram, results systematicallydiffered (althoughnot extremely) dependingon which individualexperimenterconductedthe interviews.For a fullanalysis of the results the reader is referred to the original report [Marwelland Ames (1980)].Taken generally, however, the results indicate that there might be somereductionin contributionto the group exchange when stakes are raised.Dependingon which analyticstrategyis pursued,the mean level of
304G. Marwell and R.E. Ames, Free rider hypothesisinvestmentis between 63 and 78 tokens, or 28 “/, and 35 “/;1 of availableresources. The latter, higher estimate, is probably more accurate, as it reflectsthe responses of subjects interviewedby more experiencedinterviewers.Ineither case, however, subjects under high stakes conditionsclearly invest inthe group exchange at a level much higher than would be predicted from astrong version of the free rider hypothesis.A subject who invests even 70tokens in the group exchange is giving up a certain 3.50 to help the othermembers of his or her group, without knowing whether any of them willreciprdrate.We should understandthat at some level of stakes it becomesimprobablethat people would invest in a public good of our kind - whowould rise a certain 100,000 to earn a possible but not very probable, 220,000? But the free-riderpropositionis supposedto apply wheneverpeople are making ‘rationalchoices about amountsof money they findmeaningul,not only when the stakes are enormous.310. Experiments7, 8 and 9: FeedbackOne of our long-held expectationswas that the free rider problem mightbe moresevere underconditionswhere individualsget little or noinformationabout the intentionsof other group members than where someinformationwas available. In particular,we realized that in the real worldpeople rarely make all-or-nothingdecisions at a single point of time. Forexample, potential contributorsto the United Fund are constantlyinformedof the Fund’sprogressso that they can evaluatewhetherothers arecontributingor not. If others are contributingwe might be more willing tocontributeour share as well, If not, we might be more inclined to join themin free riding.In experiments7, 8 and 9 we gave our subjects a chance to gatherinformationon each other’s behavior.The experimentswere identicaltoto invest. Inexperiment1, except that there were two opportunitiesexperiment7, subjects could make an initial investmentof some, none, or allof their tokens in the group or the individualexchange, thus to some extentinforming each other of their ‘intentions’. After informationabout the group’sresponse to this initial phase was broadcast, each subject could distribute thetokens he or she hadn’t yet invested. In experiments8 and 9 tokens investedin the group exchange at time 1 remained in the group exchange at time 2,but additionaltokens could be moved from the individualto the groupexchange after feedback. In all three experimentssubjects were arbitrarilyassigned to groups of 4, whose behaviordeterminedthe feedback thosesubjects would get about other group members’ behavior. Of course, subjects31t is interestingto note that despite the greater range of possible investmentwith higherstakes, subjects in experiments1 and 6 had comparablevariances in investment. The respectivestandard deviations were 67 and 72 tokens.
G. Marwell and R.E. Ames, Free rider hypothesis305were still told that the whole group determinedthe payoffs, and had nofeedbackvariedover subjects.reasonto thinkotherwise.However,Experiments7 and 8 each used 32 high school aged students as subjects,while experiment 9 studied 32 college volunteers.ResultsNo significantdifferencesfrom previousstudies were found in thesestudies. Subjects in experiment7 invested 46% of their available tokens inthe group exchange, while subjects in experiments8 and 9 invested 50% and49% of their tokens, respectively.The previous results were replicated onceagain.11. Experiment10: ManipulatedfeedbackOur last experimentwith feedbackinvolvedmanipulatingwhat thesubjects were told prior to the second stage of investment.Sixteen randomlyselected college subjects were told that their group of eighty (includingthemselves) had invested 7% of its total resources in the group exchange attime 1. Another sixteen were given a more moderate level of investment,48 “/,of the group’s tokens. A third group was given the high figure of 88%.Procedures were otherwise identical to experiment 7.ResultsOnce again, the treatmentmade little difference. The low, medium, andhigh feedbackgroupsinvested43 %, 50% and 44% of their tokens,respectively.None of these figures is much different from those previouslyreported.12. Experiment11: Non-divisibilityThe next-to-lastexperimentto be reportedin this series requiredasomewhat different methodology.Our objective was to see whether subjectsdealing with a non-divisiblepublic good would behave similarly to those inour previous experiments.We defined a non-divisiblegood as one whichmust be consumedcollectively.It cannot be divided up, taken home, andconsumed privately [Head (1962)]. A park or a bridge is of this nature. Ourprevious experimentsinvolved a good - the higher payoff from the groupexchange - that was divisible, like an increase in wages won by a union, ora cartel’s forced increase in prices.Making this comparison,however, required that we study real groups withmemberswho might reasonablyconceiveof themselvesas consumingsomethingcollectively.At the same time, our proceduresrequire that our
306G. Marwelland R.E. Ames, Free rider hypothesissubjectsneitherknowone anothernor interact.To deal with thesecontradictorydemandswe studied a sample of incomingfreshman in thesummer before they arrived at the Universityof Wisconsin.The subjectswere told that they had been assigned to a specific dormitoryfloor and thatthey and the other prospective floor residents were the group being studied.The group that was offered a divisible good was then given the standardinstructionsused in experiment1. The subjects in the non-divisibletreatmentwere given identical instructions,with one exception: they were told that allearnings from the group exchange had to be spent on a group project. Theycould choose anything they wanted on which to spend the money, such as aparty, or a hi-ti for their floor, so long as there was somethingpurchasedcollectively.Since the payoff structures for the two groups were formally identical, weexpected that the non-divisiblegroup would be less inclined to invest in thegroup exchange. We reasoned that demandingcollective consumptionmeantthat individualscould not maximizethe use of their individualsharesaccording to their individualtastes, thus reducing the utility of the returnsfrom the group exchange.ResultsResults were exactly the opposite of our expectations.Membersof thenon-divisiblegroup invested almost twice the amount invested by subjectsgiven our standardexperimentaltreatment.This is particularlynoteworthybecause the control group once again replicated our basic finding - theyinvested 43% of their resources in the public good. Therefore the investmentof 84% of all tokens in the group exchange by the subjects in the nondivisible condition is remarkable.13. Experiment12: Economicsgraduate studentsThe last experiment we report is identical to our first with two exceptions:most importantly,the subjectswere thirty-twofirst-semestergraduatestudents in economics at the Universityof Wisconsin;in addition, the valueof all tokens was doubled(as in study 5). Interestingly,when questionedlater, only two of the graduate students could specifically identify the theoryon which this study was based. As first-year students they had yet to reapthe full benefits of the remarkableeducation assuredly to be theirs.ResultsAt last, a result that is really different.Economicsgraduatestudentscontributedonly an averageof 20% of their resourcesto the groupexchange. They were much more likely to free ride than any of our other
G. Marwelland R.E. Ames, Free rider hypothesis307groupsof subjects.The differencesbetweenthem and the subjectsinexperiment1 is significant at the 0.05 level, (F-test). The previous results donot replicate. One could argue that for this group the strong free riderhypothesis receives some support.14. Summaryand conclusionsFor ease of reference, table 2 presentssubjects in all twelve experiments.TableSummaryof results:the meaninvestmentbehaviorof2Experimentsl-1 1.Mean % ofresources investedExperiment1. Basic experiment2. Skewed resources and/or interestExperiments1 and 2, combined3. Provision point4. Small groups with provision point(except those with sufficient interest to provide thegood themselves)5. Experienced subjects6. High stakesExperienced interviewersAll interviews7. Feedback, no changing initial investment8. Feedback, could change investment in individual account9. Feedback, could change investment in individual accountcollege studentsfeedback10. ManipulatedLowMediumHigh11. Non-divisibilityDivisible (control)Non-divisible12. Economics graduate students-42 PO53 “,,51 7;5 1 l:;,60 “zO41 “j,-Summarizingmost of the results seems ridiculouslyeasy: over and overagain, in replicationafter replication,regardlessof changes in a score ofsituationalvariables or subject characteristics,the strong version of the freeriderhypo
The free rider hypothesis [Hardin (1968), Olson (1968)] has been one of the most widely accepted propositions in the literature on the provision of . Largely because neither of us is a trained economist, we felt somewhat insecure in defending our operationalization of economic theory, and i