Transcription
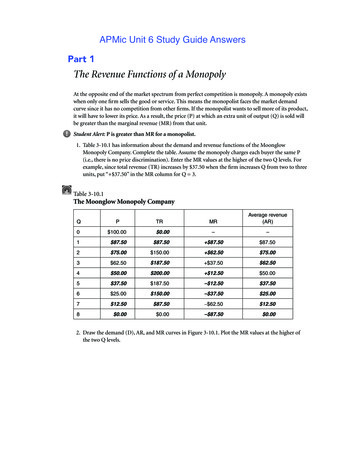
APMic Unit 6 Study Guide Answers3 MicroeconomicsPart 1SOLUTIONSACTIVITY 3-10The Revenue Functions of a MonopolyAt the opposite end of the market spectrum from perfect competition is monopoly. A monopoly existswhen only one firm sells the good or service. This means the monopolist faces the market demandcurve since it has no competition from other firms. If the monopolist wants to sell more of its product,it will have to lower its price. As a result, the price (P) at which an extra unit of output (Q) is sold willbe greater than the marginal revenue (MR) from that unit.Student Alert: P is greater than MR for a monopolist.1. Table 3-10.1 has information about the demand and revenue functions of the MoonglowMonopoly Company. Complete the table. Assume the monopoly charges each buyer the same P(i.e., there is no price discrimination). Enter the MR values at the higher of the two Q levels. Forexample, since total revenue (TR) increases by 37.50 when the firm increases Q from two to threeunits, put “ 37.50” in the MR column for Q 3.Table 3-10.1The Moonglow Monopoly CompanyMRAverage revenue(AR) 0.00–– 87.50 87.50 87.50 87.502 75.00 150.00 62.50 75.003 62.50 187.50 37.50 62.504 50.00 200.00 12.50 50.005 37.50 187.50– 12.50 37.506 25.00 150.00– 37.50 25.007 12.50 87.50– 62.50 12.508 0.00 0.00– 87.50 0.00QP0 100.001TR2. Draw the demand (D), AR, and MR curves in Figure 3-10.1. Plot the MR values at the higher ofthe two Q levels.Advanced Placement Economics Microeconomics: Teacher Resource Manual Council for Economic Education, New York, N.Y.CEE-APE MACROSE-12-0101-MITM-Book.indb 29729726/07/12 5:26 PM
SOLUTIONS3 MicroeconomicsACTIVITY 3-10 (CONTINUED)Figure 3-10.1Monopoly’s Demand, Average Revenue, and Marginal Revenue Curves 100.00 87.50 75.00 62.50 50.00 37.50PRICE 25.00 12.50 0.00D AR– 12.50– 25.00– 37.50– 50.00– 62.50– 75.00MR– 87.50012345QUANTITY6783. Plot the firm’s TR curve in Figure 3-10.2.Figure 3-10.2Monopoly’s Total Revenue Curve 200.00 175.00REVENUE 150.00 125.00 100.00 75.00 50.00 25.00012345QUANTITY678TR4. We see in Table 3-10.1 that the price at which the firm can sell three units is 62.50. Yet the MRfrom the third unit is only 37.50. How do you explain this difference?When the firm lowers its price from 75.00 to 62.50 to increase sales from 2 units to 3 units, twothings happen to total revenue:(1) It receives 62.50 in new total revenue from the sale of the third unit.(2) It has a loss in total revenue of 25.00 from the first two units this period: (2)( 75.00 62.50) 25.00. The marginal revenue of the third unit is the sum of these two effects 62.50 25.00 37.50. Because the firm cannot sell 3 units at the same price at whichit sold 2 units, the price of the third unit is greater than the marginal revenue from that unit.298CEE-APE MACROSE-12-0101-MITM-Book.indb 298Advanced Placement Economics Microeconomics: Teacher Resource Manual Council for Economic Education, New York, N.Y.26/07/12 5:26 PM
SOLUTIONS3 MicroeconomicsACTIVITY 3-10 (CONTINUED)5. Why does the vertical gap between the firm’s D curve and MR curve get larger as the firm sellsmore output?This is because the loss in total revenue from the first units resulting from lowering the price tosell one more unit gets larger as the firm’s total output increases. In other words, the value inPart (2) of the solution to Question 4 gets bigger as the firm’s output gets bigger.Table 3-10.1 is an example of a discrete case because it has a small number of observations (output variesfrom zero to eight units). Figure 3-10.3 is an example of a continuous case because it is based on a largenumber of observations. Answer Questions 6–8 based on Figure 3-10.3.Figure 3-10.3A Continuous Example of a Monopoly’s Revenue Curves 80REVENUEElasticUnitary elastic 40InelasticD AR05001,000MRREVENUEQUANTITYTR0500QUANTITY1,0006. Indicate clearly in the top graph of Figure 3-10.3 the elastic, unitary elastic, and inelastic portionsof the D curve. Explain your answer.Based on the total revenue test, we know demand is elastic if total revenue rises when price isreduced. Total revenue does not change if demand is unitary elastic. Demand is inelastic if totalrevenue falls when price is lowered. If the demand curve is linear and downward sloping, thenthe upper half of the demand curve is elastic, the midpoint is unitary elastic, and the lower halfis inelastic.Advanced Placement Economics Microeconomics: Teacher Resource Manual Council for Economic Education, New York, N.Y.CEE-APE MACROSE-12-0101-MITM-Book.indb 29929926/07/12 5:26 PM
3 MicroeconomicsSOLUTIONSACTIVITY 3-10 (CONTINUED)7. Marginal revenue is found using the ratio MR DTR/DQ. This is also the formula for the slope ofthe TR curve. Thus, MR slope of the TR curve.(A) Over what range of output is the slope of the TR curve positive? Over what range of output isthe firm’s MR positive?Over the first 499 units(B) Over what range of output is the firm’s MR negative? Over what range of output is the slopeof the TR curve negative?Over those units from 501 to 1,000(C) Over what range of output is the slope of the TR curve equal to zero? Over what range ofoutput is the firm’s MR equal to zero?At the 500th unit8. What is the maximum dollar value of TR this firm can receive?500 40 20,000.Bonus Question!9. When the Galaxy Firm lowers its price from 60 to 57, the number of units it sells increases from36 to 39. What is the value of MR? How should you interpret this value?As a result of selling three extra units, the firm’s total revenue increases by 63 ( 2,160 to 2,223). Since marginal revenue refers to the extra revenue from one more unit of output, youneed to use the MR formula: MR TR/ Q 63/ 3 units 21. The interpretation of thisMR value is that the firm’s total revenue increases by 21 for each of the three extra units.300CEE-APE MACROSE-12-0101-MITM-Book.indb 300Advanced Placement Economics Microeconomics: Teacher Resource Manual Council for Economic Education, New York, N.Y.26/07/12 5:26 PM
SOLUTIONS3 PartMicroeconomics2ACTIVITY 3-11Profit Maximization by a MonopolyThe profit-maximizing monopolist works with the same key rules as any firm:1. The optimal output level (Q*) is the one where marginal revenue equals marginal cost (MR MC).2. The optimal price (P*) is found on the demand curve at output Q*.3. The firm should shut down if at Q* it finds its total revenue is less than its total variable cost(TR TVC).Because price (P) and MR were equal for a perfectly competitive firm, that firm could also find its Q* bysetting P MC. But that is not the case for a monopoly since P and mr will be different. The monopolistwill find its profit-maximizing output (Q) where MR MC, not where P MC. This activity shows how amonopolist finds the output at which it will maximize its total profit and the price it should charge for thatoutput.Part A: Determining the Optimal Output and Price for a MonopolyTable 3-11.1 provides some revenue, cost, and profit data for a monopoly.1. Complete Table 3-11.1. Enter the MR and MC values at the higher of the two output levels. Forexample, the MR value of 300 is placed at Q 4 rather than at Q 3.Be sure to distinguish between total profit (TP), average profit (AP), and marginal profit (MP):(A) TP TR – TC (Q) (AP)(B) AP AR – ATC TP/Q(C) MP MR – MC DTP/DQTable 3-11.1Revenue, Cost, and Profit Values for a MonopolyQPTR0 1,350 01 1,2002TCTPARATCAPMRMCMP 100– 100–––––– 1,200 900 300 1,200 900 300 1,200 800 400 1,050 2,100 1,600 500 1,050 800 250 900 700 2003 900 2,700 2,100 600 900 700 200 600 500 1004 750 3,000 2,400 600 750 600 150 300 300 05 600 3,000 2,800 200 600 560 40 0 400– 4006 450 2,700 3,600– 900 450 600– 150– 300 800– 1,100Advanced Placement Economics Microeconomics: Teacher Resource Manual Council for Economic Education, New York, N.Y.CEE-APE MACROSE-12-0101-MITM-Book.indb 30130126/07/12 5:26 PM
SOLUTIONS3 MicroeconomicsACTIVITY 3-11 (CONTINUED)2. In Figure 3-11.1, draw the monopolist’s D, AR, MR, ATC, and AVC curves using the data from Table3-11.1. Plot the MR and MC values at the higher of the two output levels rather than at the midpointbetween the two levels. Use dotted lines for the MR and MC curves in your graph. Label each curve.Figure 3-11.1REVENUE, COSTRevenue and Cost Curves of a Monopolist 1,350 1,200 1,050 900 750 600 450 300 150MCATCD AR 0– 150– 300MR01234QUANTITY563. To maximize its total profit, this monopolist should produce 4 units.The first three units have MR MC. The fourth unit has MR MC. Subsequent units haveMR MC and should not be produced.4. What price should the monopolist charge for each of these units?The highest price the firm can charge for four units is 750. This price is found on the D curve.5. What is the total profit this firm will earn? 600 Shade in the total profit area inFigure 3-11.1.The AP for four units is 150: AP AR – ATC 750 – 600.TP (Q)(AP) (4)( 150) 600.Part B: Other Monopoly Examples6. Suppose a monopolist can sell an extra unit of its good at a price of 50 and the MR of that unit is 44. If the MC of producing the extra unit is 46, the firm’s total profit would (increase / decrease)by 2if the firm sells that unit. Should the firm produce this additional unit of output?Explain your answer.The firm should not produce the extra unit because its MR is less than its MC. This unit has amarginal profit of – 2 which means the firm’s total profit would decrease by 2 if it sold thatunit. The firm compares MR to MC, not P to MC, to decide if an extra unit should be produced.302CEE-APE MACROSE-12-0101-MITM-Book.indb 302Advanced Placement Economics Microeconomics: Teacher Resource Manual Council for Economic Education, New York, N.Y.26/07/12 5:26 PM
SOLUTIONS3 MicroeconomicsACTIVITY 3-11 (CONTINUED)7. Figure 3-11.2 shows the MR and MC curves of a monopolist. Economists claim that the firm willmaximize its total profit by producing 800 units where MR MC. Show your understanding ofthis rule by circling the correct answer in each cell of Table 3-11.2.Figure 3-11.2 MC01,200800QUANTITYMRTable 3-11.2The Logic behind the “MR MC” RuleUnits of QFor each extra unit of output in this range:1–799MR is ( / / ) MC.MP is ( / / ) 0.TP will ( rise / fall / not change).800MR is ( / / ) MC.MP is ( / / ) 0.TP will (rise / fall / not change ).801–1200MR is ( / / ) MC.MP is ( / / ) 0.TP will (rise / fall / not change).8. The firm illustrated in Figure 3-11.2 will maximize its total revenue if it produces 1,200 units.So why does it not want to produce those units between 800 and 1,200?Each of the units between 800 and 1200 has MR MC which means the firm’s total profit will bedecreased if these units are produced.9. The monopolist’s profit-maximizing output level will be in the (elastic / unitary elastic / inelastic)range of its demand curve. Explain.The output level where MR MC must be in the elastic range because MC is always a positivevalue, which means MR must also be a positive value. MR is only positive in the elastic range ofthe demand curve.Advanced Placement Economics Microeconomics: Teacher Resource Manual Council for Economic Education, New York, N.Y.CEE-APE MACROSE-12-0101-MITM-Book.indb 30330326/07/12 5:26 PM
3 MicroeconomicsSOLUTIONSACTIVITY 3-11 (CONTINUED)Here’s a more interesting answer to Question 9. Assume the firm is producing an output levelin the inelastic range. If the firm increases its price, three things will happen:(1) Total revenue will increase because an increase in price when demand is inelastic increasestotal revenue.(2) Total cost will decrease because the firm will need fewer resources since it will be sellingfewer units of output because of the higher price.(3) Total profit will increase because total revenue increases and total cost decreases when priceis increased in the inelastic range of the demand curve. [See (1) and (2).]Thus, if the firm is operating in the inelastic range of its demand curve, it should keep increasingits price (and its total profit) until it backs into the elastic range where it eventually hits theoutput level where MR MC.304CEE-APE MACROSE-12-0101-MITM-Book.indb 304Advanced Placement Economics Microeconomics: Teacher Resource Manual Council for Economic Education, New York, N.Y.26/07/12 5:26 PM
SOLUTIONS3 PartMicroeconomics3ACTIVITY 3-12Equilibrium in a Monopolistic MarketPart A: Equilibrium in a Perfectly Competitive MarketConsider Figure 3-12.1, which shows a perfectly competitive market. The market supply curve S isthe horizontal summation of the marginal cost (MC) curves of all the firms in the market. Use Figure3-12.1 to answer the questions that follow the graph.Figure 3-12.1PRICEEquilibrium in a Perfectly Competitive Market 24 22 20 18 16 14 12 10 8 6 4 2AS MCBHDF01234QUANTITY5671. What is the equilibrium quantity in the market?4 units2. What is the equilibrium price? 163. What area of the graph represents consumer surplus in the market? Calculate the dollar value ofconsumer surplus.CS is represented by area ABH. CS (0.5)(4)( 24 – 16) 16.Advanced Placement Economics Microeconomics: Teacher Resource Manual Council for Economic Education, New York, N.Y.CEE-APE MACROSE-12-0101-MITM-Book.indb 30530526/07/12 5:26 PM
SOLUTIONS3 MicroeconomicsACTIVITY 3-12 (CONTINUED)4. What area of the graph represents producer surplus in the market? Calculate the dollar value ofproducer surplus.PS is represented by area BHF. PS (0.5)(4)( 16 – 0) 32.5. What area of the graph represents total surplus (also called social welfare or total welfare)?Calculate the dollar value of total surplus.TS is represented by area ABF. TS CS PS 48.Part B: Equilibrium in a Monopolistic MarketNow consider the same demand and cost curves, but assume the market is a monopoly. Because themonopoly faces the downward sloping market demand curve, it must reduce its price to sell moreoutput, which means price will be greater than marginal revenue (MR). We add the firm’s MR curvebelow its demand curve in Figure 3-12.2, as well as the monopolist’s MC curve. Use Figure 3-12.2 toanswer the questions that follow the graph.Figure 3-12.2REVENUE, COSTEquilibrium in a Monopolistic Market 24 22 20 18 16 14 12 10 8 6 4 2AMCWXBYDF01234QUANTITY567MR6. What output level will the monopolist produce? Why?It will produce 3 units where MR MC.306CEE-APE MACROSE-12-0101-MITM-Book.indb 306Advanced Placement Economics Microeconomics: Teacher Resource Manual Council for Economic Education, New York, N.Y.26/07/12 5:26 PM
3 MicroeconomicsSOLUTIONSACTIVITY 3-12 (CONTINUED)7. What price will the monopolist charge for this output? Why?The monopolist will charge a price of 18 because, based on the demand curve, that is thehighest price consumers will pay for 3 units.8. What area of the graph represents consumer surplus in the market? Calculate the dollar value ofconsumer surplus.CS is represented by area AWX. CS (0.5)(3)( 24 – 18) 9.9. What area of the graph represents producer surplus? Calculate the dollar value ofproducer surplus.PS is represented by area FXWY. To calculate the value of PS, break the FXWY area into atriangle and a rectangle.PS (0.5)(3)( 12 – 0) (3)( 18 – 12) 18 18 36.10. What area of the graph represents total surplus? Calculate the dollar value of total surplus.TS is represented by area AWYF. TS CS PS 45.Part C: Comparing Equilibrium in the Two Markets11. How do the price and output of a monopolist differ from those in the perfectlycompetitive market?The monopolist has a higher price and a lower output than a perfectly competitive market.12. What is the dollar value of the portion of consumer surplus in the competitive market that istransferred to the firm’s producer surplus in the monopoly situation?Note that CS drops from 16 in perfect competition to 9 in monopoly. What happens to the 7reduction in CS when the market becomes a monopoly?(1) Some of it is captured by the monopoly as PS (3)( 18 – 16) 6.(2) The other part is lost because output was reduced by one unit because of the monopoly. Thisis called a deadweight loss (DWL) to society. In this example, the DWL in terms of CS isequal to 1: (0.5)(4 –3)( 18 – 16) 1.13. How does a monopoly affect consumer surplus? Is this good or bad from the perspectiveof consumers?Consumer surplus is reduced when a perfectly competitive market becomes a monopoly. This isbad news for consumers.14. What area of Figure 3-12.2 represents the deadweight loss resulting from the market being amonopoly? Calculate the dollar value of the deadweight loss.Deadweight loss results from the market output being reduced by 1 unit (from 4 units to 3 units)when the market changes from perfect competition to monopoly. The DWL is represented by thearea BWY.DWL (0.50)(1)( 18 – 16) (0.5)(1)( 16 – 12) 1 2 3.The value of DWL also can be found as the reduction in TS when a perfectly competitive marketbecomes a monopoly: TS 48 – 45 3.Advanced Placement Economics Microeconomics: Teacher Resource Manual Council for Economic Education, New York, N.Y.CEE-APE MACROSE-12-0101-MITM-Book.indb 30730726/07/12 5:26 PM
SOLUTIONS3 MicroeconomicsPart 4ACTIVITY 3-13Price DiscriminationWhen producers have market power and sell a good or service that cannot be resold, the possibilityof price discrimination arises. Price discrimination exists when a producer charges different prices todifferent customers for the same item, for reasons other than differences in cost. The seller needs to beable to divide the total market for the good into separate submarkets, each with a different demand forthe good. There also must be no possibility of resale of the product between the submarkets; otherwisethe different submarkets will collapse into a single market.Part A: Regular Monopoly with No Price DiscriminationPat’s Patriotic Tattoos is the only tattoo parlor in town. Pat provides only one tattoo—the Americanflag. There are 10 consumers in town who are willing to buy one tattoo, and they vary in theirwillingness to pay. One consumer is willing to pay 20 for a tattoo, another is willing to pay 18, andso forth, down to the tenth consumer who is willing to pay only 2. Table 3-13.1 shows the demandschedule for Pat’s flag tattoo.1. Complete Table 3-13.1 assuming the firm can only charge one price for its service. (There is noprice discrimination yet.) If Pat wants to sell three units, she will sell all three units at a price of 16, so her TR is 48. Put each MR value at the higher of the two output levels.Table 3-13.1Demand Schedule for Pat’s TattooPriceQuantityTotal revenue (TR)Marginal revenue (MR) 201 20 20 182 36 16 163 48 12 144 56 8 125 60 4 106 60 0 87 56– 4 68 48– 8 49 36– 12 210 20– 16Advanced Placement Economics Microeconomics: Teacher Resource Manual Council for Economic Education, New York, N.Y.CEE-APE MACROSE-12-0101-MITM-Book.indb 30930926/07/12 5:26 PM
SOLUTIONS3 MicroeconomicsACTIVITY 3-13 (CONTINUED)2. What is the total consumer surplus if Pat sells three units at a price of 16?CS is the difference between the highest price a consumer is willing to pay and the price he or sheactually does pay. CS ( 20 – 16) ( 18 – 16) ( 16 – 16) 4 2 0 6.3. What is the total consumer surplus if she sells five units at a price of 12?CS ( 20 – 12) ( 18 – 12) ( 16 – 12) ( 14 – 12) ( 12 – 12) 8 6 4 2 0 20.4. In Figure 3-13.1, draw the demand curve for Pat’s tattoos.Figure 3-13.1PRICEDemand for Pat’s Tattoos 20 18 16 14 12 10 8 6 4 2 0– 2– 4– 6– 8– 10– 12– 14– 16MC ATCDMR01310CEE-APE MACROSE-12-0101-MITM-Book.indb 31023456QUANTITY78910Advanced Placement Economics Microeconomics: Teacher Resource Manual Council for Economic Education, New York, N.Y.26/07/12 5:26 PM
3 MicroeconomicsSOLUTIONSACTIVITY 3-13 (CONTINUED)Part B: Perfect Price Discrimination (Also Called First-Degree PriceDiscrimination)Perfect price discrimination is a monopolist’s dream because it means that the firm can charge eachindividual consumer the highest price that he or she is willing to pay for the firm’s product. As wewill see in this activity, perfect price discrimination eliminates all consumer surplus and increases themonopolist’s total profit above what it would if the firm sold all output at one price. For the questionsin this section, assume that Pat’s average total cost and marginal cost are constant and equal to 8(ATC MC 8).5. In Figure 3-13.1, draw the firm’s ATC MC curves as a horizontal line at 8.6. If this were a perfectly competitive market, the MC curve would represent the supply ofthe product. If Pat produces the perfectly competitive quantity and charges the perfectlycompetitive price:(A) How many tattoos will she supply? Why?She will produce 7 units because that is where P MC. In perfect competition, a firm cansell all it wants at the current price, so P and MR are the same value. Since we assumeMC 8, she will produce 7 units.(B) What price will she charge for each tattoo? Why?Her price will be 8 because she will operate where P MC.(C) What is the amount of consumer surplus? Why?CS ( 20 – 8) ( 18 – 8) ( 16 – 8) ( 14 – 8) ( 12 – 8) ( 10 – 8) ( 8 – 8) 12 10 8 6 4 2 0 42.7. If Pat produces the monopoly quantity and charges the monopoly price:(A) Draw her marginal revenue (MR) curve in Figure 3-13.1.(B) How many tattoos will she supply? Why?She will produce 4 units because that is where MR MC. The monopolist compares MR toMC, not P to MC.(C) What price will she charge for each tattoo? Why?She will charge 14 for each of the 4 units because in the demand schedule we see that is thehighest price consumers will pay for 4 units.(D) What is the amount of consumer surplus? Why?CS ( 20 – 14) ( 18 – 14) ( 16 – 14) ( 14 – 14) 6 4 2 0 12.Advanced Placement Economics Microeconomics: Teacher Resource Manual Council for Economic Education, New York, N.Y.CEE-APE MACROSE-12-0101-MITM-Book.indb 31131126/07/12 5:26 PM
SOLUTIONS3 MicroeconomicsACTIVITY 3-13 (CONTINUED)8. Now assume Pat knows the tastes and preferences of all consumers and the conditions necessaryfor first-degree price discrimination apply.(A) Does the MR curve for the non-discriminating monopolist still apply? Why?No. She is able to charge each consumer a unique price so her demand curve is also hermarginal revenue curve because it shows the increase in her total revenue from each extraunit she sells.(B) How many tattoos will she supply? Why?She will supply 7 tattoos because that is where MR MC. In this case, you also can say thatis where P MC.(C) Complete Table 3-13.2, which shows what price she will charge each individual consumer forher/his tattoo.Table 3-13.2Prices Charged by a Perfectly Discriminating Price 20 18 16 14 12 10 8 6 4 2(D) What is the amount of consumer surplus?There is no consumer surplus because Pat charged each consumer the highest price he or shewas willing to pay for a tattoo.9. In Table 3-13.3, show Pat’s total profit under each of the three market structures. Remember ourassumption that ATC MC 8.Table 3-13.3Profit in Each Market StructureType of marketPat’s total profitPerfect competition 0Regular monopoly 24Perfect price discrimination monopoly 42Perfect competition: TP TR – TC (Q)(P) – (Q)(ATC) (7)( 8) – (7)( 8) 0.Regular monopoly: TP TR – TC (Q)(P) – (Q)(ATC) (4)( 14) – (4)( 8) 24.Discriminating monopoly: TP TR – TC (sum of prices) – (Q)(ATC) ( 20 18 16 14 12 10 8) – (7)( 8) 98 – 56 42.312CEE-APE MACROSE-12-0101-MITM-Book.indb 312Advanced Placement Economics Microeconomics: Teacher Resource Manual Council for Economic Education, New York, N.Y.26/07/12 5:26 PM
3 MicroeconomicsSOLUTIONSACTIVITY 3-13 (CONTINUED)10. How does the total profit of the perfectly discriminating monopolist compare to the consumersurplus that existed in the perfectly competitive market? [See Question 6 (C).] Why?They are equal because the perfectly discriminating monopolist was able to capture all theconsumer surplus from each individual consumer.11. Is the total profit for a regular monopolist different from the total profit of a monopolist that isable to practice perfect price discrimination? Why?Yes. The total profit of a nondiscriminating monopolist is smaller than that of the monopolistwho can practice perfect price discrimination. The latter captures all the consumer surplusbecause it does not have to sell its output at one price.12. Is the output the same for perfect competition and perfect price discrimination? Why?Yes. In these two examples, price is equal to marginal revenue. The perfectly competitive firmcan sell all the output it wants at the market price, so it has P MR. Even though the perfectlydiscriminating monopolist must reduce its price to sell more output, it also has P MR becauseit can charge a unique price to each consumer. Because each firm faces the same MC, the outputin each market structure will be the same where P MC.13. Is there a deadweight loss resulting from the non-discriminating monopolist? What about fromthe monopolist with first-degree price discrimination?There is a deadweight loss from the nondiscriminating monopolist because the output is lessthan the socially optimal output which would occur in the perfectly competitive model. There isno deadweight loss from the discriminating monopolist, however, because the output is the sameas in the perfectly competitive model.14. If an orange sells in Nebraska for 1.00 and the same quality orange sells in Florida for only 0.50,is this clear evidence of price discrimination? Why?No. The price difference could reflect the cost of transporting the orange from Florida (where itwas produced) to Nebraska.15. What is an example of price discrimination that works in favor of students?Students often receive a lower price for movie tickets than do “regular” people. Because it is thesame service at the same cost of production, this is an example of price discrimination.Advanced Placement Economics Microeconomics: Teacher Resource Manual Council for Economic Education, New York, N.Y.CEE-APE MACROSE-12-0101-MITM-Book.indb 31331326/07/12 5:26 PM
SOLUTIONS3 PartMicroeconomics5ACTIVITY 3-14Regulating a MonopolyThere are some firms that have decreasing marginal costs over a large range of output. As long asmarginal cost (MC) is below average total cost (ATC), the firm also will experience decreasing ATC.Such firms are called natural monopolies and are often regulated by a governmental agency that allowsthe firm to be the only provider of the service. This is an attempt to take advantage of the low averagetotal cost of the firm. This activity lets you explore several regulation plans and their effects on thefirm and the market.Suppose you are the manager of a local natural monopoly. Figure 3-14.1 illustrates the revenue and costfunctions of your monopoly.Figure 3-14.1Revenue and Cost Functions 34 32 30 28 26REVENUE, COST 24 22 20 18 16 14 12 10ATC 8MC 6 4 2012345MRQUANTITY (1,000s)678DAdvanced Placement Economics Microeconomics: Teacher Resource Manual Council for Economic Education, New York, N.Y.CEE-APE MACROSE-12-0101-MITM-Book.indb 31531526/07/12 5:26 PM
SOLUTIONS3 MicroeconomicsACTIVITY 3-14 (CONTINUED)1. Complete Table 3-14.1, which examines three possible pricing plans for the monopoly.Table 3-14.1Three Pricing Regulation PlansPrice (P)Totalrevenue(TR)Totalcost(TC)2,000 24 48,000 40,000 4 8,000Fair return pricing5,000 12 60,000 60,000 0 0Socially optimal pricing6,000 8 48,000 60,000– 2– 12,000Output(Q)Unregulated monopolyAverageprofit(AΠ)Totalprofit(TΠ)2. In Figure 3-14.1, shade in the area representing your firm’s total profit under each of the threeregulation plans.For the unregulated monopoly, the shaded rectangle at 2,000 units of output shows a positivetotal profit of 8,000. For the fair return pricing plan, there is no area to shade because the firmbreaks even. Under the socially optimal pricing scheme, the firm’s loss of 12,000 is shown as theshaded rectangle at 6,000 units of output.3. As the manager of this firm, which of the three regulation plans would you prefer? Why?I would prefer the unregulated monopoly plan because it allows my firm to earn positive totalprofit.4. As the manager of the firm, which plan would you totally oppose? Why? What could thegovernment do to make this plan acceptable to you?I would not accept the socially optimal pricing plan because it forces me to accept a price whichis below my average total cost and make a loss. Since the goal of this plan is to have my firmproduce the output level society desires, the government could give me a subsidy to keep my firmfrom making a loss.5. Which plan would society like to see the government agency apply to your firm? Why?Society would prefer the socially optimal output level. That plan has the firm producing theoutput level at which P MC. This is the allocatively optimal output level society desires.316CEE-APE MACROSE-12-0101-MITM-Book.indb 316Advanced Placement Economics Microeconomics: Teacher Resource Manual Council for Economic Education, New York, N.Y.26/07/12 5:26 PM
3 MicroeconomicsSOLUTIONSACTIVITY 3-14 (CONTINUED)6. Under the fair return pricing plan, does your firm earn an economic profit? Does it earn a normalprofit?No, it does not earn an economic profit; it breaks even. Yes, it does earn a normal profit becauseits implicit costs are included in the economic costs.7. Each of the three plans has its own rule for deciding how many units of output your firm willprovide. State those rules.(1) Unregulated monopoly: produce the quantity at which MR MC.(2) Fair return pricing: produce the quantity at which P ATC.(3) Sociall
2. Draw the demand (D), AR, and MR curves in Figure 3-10.1. Plot the MR values at the higher of the two Q levels. SOLUTIONS ACTIVITY 3-10 CEE-APE_MACROSE-12-0101-MITM-Book.indb 297 26/07/12 5:26 PM.