Transcription
U.S. Department of EnergyFreedomCAR and Vehicle Technologies, EE-2G1000 Independence Avenue, S.W.Washington, D.C. 20585-0121FY 200716,000-RPM INTERIOR PERMANENTMAGNET RELUCTANCE MACHINE WITHBRUSHLESS FIELD EXCITATIONPrepared by:Oak Ridge National LaboratoryMitch Olszewski, Program ManagerSubmitted to:Energy Efficiency and Renewable EnergyFreedomCAR and Vehicle TechnologiesVehicle Systems TeamSusan A. Rogers, Technology Development ManagerOctober 2007
ORNL/TM-2007/167Engineering Science and Technology Division16,000-rpm Interior Permanent MagnetReluctance Machine with Brushless FieldExcitationJ. S. HsuT. A. BurressS. T. LeeR. H. WilesC. L. CoomerJ. W. McKeeverD. J. AdamsPublication Date: October 2007Prepared by theOAK RIDGE NATIONAL LABORATORYOak Ridge, Tennessee 37831managed byUT-BATTELLE, LLCfor theU.S. DEPARTMENT OF ENERGYUnder contract DE-AC05-00OR22725
DOCUMENT AVAILABILITYReports produced after January 1 , 1996, are generally available free via the U.S. Department ofEnergy (DOE) Information Bridge:Web site: http://www.osti.gov/bridgeReports produced before January 1 , 1996, may be purchased by members of the public from thefollowing source:National Technical Information Service5285 Port Royal RoadSpringfield, VA 22161Telephone: 703-605-6000 (1-800-553-6847)TDD: 703-487-4639Fax: 703-605-6900E-mail: info@ntis.fedworld.govWeb site: ts are available to DOE employees, DOE contractors, Energy Technology Data Exchange(ETDE) representatives, and International Nuclear Information System (INIS) representativesfrom the following source:Office of Scientific and Technical InformationP.O. Box 62Oak Ridge, TN 37831Telephone: 865-576-8401Fax: 865-576-5728E-mail: reports@osti.govWeb site: http://www.osti.gov/contact.htmlThis report was prepared as an account of work sponsored by an agency ofthe United States Government. Neither the United States government norany agency thereof, nor any of their employees, makes any warranty,express or implied, or assumes any legal liability or responsibility for theaccuracy, completeness, or usefulness of any information, apparatus,product, or process disclosed, or represents that its use would not infringeprivately owned rights. Reference herein to any specific commercial product,process, or service by trade name, trademark, manufacturer, or otherwise,does not necessarily constitute or imply its endorsement, recommendation,or favoring by the United States Government or any agency thereof. Theviews and opinions of authors expressed herein do not necessarily state orreflect those of the United States Government or any agency thereof.
CONTENTSPageLIST OF FIGURESiiiLIST OF TABLESvACRONYMSviINTRODUCTION1PROTOTYPE MOTOR 2AIR GAP FLUX, INDUCTANCE, PERFORMANCE PARAMETER COMPUTATIONS,AND COMPARISONS OF SIMULATION WITH TEST RESULTS . 6MECHANICAL STRESS COMPUTATIONS15BACK-EMF TESTS 17CORE/FRICTION LOSS TESTS 20LOCKED ROTOR TESTS 23PERFORMANCE/EFFICIENCY TESTS .25REWOUND MOTOR TESTS 30BACK-EMF RESULTS31NO-LOAD LOSS DATA32EFFICIENCY MAPPING34VIBRATION ANALYSIS 42CONCLUSIONS43REFERENCES45APPENDIX: ADDITIONAL SECOND SERIES TEST EFFICIENCY MAPS OF16,000-RPM RIPM BFE REWOUND MOTOR46ii
LIST OF 242526272829303132333435363738PageAssembly of ORNL 16,000-rpm motor designLocation of bridge in a rotor punchingFlexibility provided by adjustable field excitationRotor CAD drawing of ORNL’s 16,000-rpm motorWound stator coreRotor punchingRotor core stack and shaftCompleted rotorExcitation coil housingExcitation coil inside the coil housingAir-gap flux density distributions for various field excitationsExpected motor torque vs. load angle at Imax 200 A for different field excitationsSimulated results of a phase back-emf at Iexc 5000 AT and 5000 rpmCalculated back-emf voltages of 16,000-rpm motorInductances vs. current angle at 100 Arms phase currentInductances vs. current valuesSimulated phasor diagram of the simple 6000 rpm RIPM motor with side PMsat 3500 rpm and 233VrmsSimulated phasor diagram of the simple 6000 rpm RIPM motor with side PMsat 3500 rpm and 100 ArmsSaturated inductance values of 16,000-rpm motor vs. current angle at Iph, 100 A rmsSaturated lined-up inductance values of 16,000-rpm motor vs. current valuesSimulated phasor diagram of 16,000-rpm IPM SM at 3,300 rpm, 5 A excitation,and 270 VrmsSimulated phasor diagram of 16,000-rpm IPM SM at 3,300 rpm, 5 A excitation,and 100 A rmsFinite element stress analysis of 16,000-rpm rotorRadial displacement of the 16,000-rpm rotorShear stresses at the support columns of an 0.018-in. thick 16,000-rpm laminate rotorUnloaded phase back-emf baseline waveforms (16.3 Vrms @ 1000 rpm)Unloaded phase back-emf waveforms enhanced with 5 A of field current(38 Vrms @ 1000 rpm)Influence of field current on unloaded back-emf curvesInfluence of field current on unloaded back-emf phase voltageInfluence of field excitation current on torque needed to overcome unloaded core andfriction losses .Influence of field excitation current on unloaded core and friction lossesInfluence of field current on core lossesLocked rotor torque for the RIPM-BFE motorLocked rotor torque with 5A field excitation currentImpact of flux saturation on peak torqueEfficiency contours for the RIPM-BFE motor with no field excitation currentEfficiency contours with 5A field excitation current excluding resistive losses ofthe BFE field coilEfficiency contours including 5A resistive losses of the BFE field 02122232424252626
LIST OF FIGURES 73–74PageBaseline (no field excitation current) efficiency contour map scaled forcomparison with the contour map measured using 5A field excitation currentGreater efficiency plot from efficiency contour maps for 0A and 5A fieldexcitation currents showing how field excitation may be used to improveefficiency contoursRIPM BFE efficiency map with high speed gear ratio of 2.6Baseline (Prius motor) efficiency mapStator before (left) and after (right) rewindingBack-emf voltage vs. speed for both statorsRequired torques for spinning rotor vs. rotor speed at various field currentsSpinning powers vs. rotor speed at different field currentsSpinning losses vs. field current for various rotor speeds. .16,000-rpm RIPM BFE efficiency contours with 5A field without field lossesEfficiency contours using optimal field currents – without field lossesOptimal field currents – without field lossesEfficiency contours for 90% without field losses for all field currentsEfficiency contours with 5A field – including field lossesEfficiency contours using optimal field current – including field lossesOptimal field currents when including field lossesEfficiency contours for 90% with field losses for all field currentsTorque-current ratio for tests 1 and 2 at 5AProjected efficiency contours using optimal field current with field losses includedRIPM BFE efficiency map with field losses and gear ratio of 2.6Projected RIPM BFE efficiency map with field losses and gear ratio of 2.6Vibration analysis obtained from testEfficiency maps without field losses includedEfficiency maps without field losses includedEfficiency maps without field losses includedEfficiency maps without field losses includedEfficiency maps with field losses includedEfficiency maps with field losses includedEfficiency maps with field losses includedEfficiency maps with field losses 41424647484949505152
LIST OF TABLESTable1234567PageComparison of dimensions of the ORNL 16,000-rpm motor and the baseline motorComparison between simulated results and test results of the simple 6000 rpmRIPM motor at 3500 rpm and 233 VrmsComparison between simulated results and test results of the simple 6000 rpmRIPM motor at 3500 rpm and 102 ArmsComparison between simulated results and test results of 16,000-rpm motorat given speed and input voltageComparison between simulated results and test results of 16,000-rpm motorat given speed and input currentTest field adjustment ratiosDecrease of efficiency (%) form test 1 to test 2V2101114141940
PexcPMPMSMq-axisrmsRIPMrpmSMV excthree dimensionalamperes of currentalternate currentampere turnsbrushless field excitationdirect-axisdirect currentelectromotive forcekilo-pounds per square inchfield coil excitation in ampere turnsmaximum stator winding current amplitudeinterior permanent magnetNewton meterOak Ridge National Laboratorypower loss of excitation coilspermanent magnetpermanent magnet synchronous motorquadrature-axisroot mean squarereluctance interior permanent magnet motorrevolutions per minutesynchronous motordc voltage fed to excitation coilsvi
INTRODUCTIONThe reluctance interior permanent magnet (RIPM) motor is currently used by many leading automanufacturers for hybrid vehicles. The power density for this type of motor is high compared with that ofinduction motors and switched reluctance motors. The primary drawback of the RIPM motor is thepermanent magnet (PM) because during high-speed operation, the fixed PM produces a huge backelectromotive force (emf) that must be reduced before the current will pass through the stator windings.This reduction in back-emf is accomplished with a significant direct-axis (d-axis) demagnetizationcurrent, which opposes the PM’s flux to reduce the flux seen by the stator wires. This may lower thepower factor and efficiency of the motor and raise the requirement on the alternate current (ac) powersupply; consequently, bigger inverter switching components, thicker motor winding conductors, andheavier cables are required. The direct current (dc) link capacitor is also affected when it mustaccommodate heavier harmonic currents. It is commonly agreed that, for synchronous machines, thepower factor can be optimized by varying the field excitation to minimize the current. The field producedby the PM is fixed and cannot be adjusted. What can be adjusted is reactive current to the d-axis of thestator winding, which consumes reactive power but does not always help to improve the power factor.The objective of this project is to avoid the primary drawbacks of the RIPM motor by introducingbrushless field excitation (BFE). This offers both high torque per ampere (A) per core length at low speedby using flux, which is enhanced by increasing current to a fixed excitation coil, and flux, which isweakened at high speed by reducing current to the excitation coil. If field weakening is used, the dc/dcboost converter used in a conventional RIPM motor may be eliminated to reduce system costs. However,BFE supports a drive system with a dc/dc boost converter, because it can further extend the constantpower speed range of the drive system and adjust the field for power factor and efficiency gains.Lower core losses at low torque regions, especially at high speeds, are attained by reducing the fieldexcitation. Safety and reliability are increased by weakening the field when a winding short-circuit faultoccurs, preventing damage to the motor.For a high-speed motor operating at 16,000-revolutions per minute (rpm), mechanical stress is achallenge. Bridges that link the rotor punching segments together must be thickened for mechanicalintegrity; consequently, increased rotor flux leakage significantly lowers motor performance. This barriercan be overcome by BFE to ensure sufficient rotor flux when needed.1
PROTOTYPE MOTORA CAD assembly cross section of the Oak Ridge National Laboratory (ORNL) 16,000-rpm motor designis shown in Fig. 1.Fig. 1. Assembly of ORNL 16,000-rpm motor design.Table 1 compares the dimensions of the ORNL 16,000-rpm motor with those of the Toyota/Prius motor[1,2] that was selected as a base line motor. The masses and sizes derived from this table provide a basisfor a cost comparison. The extra excitation coils and cores of the ORNL motor are made of copper wiresand mild steel, respectively. Cost savings can be realized by having a shorter stator core (1.88 inches vs.3.3 inches) as well as shorter stator windings. The cost of the 5 A maximum low current control of thefield excitation is minimal because of the low current component requirements. This design approachenables better motor performance as well as system cost savings. Additionally, if used in a vehiclearchitecture having a boost converter, the output of this motor design can be further increased.Table 1. Comparison of dimensions of the ORNL 16,000-rpm motor and the baseline motorPriusORNLSpeed6000 rpm16,000 rpmStator Lam. OD10.6”sameRotor OD6.375”sameCore length3.3”1.88”Bearing to Bearing outer face7.75”7.45”Magnet Weight lbs2.752.57Estimated field adj. rationone2.5Rating33/50 kWsameBoost converteryesNoHigh speed core losshighlow2
The design itself calls for the thickness of the rotor punching bridges (Fig. 2) to be increased to satisfy themechanical stress requirements at high speeds. More flux produced by the PMs can leak through thesethicker bridges, causing an air-gap flux density reduction for no excitation coil current when comparedwith similar interior PM (IPM) machines.Fig. 2. Location of bridge in a rotor punching.The need for power factor adjustment and low core losses across a wide range of speeds was alsoaddressed by designing into the motor a field adjustment ratio of 2.5. With this ratio, the 16,000-rpmmotor with BFE provides flexibility for a drive system design to meet field strength requirements thatvary at different loads and speeds. In general, the BFE approach can provide field enhancement andweakening for strong or weak PMs, as indicated in Fig. 3.Strong PM / field weakeningWeak PM / field enhancementFig. 3. Flexibility provided by adjustable field excitation.As a result, this motor may be intentionally designed for low air-gap flux density at high speeds with nofield excitation current applied. This solves the problem of high core loss experienced by existingcommercial high PM flux density, high speed motors, which are plagued with both high core and highd-axis current losses generated during conventional field weakening. Figure 4 uses CAD drawings toillustrate the rotor punching, the locations of PMs, and the completed rotor.3
Rotor Core Punching StackCompleted RotorPM ArrangementFig. 4. Rotor CAD drawing of ORNL’s 16,000-rpm motor.Figures 5 through 10 are photographs of actual hardware showing the wound stator core, a stack of rotorpunchings, a rotor core stack and shaft, a completed rotor, excitation coil housing, and an excitation coilinside the coil housing of the prototype motor.Fig. 5. Wound stator core.Fig. 6. Rotor punching.4
Fig. 7. Rotor core stack and shaft.Fig. 8. Completed rotor.Fig. 9. Excitation coil housing.Fig. 10. Excitation coil inside the coil housing.In order to have a stronger forward torque at the expense of a weaker backward torque, the rotor surface ismade asymmetrical with respect to the pole center creating the saw-tooth appearance shown in Figs. 6 and7.The mass and volume of the prototype motor can be further reduced by redesigning the interface betweenthe excitation coils and the motor housing. This improvement will reduce the cost to manufacture themotor by using less material and by eliminating some machining steps. This prototype motor was used toprove the brushless excitation concept, it has not yet been optimized.5
AIR GAP FLUX, INDUCTANCE, PERFORMANCE PARAMETER COMPUTATIONS,AND COMPARISONS OF SIMULATION WITH TEST RESULTSFigure 11 shows the calculated air-gap flux density distributions at various excitation levels. The fieldexcitation, Iexc, is the product of current flowing through the excitation coil and the 865 turns in the fieldcoil. The excitation current, Iexc, can be calculated by dividing the ampere-turns (AT) by the number ofturns in the field coil. The air-gap flux density is adjusted by varying the field excitation current. Whenhigh torque is required, the air-gap flux density is enhanced by increasing Iexc. When low torque and highefficiency are required, Iexc is reduced to zero.21.510.50 -0.5-1lexc 1000 AT,lexc 2000 AT,lexc 3000 AT,lexc 4000 AT,lexc 5000 AT,-1.5-2-2.5Bg1 0.5598 TBg1 0 8688 TBg1 1 0313TBg1 1.0588 TBg1 1.0615 TJRotor Angle (Electrical degree)Fig. 11. Air-gap flux density distributions for various field excitations.Figure 12 shows the expected 16,000-rpm motor torque versus load angle at the maximum stator windingcurrent amplitude, Imax 200A, for different field excitations. Greater excitation produces stronger motortorque.6
20015010050- texc 5000 AT, Trrax 158 27 Nm- texc 4000 AT, Trrax 146 49 Nm- texc 3000 AT, Trrax 130.09 Nm- texc 2000 AT, Trrax 107 13 Nm0- texc 1000 AT, Trrax 82 78 Nm- texc 0 AT, Tmax 68.60 Nm-5090105120135150165180Load Angle [Electrical degree]Fig. 12. Expected motor torque vs. load angle at Imax 200A for different field excitations.Figure 13 is the simulation results of an expected phase back-emf voltage waveform for 5000AT fieldexcitation at 5000 rpm. This waveform is calculated from the time derivative of flux linkage at one of thephase conductors. The corresponding fundamental component is also shown.Fig. 13. Simulation results of a voltage phase back-emf at Iexc 5000 AT and 5000 rpm.7
Figure 14 shows the 16,000-rpm motor’s expected back-emf voltage. The calculated root mean square(rms) voltages from the fundamental values are plotted versus speed for different field currents.Fig. 14. Calculated back-emf voltages of 16,000-rpm motor.In addition to the three-dimensional (3-D) finite-element simulations the parameters for the equivalentlumped circuit are computed. Magnetic saturation in high power density motors is high; consequently,the linear assumption for the d-axis and quadrature-axis (q-axis) inductance can no longer be applied.Finite element flux plotting is used to obtain the magnetic flux linkages for the inductance calculationswhen there is nonlinear magnetic saturation.In order to establish a reliable computational method for the 3-D motor design, the inductance, andperformance computations for a relatively simple 6000 rpm RIPM motor with side PMs was firstinvestigated. For simplification, the no-load back-emf is used instead of the saturated back-emf values inthe sample calculations. Figure 15 shows the inductances versus current angle at 100 Arms phase current.Figure 16 illustrates the direct and quadrature inductances versus direct and quadrature current values.8
3.532.521.5Ld with magnetic s aturation1Lq with magnetic s aturation0.5H—Ld without magnetic s aturationX L q without magnetic s aturation090120150180Current Angle* [deg]* Id Iph,max cosβ and Iq Iph,max sinβ, where β is the current angle. When the current angle is 90 ,Id 0 and Iq Iph,max. When the current angle is 180 , Id -Iph,max and Iq 0.Fig. 15. Inductances vs. current angle at 100 Arms phase current.32.5 -21.5 -1Ld @ lq 0A0.5Lq @ Id 0A0306090Id, Iq [A]Fig. 16. Inductances vs. current values.9120150
The performance of the simple 6000 rpm RIPM motor with side PMs was calculated with the inductancevalues shown in Figs. 15 and 16 at 3498 rpm and an input voltage of 233.22 Vrms. The comparisonbetween the simulated and test results are listed in Table 2. It should be pointed out that the power factorfor the simulation is based on the fundamental values and the test power factor is the total power factor,which includes all the harmonics. The simulation may be improved by using the saturated back-emfvalues instead of the no-load back-emf values.Table 2. Comparison between simulated results and test results for thesimple 6000 rpm RIPM motor at 3500 rpm and 233 Vrms.UnitTorqueSpeedPmotorBack-emf* (rms)Input Voltage (rms)Input Current (rms)Power FactorPinputEfficiencyNewton meter(Nm)rpmkWVVAkW%SimulationResultsTest * Back-emf voltage is from no-load simulation and test.Figure 17 shows the simulated vector diagram of the simple 6000-rpm RIPM motor at 3500 rpm and233 Vrms.Fig. 17. Simulated phasor diagram of the simple 6000 rpm RIPM motorwith side PMs at 3500 rpm and 233 Vrms.10
The simulation of the simple 6000 rpm RIPM motor with side PMs was again calculated with theinductance values shown in Figs. 15 and 16 at 3498 rpm, but this time at an input current of 102.22 Arms.The comparison between the simulated and test results are listed in Table 3. Once again the power factorfor the simulation is based on the fundamental values and the test power factor is the total power factorthat includes all the voltage and current harmonics. In the future, the simulation may be improved byusing the saturated back-emf values instead of the no-load back-emf values.Table 3. Comparison between simulated results and test results of thesimple 6000 rpm RIPM motor at 3500 rpm and 102 orBack-emf*Input Voltage(rms)Input Current (rms)Power FactorPinputEfficiencyTest 40.97 Back-emf voltage is from no-load simulation and test.Figure 18 shows the simulated phasor diagram of the simple 6000 rpm RIPM motor with side PMs at3500 rpm and 100 Arms.Fig. 18. Simulated phasor diagram of the simple 6000 rpm RIPM motorwith side PMs at 3500 rpm and 100 Arms.11
After the initial saturated inductances and lump circuit performance calculations were completed for thesimple 6,000 rpm RIPM motor with side PMs, calculations for the 16,000-rpm RIPM-BFE machine wereconducted.Figure 19 shows the 16,000-rpm motor’s saturated inductance values versus the current ang le at Iph 100Arms. Fig ure 20 shows the saturated inductance values for other winding current values when thecurrent axis lines up with either d- or q-axis.43532.5 21.510.5090120150180Current Angle [deg]Fig. 19. Saturated inductance values of the 16,000-rpm motor vs. current angle at Iph 100Arms.43.5— — Lq @ Id 0A32.521.5 -—"*—10.50306090120150Id, Iq [A]Fig. 20. Saturated lined-up inductance values of 16,000-rpm motor vs. current values.12
The performance of the 16,000-rpm RIPM-BFE motor with 5A in the BFE coil was calculated with thesaturated inductances shown in Figs. 21 and 22 and an input voltage of 270.01 Vrms. The comparisonbetween the simulated and test results appear in Table 4 followed by a phasor diagram. Correspondingly,the performance of the same motor was calculated for an input current of 100 Arms with the comparison inTable 5 followed by a phasor diagram. Use of the saturated inductances appears to have improved theagreement.Fig. 21. Simulated phasor diagram of 16,000-rpm IPM synchronous motor (SM) at3,300 rpm, 5 A excitation, and 270 Vrms.Fig. 22. Simulated phasor diagram of 16,000-rpm IPM SM at 3,300 rpm, 5A excitation, and 100 Arms.13
Table 4. Comparison between simulated results and test results of 16,000-rpm motorat given speed and input 39.77kWPmotorBack-emf*121.32VInput Voltage (rms)270.01VInput Current (rms)A112.10Power Factor0.5045.40kWPinputEfficiency87.60% Back-emf voltage is from no-load simulation and test.UnitTest 70.94Table 5. Comparison between simulated results and test results of 16,000-rpm motorat given speed and input 35.33kWPmotor121.32Back-emf*(rms)VInput Voltage (rms)248.22VInput Current (rms)A102.39Power Factor0.5340.41kWPinputEfficiency87.43% Back-emf voltage is from no-load simulation and test.Unit14Test 40.94
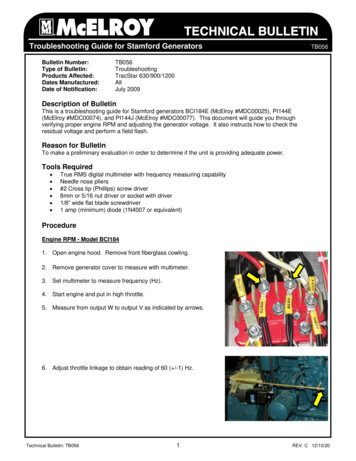
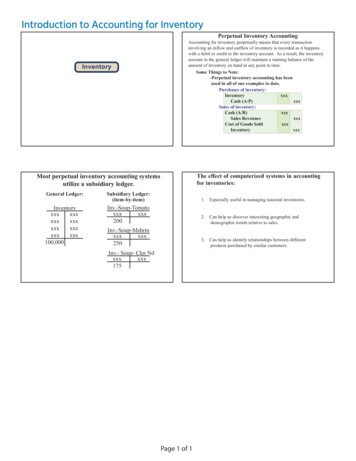
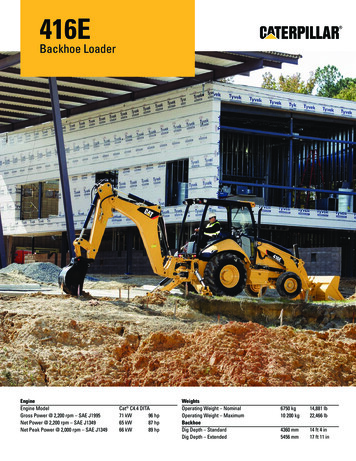
MECHANICAL STRESS COMPUTATIONSAs an important part of the analysis, the high-speed rotor's rigid-body critical speed and maximum 3-Dstress at 16,000 rpm were calculated. A transfer matrix approach was used to estimate the critical speed,which is the speed at which imbalance forces resonate with the shaft’s natural frequency between itssupport bearings, causing large amplitude vibrations that can destroy the system. The 3-D software usedfor stress analyses were ALGOR, ANSYS, and Pro/E Mechanica. The analytical results are as follows. The estimated rigid-body critical speed of the 16,000-rpm rotor was 24,960 rpm. The ratio of24,960/16,000 provides a safety factor of 1.56. Stress analyses of the rotor requires proper contact surfaces between the magnets and theirencapsulating core:— Figure 23(a) shows the solid models with only the PMs in the upper right quadrant having properlydefined contact surfaces, which allow them to move in their slots. The movement of the magnetsis indicated by the gaps, which appear between the PM and rotor punching.— Figure 23(b) shows that when contact surfaces are incorrectly bonded to the core lamination, thestresses become unrealistically low. The values 22 kilo-pounds per square inch (ksi), 11 ksi,11 ksi, and 21 ksi are low when compared with the values 52 ksi, 56 ksi, 49 ksi, and 50 ksigenerated by the magnets that can move freely in their slots. This demonstrates the importance ofhaving the contact surfaces properly defined.(a)(b)Fig. 23. Finite element stress analysis of 16,000-rpm rotor.Figure 24 is an ALGOR deflection analysis showing that the radial displacement at the rim of a0.018-inch thick 16,000-rpm laminate rotor ranges from 0.00066 in. to 0.00124 in., which is less than theair gap of 0.029 in. between the rotor and stator. Figure 25 shows that, although acceptable, the shearstresses at the support columns of a 0.018-in. thick 16,000-rpm laminate rotor are slightly larger becausethe side of the small magnet nearest to the radial magnet is not along a radius.15
Fig. 24. Radial displacement of the 16,000-rpm rotor.Fig. 25. Shear stresses at the support columns of a 0.018-in.thick 16,000-rpm laminate rotor.16
BACK-EMF TESTSThe Solectria motor was used to drive the RIPM-BFE machine up to 5000 rpm to measure the opencircuit voltages generated in the stator windings by the PM’s using the Yokogawa PZ4000. The line-toneutral rms voltages were measured as a function of speed for field excitation currents ranging from -5Ato 5A in 1A increments. The baseline waveforms obtained at 1000 rpm with no field excitation andenhanced by a field excitation of 5A are shown in Figs. 26 and 27, respectively.Fig. 26. Unloaded phase back-emf baseline waveforms (16.3 Vrms @ 1000 rpm).Fig. 27. Unloaded phase back-emf waveforms enhanced with 5 A of field current (38 Vrms @ 1000 rpm).The scale in volts per division has doubled from Fig. 26 to Fig. 27. There is a noticeable difference notonly between the amplitudes of the waveforms, but also in the shape of the waveforms. A betterrepresentation of the effects of the field excitation current on the magnitude of the back-emf is portrayedin Fig. 28. The measured rms voltage is plotted versus speed for each field current.17
200.0180.0-* -5 Amps -4 Amps-3 Amps« -2 Amps* - 1 Amps 0 Amps- i — 1 Amps— 2 Amps— 3 Amps4 Amps5 003000400050006000Speed (RPM)Fig. 28. Influence of field current on unloaded back-emf curves.The slope of the -5A to 0A back-emf curves are relatively constant. The slope increases dramatically asthe excitation field is increased from 0–3A, yet saturation appears to begin at 3A. The top two linesindicate a large amount of saturation between 4A and 5A of field excitation current as evidenced by avery small change in slope.The effects of saturation of the BFE flux are more obvious if the back-emf is plotted versus fieldexcitation current for each speed as shown in Fig. 29. This plot substantiates that magnetic saturationbecomes effective above 2A where the influence of increased field excitation current on the back-emfcurve is significantly reduced. Once again the strange behavior of the results for negative field excitationcurrents is also portrayed.Fig. 29. Influence of field current on unloaded back-emf phase voltage.18
From the measured back-emf per phase versus the field current shown in Fig. 29, the test field adjustmentratio, which is the phase back-emf at a given field excitation current divided by the back-emf at 0A fieldexcitation current, can be obtained. These test field adjustment ratios are listed in Table 6. The ratioindicates how the field excitation current can change the phase back-emf.Table 6. Test field adjustment ratiosSpeed[rpm]500030001000Field current[A]025025025Phase emf[Vrms]80152191509211618303919Field adj. ratio1.01.92.41.01.82.31.01.72.2
CORE/FRICTION LOSS TESTSThese tests were conducted by using the Solectria motor to spin the RIPM-BFE motor while measuringthe load created at the RIPM-BFE shaft due to friction and core effects with the motor leads disconnectedand floating. Similar to the back-emf tests, these tests were conducted as the field current was variedfrom -5A to 5A in 1A increments. The results are shown in Fig. 30 with the measured torque plottedversus speed for the various field currents. Torque saturation with respect to speed appears for negativeexcitation field currents at high speeds, as indicated by leveling of the dotted lines in Fig.30. In Fig. 31,the torque data was converted to power, which is the product of torque and speed, and plotted versusspeed. These plots show that the losses increase whether the ex
The reluctance interior permanent magnet (RIPM) motor is currently used by many leading auto manufacturers for hybrid vehicles. The power density for this type of motor is high compared with that of induction motors