Transcription
Incorporating Climate Changeinto the Design ofWater Crossing StructuresA WDFW project conducted with funding support fromthe North Pacific Landscape Conservation CooperativeFINAL PROJECT REPORTSeptember 2016George Wilhere (WDFW)Jane Atha (WDFW)Timothy Quinn (WDFW)Lynn Helbrecht (WDFW)Ingrid Tohver (Climate Impacts Group)Washington Department of Fish and WildlifeHabitat Program – Science Division
Incorporating Climate Change into theDesign of Water Crossing StructuresTable of Contents1.Introduction .1The Importance of Water Crossing Structures . 1Culvert Design . 2Hydraulic Geometry . 4Climate Change Impacts on Stream Hydrology and Channel Morphology . 5Addressing Climate Change Impacts to Fish Passage . 72.Methods Projecting Future Bankfull Flows and Bankfull Widths .8Global Climate Models . 9VIC Hydrologic Model . 11Projected Streamflow Analyses . 13Estimating Change in Bankfull Width. 15100-Year Flood Analysis . 153.Results . 17Projected Changes in Bankfull Width . 17100-Flood Analysis . 214.Information for Culvert Design . 24Uncertainty . 24Case Study: Climate-adapted Culverts for the Chehalis River Basin. 315.6.Discussion . 37Future Work . 39Dissemination of Project Results . 39Updating Climate Science . 40Understanding the Consequences of Undersized Culverts . 40Improving Information on risk and cost . 407.8.Acknowledgements . 40References . 41
FiguresFigure 1. The width of no-slope and stream simulation culverts compared to bankfull width. . 3Figure 2. Causal relationships between culverts and climate change. . 8Figure 3. Major steps in the modelling process. . 9Figure 4. Future greenhouse gas scenarios . 11Figure 5. Components and modelled processes of the VIC hydrologic model. . 12Figure 6. Validation of VIC streamflow estimates using ratio of 100-year flood and mean annual flood. 13Figure 7. Three major ecoregion divisions used to assign bankfull flow recurrence intervals. 16Figure 8. Frequency distribution of grid cells for mean projected percent change in bankfull width). . 19Figure 9. Coefficient of variation for 10 bankfull width projections versus mean percent change inbankfull width for each of the 5270 grid cells. . 19Figure 10. The mean (of 10 models) projected percent change in bankfull width . 20Figure 11. Projected future mean % change in 100-year flood volume (Q100) relative to historical Q100 . 21Figure 12. Frequency distribution of grid cells for mean projected percent change in 100-year flood. 22Figure 13. The distribution of grid cells within ecoregions for ratio of percent change in 100-year floodvolume to percent change in bankfull width . 23Figure 14. The ratio of percent change in 100-year flood volume to percent change in bankfull width . 23Figure 15. The range of percent change in bankfull width for each grid cell . 27Figure 16. Number of models projecting an increase in bankfull width for each grid cell . 28Figure 17. Distribution of projected percent change in bankfull width (BFW) between historical and2040s time periods . 29Figure 18. Graphical depiction of relative risk. . 30Figure 19. Grid cells that lie within the actionable risk zone of Figure 18. . . 30Figure 20. Grid cells on nonfederal lands where a culvert poses an actionable risk. 31Figure 21. The Polson Camp Road Culvert Project on Big Creek, a tributary of the Humptulips River. . 33Figure 22. Distribution of projected future percent change in bankfull widths and future bankfull widthfor the Polson Camp Road Culvert Project on Big Creek (see Figure 21). . 35Figure 23. Distribution of projected percent change in 100-year flood volume relative to the historicalestimate for the Polson Camp Road Culvert Project on Big Creek (see Figure 21). . 35Figure 24. Smallest current bankfull width (in feet) where a bridge (rather than a culvert) may bewarranted based on mean projected percent change in bankfull width . 36Figure 25. Percent increase in culvert cost as a function of percent increase in culvert width. . 39TablesTable 1.Table 2.Table 3.Table 4.Ten global climate models used to project stream flows in the Pacific Northwest. . 10Downstream hydraulic geometry parameters from Castro and Jackson (2001). . 16Mean percent change from historical to future projections of bankfull discharge 18Example of how relative risk could be mapped for policy decisions. . 31
1. IntroductionThe following report describes a study, conducted by the Washington Department of Fish and Wildlife(WDFW or the Department) from 2014 to 2016, to explore how climate-related changes to streamchannel morphology could be incorporated into the design of water crossing structures such as culverts.The Department received a grant from the North Pacific Landscape Conservation Cooperative (NPLCC)that provided essential support for this work. This report fulfills a required deliverable of that grant.Section 1 explains the importance of properly designed water crossing structures for fish movement, thebasics of geomorphic culvert design, basics of channel hydraulic geometry, the projected impacts offuture climate change on stream hydrology and channel morphology in Washington, and themotivations for this project. Section 2 describes our methods for translating climate projections to thekey geomorphological parameter used in culvert design and permitting, and Section 3 presents theresults and findings from our work. Section 4 explains how the information we have produced can beused for culvert design. Section 5 is a discussion of our results and the challenges of incorporating ourprojections into culvert design. Finally, Section 6 describes additional work needed to better addressthe information needs of policy makers, managers, and engineers.The Importance of Water Crossing StructuresWashington State regulations require that water crossing structures (i.e., culverts and bridges) “allowfish to move freely through them at all flows when fish are expected to move” (WAC 220-660-190).Furthermore, Washington State law (RCW 77.57) grants WDFW authority to regulate the construction ofwater crossing structures along with other activities that use, obstruct, divert, or change the naturalflow or bed of state waters. The Department issues approximately 400 permits per year related to watercrossings throughout the state (WDFW 2006). In addition, the Department designs or co-designs watercrossing structures throughout the state and provides technical guidance (Barnard et al. 2013) thatexplains how to design water crossing structures that will comply with current regulations.Road crossings at rivers or streams are widely known to create barriers to fish movement when they areimproperly designed or constructed (Price et al. 2010, Chelgren and Dunham 2015). Improperlydesigned or constructed culverts can become barriers for various reasons, including sedimentaggradation at a culvert’s inlet, stream bed scour at a culvert’s outlet, and high flow velocity in theculvert . The consequences to fish populations associated with barriers at road crossings include the lossof habitat for various life history stages (Beechie et al. 2006, Sheer and Steel 2006), genetic isolation(Reiman and Dunham 2000, Wofford et al. 2005, Neville et al. 2009), inaccessibility to refuge habitatsduring disturbance events or warm water episodes (Lamberti et al. 1991, Reeves et al. 1995, Dunham etal. 1997), and local extirpation (Winston et al. 1991, Kruse et al. 2001).The importance of restoring fish passage at water crossings in Washington has been highlighted withWashington’s Salmon Recovery Act of 1998, the Forests and Fish Report (DNR 1999), and United Statesv. Washington (2013), which is also known as the “Culvert Case.” All regional recovery plans for salmon(Oncorhynchus spp.) in Washington State emphasize the importance of restoring fish passage at streamcrossings for recovering federally-listed threatened salmon populations. Likewise, under the Forests andFish rules (WAC 222-24-051), large forest landowners are required to repair or replace all fish passagebarriers before November 2016. Between 1999 and 2008, forest landowners replaced 3,500 fishpassage barrier culverts with fish-passable structures, reportedly opening nearly 3,700 miles of fishhabitat in Washington streams (Governor’s Salmon Recovery Office 2008). In the Culvert Case,Washington State government was ordered by a federal court to replace all state-owned culvertslocated on the Olympic Peninsula, in the Puget Sound Basin, or in the Chehalis River Basin that block 2001
meters or more of salmon habitat (United States v. Washington 2013). About 1000 culverts areestimated to fit that description, and their replacement with culverts that pass fish is estimated to costabout 2.45 billion (Lovaas 2013).Recent studies describe the magnitude of the challenge presented by culverts both in terms of the sheernumber of structures across the landscape and in the proportion of those culverts that may be barriersto fish passage. The U.S. Forest Service and Bureau of Land Management reported that over half of theestimated 10,215 culverts that exist on fish-bearing streams in federal lands of Washington and Oregonmay be fish passage barriers (GAO 2001). The Washington State Department of Transportation (WSDOT)is responsible for about 3,000 culverts on fish-bearing streams, of which approximately 60% arecomplete or partial barriers (WDFW 2009). In 2015, WDFW estimated that there may be as many as35,000 culverts blocking or impeding fish passage statewide (D. Price, WDFW, personal communication).The goal of WDFW, WSDOT, other state agencies, and tribes is to restore access to existing freshwaterhabitat by replacing all impassable culverts. Hence, over the coming decades thousands of culvertsmust be replaced. The cost to replace 35,000 culverts could be as much as 60 to 86 billion.Culvert DesignWDFW has published water crossing design guidelines (i.e., Barnard et al. 2013) that are used by stateand local governments throughout the United States (NAACC 2016, USACE 2016). In fact, WDFW isnationally recognized as the inventor of the stream simulation culvert design (Cenderelli et al. 2011).WDFW believes that a geomorphic approach to culvert design is the best way to enable upstream anddownstream movements of fish and other stream-associated species through culverts (Barnard et al2013). A geomorphic culvert design seeks to maintain continuity of channel structure and compositionby conveying water, sediment, and wood in the same way as the surrounding stream reach (Barnard etal 2013, Cenderelli et al. 2011). In contrast, the once prevalent hydraulic culvert design viewed culvertsas simply pipes for conveying water, and fish passage was accommodated by limiting flow velocitieswithin the pipe. Culverts based on a geomorphic design: i) are large enough to accommodate regularflood flows, ii) contain deformable channel beds with a shape and sediments resembling the up- anddownstream channel, and iii) have channel beds similar in slope to the longitudinal profile of thechannel reach.The Department currently endorses two types of culvert design: no-slope and stream simulation (Figure1). The no-slope culvert is intended to be installed at 0% slope in small, low gradient streams ( 10 ftbankfull width, 3% slope). No-slope culverts are countersunk1 to a minimum depth of 20% of theculvert height and the width of the no-slope culvert at the streambed elevation is at least bankfullwidth. Stream simulation culverts are intended for higher gradients and streams up to 15 ft bankfullwidth, and are sized to be 1.2 bankfull width 2 ft wide at the streambed and countersunk 30 to 50%.Stream simulation design is based on the assumption that if fish can migrate through the naturalchannel, then fish should also be able to migrate through an artificial channel that closely simulates thecomposition, structure, and fluvial processes of the natural channel. No-slope design is a less expensiveoption that is appropriate only for lower energy stream reaches. For streams with bankfull width widerthan 15 ft, WDFW recommends a bridge (Barnard et al. 2013).A geomorphic approach to culvert design is based on readily-measured traits of the natural channel:width, slope, floodplain utilization, and sediment sizes. Bankfull width is by far the most importantparameter (Barnard et al. 2013, p. 13). Bankfull width is measured perpendicular to the channel1A countersunk culvert is installed with its bottom (i.e., invert) located below the existing channel elevation andthen filled with streambed material.2
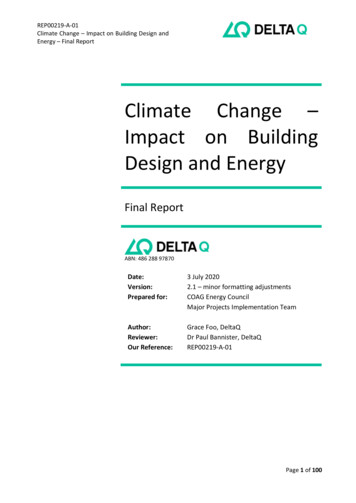
thalweg2 at the elevation of the bankfull flow, that is, the elevation where water just begins to leave thechannel and overtop its banks. Bankfull width is associated with bankfull flow, which is the dischargethat transports the majority of suspended and bedload sediment in many rivers and typically recursevery 1 to 2 years (Simon et al. 2004). Bankfull flow has been interpreted as the most important flowmagnitude for controlling channel form (Wolman and Miller 1960, Dunne and Leopold 1978). Bymeasuring the channel width, one takes a measure of the watershed its area, mean annual rainfall,vegetation, and parent geology (Barnard et al. 2013, p.9).Culverts wider than bankfull width, such as stream simulation culverts, should accommodate typicalloads of sediment and woody material during most peak flow events (Gillespie et al. 2014). WDFWrecommends the construction of a “design channel” i.e., a channel created within a culvert with a width,depth, gradient, and sediment sizes similar to those of the adjacent up- and downstream channels. Adesign channel should maintain geomorphic and hydrologic continuity for unimpeded movement of fishand other aquatic organisms (Gillespie et al. 2014). This continuity is important not just for flood flows,but also for low flows. If a culvert is constructed with a low-flow channel, or thalweg, that has gradientand sediment sizes similar to the channel outside of the pipe, then continuity should persist through theculvert for all seasons of the year.Figure 1. The width of no-slope and stream simulation culverts compared to bankfull width. Bankfull width isthe key parameter in culvert design (Barnard et al. 2013).The 100-year flood volume can also be an important parameter for culvert design. WDFW’s watercrossing design guidelines (Barnard et al 2013) state:“The standard of practice for culvert design dictates that the structure remains safe andserviceable up to a given design flood. WAC 220-110-070(3)(d) requires that the culvert mustmaintain structural integrity to the 100-year peak flow with consideration of debris likely to beencountered. Generally, sizing culverts using the no-slope method provides adequate2Thalweg is the lowest point along the length of a stream bed. It is usually the deepest and fastest part of a streamchannel.3
conveyance for the 100-year peak flow. This does not absolve the designer of responsibility todetermine that this is actually true.”3The stream simulation culvert design is also assumed to provide adequate conveyance for the 100-yearpeak flow, and therefore, potential impacts of 100-year flood events are typically not an importantdesign consideration. However, if a culvert is in a narrowly confined channel, likely to transport largewoody debris, or downstream of high run-off areas (e.g., urban areas), then the designer should assessthe potential impacts of 100-year flood events.Hydraulic GeometryThe conceptual basis for using bankfull width measurements in culvert design is rooted in relationshipsbetween stream discharge and channel form. The widely used concept of downstream hydraulicgeometry (DHG) asserts that as stream discharge increases in the downstream direction, channel widthand depth increase to accommodate the larger discharge (Leopold and Maddock 1953). Theserelationships are predicated on the mass continuity equation for stream flow:Q w d v(1)where w is channel width, d is mean channel depth, v is flow velocity, and Q is discharge. Leopold andMaddock (1953) proposed that:w aQb(2)d cQfv kQm(3)(4)where a, c, k, b, f, and m are parameters derived from empirical data. Based on the continuity equation,the product of a, c, and k is one, and the sum of b, f, and m is one. Changes in w, d, and v at a crosssection reflect a channel’s shape, slope, erodibility, roughness of the wetted perimeter, and sedimenttransport from upstream sources. The implication is that a channel adjusts its width, depth, and velocityto achieve an approximate equilibrium between its cross-sectional shape and the water and sediment itmust transport (Singh 2003). The complexities of hydraulic geometry at one cross section limitgeneralizations, however, the width exponent primarily reflects the channel geometry and boundarycomposition. The depth and velocity exponents reflect the cross-sectional shape in addition to hydraulicresistance and sediment transport, which tend to be more variable than channel form parameters(Knighton 1998). Downstream hydraulic relationships connect the spatial variations in average channelgeometry to the bankfull discharge.The hydraulic geometry equation relating flow velocity to bankfull discharge does not explicitly describea particular aspect of the channel geometry, but is necessary to satisfy the continuity equation whenusing this empirical approach (Eaton 2013). It should be noted that conventional downstream hydraulicgeometry obscures a key element of channel form – slope; however, slope is accounted for separately inculvert design.For purposes of culvert design, we focus on channel width. Castro and Jackson (2001) found strongrelationship between bankfull discharge and both channel width and depth in the Pacific Northwest (r2 0.81 and 0.76, respectively). However, channel depth is strongly linked to upstream sediment supply,3As of November 2014, WAC 220-110-070(3)(d) no longer exists, and maintaining structural integrity of culvertsduring 100-flood flows is no longer a requirement under law. However, the prudent engineer checks to seewhether there is adequate clearance for the 100-year flood flow.4
and therefore, uncertainty regarding future changes in upstream sediment supply precludes using theDHG depth relationship (equation 3) for predicting future channel depth adjustments due to climatechange. The exponent b is almost always greater than f, because channels become wider more rapidlythan they become deeper as bankfull discharge increases (Wohl 2014). Channel widening requires onlybank erosion, and the resulting sediment may be stored in the channel. Channel deepening occursthrough bed erosion, and bed erosion requires the bed sediment – which is often coarser than banksediment – to both entrain (be lifted) and move downstream.Channel w/d ratios can reflect base level constraints (e.g., substrate), as well as changes or relativeconsistency in sediment inputs. As banks become more erodible, the ratio of channel width to meanflow depth (w/d) increases. In channels with bedrock, cohesive sediment on the banks, or effective bankstabilization from vegetation, the w/d ratios are lower. Forested channels tend to be wider thanchannels with grassy banks, however, to what degree varies (Allmendinger et al. 2005). An increase insediment yield is likely to cause bed aggradation and channel widening, leading to a larger w/d ratio. Adecrease in sediment yield can cause bed erosion, but is also likely to result in bank erosion, leading toless predictable changes in w/d ratio (Wohl 2014).The current no-slope culvert design that requires at least 20% countersink can accomodate smallincreases in channel depth, and stream simulation culverts (countersunk 30 to 50%) can accommodatesomewhat larger increases in channel depth. Uncertainty regarding future sediment dynamics anddeepening of channels could be accomodated by deeper countersinking.Climate Change Impacts on Stream Hydrology and Channel MorphologyOver the course of the 21st century, climate change is projected to cause major changes in hydrologyacross Washington. Scientists have already detected negative trends in glacier volume and snowpack(Granshaw and Fountain 2006, Sitts et al. 2010, Stoelinga et al. 2010) and in earlier peak streamflow inmany rivers (Stewart et al. 2005). These trends are expected to continue in the future, along withincreasing flood magnitudes, declining summer minimum flows, and rising stream temperatures (Elsneret al. 2010, Mantua et al. 2010).In the Pacific Northwest, two factors interact to cause increases in flood magnitudes: decreasingprecipitation stored as snowpack and intensifying heavy rain events. Declining winter snowaccumulation contributes to increased winter flood magnitudes via both an increase in the proportion ofprecipitation that falls as rain and a larger effective basin area as the snowline rises. A further driver ofincreasing flood magnitudes is the projected intensification of extreme precipitation events (Salathè etal. 2014, Warner et al 2015). Although seasonal and annual total precipitation is not projected tochange substantially, climate models consistently project a substantial increase in the intensity of heavyrain events. Specifically, the heaviest 24-hour rain events in the Pacific Northwest (so-called“Atmospheric River” events, Neiman et al. 2011) will intensify by 22%, on average, by the 2080s (i.e.,2070-2099 relative to 1970-1999) (Mauger et al. 2015, Warner et al 2015).In Washington State, projected changes in future annual total precipitation are generally smallcompared to year-to-year fluctuations in seasonal and annual rainfall. Nonetheless, hydrologicalprojections for the mid to late 21st century show a shift in flood frequencies that results in larger peakflows at all recurrence intervals4, e.g., 2-year, 5-year, 10 year, etc. (Salathè et al. 2014). Furthermore,peak streamflow is projected to occur 4 to 9 weeks earlier by the 2080s (i.e., 2070-2099 relative to 19704Flood recurrence interval (or return period) is the average time in years between flood events equal to orgreater than a specified magnitude. A 50-year flood, for example, is one which will, on the average, be equaled orexceeded once in any 50-year period. It is usually estimated from long-term historical records of stream flow.5
1999) in four central Puget Sound watersheds (Sultan, Cedar, Green, Tolt) and in the Yakima basin(Elsner et al. 2010). Changes are projected to be most pronounced in middle elevation basins, where asubstantial proportion of the basin is located near the snowline (i.e., the so-called “mixed rain andsnow” zone). In these watersheds, warming will cause more precipitation to fall as rain instead of snow,which will decrease snow accumulation, hasten melt, and increase runoff (Hamlet and Lettenmaier2007).Changes in stream flow are expected to alter sediment transport and channel morphology, however,published research analyzing the potential impact of future climate change on fluvial processes islimited. Researchers have conducted case studies on historical sediment and climate data records toinfer future changes to erosion and deposition in rivers (Magilligan et al. 1998, Gomez et al. 2009);however, this approach has limitations because future climate may change stream hydrology inunprecedented ways.Modelling results from Coultard et al. (2012) for a rain-dominated river basin in the United Kingdomproject a 100% increase in mean sediment yield between their baseline 30-year period and a future 30year period (2070-2099) under a high emissions scenario. In addition, they found that the sedimentincrease was amplified relative to changes in stream discharge. Lane et al. (2007) also project increasedsediment yields relative to discharge increases in upland rivers in the United Kingdom.Praskievicz (2015) modeled the effects of future climate on geomorphic responses in three snowdominated river basins of Idaho and eastern Washington. The results from the first site on the TucannonRiver indicate that net sediment deposition is likely to occur, with increasing mid-channel bars. Thesecond study site on the Coeur d’Alene River undergoes net erosion, and results for the third site projectminimal changes on the Red River. These varying results indicate that the impacts of climate onsediment movement also depend on local context, i.e., how reach traits, such as substrate or riparianvegetation affect a stream channel’s morphological stability or lateral mobility. Modelling by Lee et al(2016) for the upper Skagit River Basin project average annual sediment loading to increase from 2.3 to5.8 teragrams ( 149%) per year by the 2080s, and peak winter sediment loading to increase by 335% bythe 2080s, in response to increasing winter flows.If the projected increases in future sediment yield occur in Washington, then sediment aggradationcould create wider and shallower channels that require wider culverts to accommodate depositionalfeatures like point bars and taller culverts to accommodate increased flood water surface elevations.Culverts that create constrictions due to sediment and debris accumulation may cause further bedaggradation upstream and/or constrict flood waters, such that sediment scouring creates plunge poolsthat form barriers to fish. The results from these various studies strongly suggest a need to designculverts from a geomorphic perspective, to accommodate changing sediment dynamics caused byclimate change. Changes in sediment dynamics due to climate change are outside the scope of thisproject.Many factors across a wide range of spatial scales affect the geomorphic response of river systems toclimate change (Praskievicz 2015). Some of these factors include basin-scale geology and land-use,riparian or hillslope vegetation, sediment supply from hillslopes, channel form, and natural andanthropogenic disturbances. Consequently, models for predicting future climate change impacts onstream geomophology have high levels of parameter and structural uncertainty at multiple stages ofanalysis. The nonlinear nature and variability of these complex systems indicates the need forprobabilistic approaches using multiple climate models and simul
basics of geomorphic culvert design, basics of channel hydraulic geometry, the projected impacts of future climate change on stream hydrology and channel morphology in Washington, and the motiva