Transcription
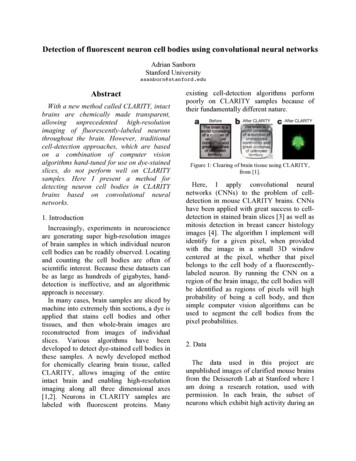
Detection of fluorescent neuron cell bodies using convolutional neural networksAdrian SanbornStanford Universityasanborn@stanford.eduAbstractWith a new method called CLARITY, intactbrains are chemically made transparent,allowing unprecedented high-resolutionimaging of fluorescently-labeled neuronsthroughout the brain. However, traditionalcell-detection approaches, which are basedon a combination of computer visionalgorithms hand-tuned for use on dye-stainedslices, do not perform well on CLARITYsamples. Here I present a method fordetecting neuron cell bodies in CLARITYbrains based on convolutional neuralnetworks.1. IntroductionIncreasingly, experiments in neuroscienceare generating super high-resolution imagesof brain samples in which individual neuroncell bodies can be readily observed. Locatingand counting the cell bodies are often ofscientific interest. Because these datasets canbe as large as hundreds of gigabytes, handdetection is ineffective, and an algorithmicapproach is necessary.In many cases, brain samples are sliced bymachine into extremely thin sections, a dye isapplied that stains cell bodies and othertissues, and then whole-brain images arereconstructed from images of individualslices. Various algorithms have beendeveloped to detect dye-stained cell bodies inthese samples. A newly developed methodfor chemically clearing brain tissue, calledCLARITY, allows imaging of the entireintact brain and enabling high-resolutionimaging along all three dimensional axes[1,2]. Neurons in CLARITY samples arelabeled with fluorescent proteins. Manyexisting cell-detection algorithms performpoorly on CLARITY samples because oftheir fundamentally different nature.Figure 1: Clearing of brain tissue using CLARITY,from [1].Here, I apply convolutional neuralnetworks (CNNs) to the problem of celldetection in mouse CLARITY brains. CNNshave been applied with great success to celldetection in stained brain slices [3] as well asmitosis detection in breast cancer histologyimages [4]. The algorithm I implement willidentify for a given pixel, when providedwith the image in a small 3D windowcentered at the pixel, whether that pixelbelongs to the cell body of a fluorescentlylabeled neuron. By running the CNN on aregion of the brain image, the cell bodies willbe identified as regions of pixels will highprobability of being a cell body, and thensimple computer vision algorithms can beused to segment the cell bodies from thepixel probabilities.2. DataThe data used in this project areunpublished images of clarified mouse brainsfrom the Deisseroth Lab at Stanford where Iam doing a research rotation, used withpermission. In each brain, the subset ofneurons which exhibit high activity during an
experimentally chosen window of about 4hours are labeled fluorescently. Brains fromthree different conditions have beencollected: a pleasure condition, in which themouse was administered cocaine during thetime window; a fear condition, in which themouse was repeatedly shocked during thetime window; and a control. A robust celldetection algorithm is needed in order torigorously compare the distribution of activecells between different brain regions in thethree conditions.Samples were imaged using a light-fieldmicroscope and have a resolution of 0.585µmin the x- and y-directions and 5µm in the zdirection. The whole brain at nativeresolution is 500GB. Labels are cell-filling,including both the cell body and projections,so in many areas the cell bodies areinterspersed with a dense backgroundnetwork of projections.Because the dataset is so large, it isimpractical to train and test on the entirevolume. Instead, I have chosen a few regionsof interest (ROIs) which are representative ofthe types of structures seen throughout thebrain. In this report, I focus on one particularROI for my testing and training. Thedimensions of this ROI were 1577 x 1577 x41 pixels, or 923µm x 923µm x 205µm.3. CNN modelThe CNN model will take as input a smallwindow of data and will output a predictionof the probability that the center pixel isinside a cell body. Because of this, inputwindows should have an odd number ofpixels along each dimension.After some experimentation with the modelarchitecture (described below), the finallearned model was of the ConvMPConvConvMPFCFCVolume93x93 pixels(91x91)P x 16 filters(89x89)P x 16F(44x44)P x 16F(42x42)P x 16F(40x40)P x 16F(20x20)P x 16F100 neurons2 neurons (output)Filter3x3x33x3x32x2x23x3x33x3x32x2x2-To store the parameters and volume, thisarchitecture would require just a fewmegabytes. Thus, a batch of 500 trainingexamples, with miscellaneous memoryincluded, which would reliably fit on theGPUs of most clusters.4. TrainingFigure 2: An example slice of a CLARITY imagefrom the main training and testing volume.The first step in the training process is togenerate training data. To this end, Iexamined the ROI using ImageJ, and usedthe point-picker tool to select centroids ofcells. This process was somewhat trickybecause ImageJ only allows individual zstacks to be viewed one at a time, so I had toscroll between z-stacks both to find the centerpoint in the z-direction as well as to confirmthat I had not already marked the cell inanother z-stack. In this manner, I labeled 267
cell centroids.Next, I wrote a series of python scripts toextract training examples to feed into theCNN, based on the labeled cell centroids.This was necessary because the CNN istrained on windows centered around testpixels and does not learn the cell centroidsdirectly.The first part of the script loaded the ROIvolume and the labeled cell centroids. It alsodisplayed the centroid labels on the volumeas well as windows around each cell centroidto confirm that the label and volume wereindexed correctly. This turned out to involveunexpected, counterintuitive errors wherebycentroid labels were accurate when displayedon the full volume but images of individualcells were not extracted properly. Aftersignificant confusion, I realized the problemarose from the fact that matplotlib plots thex-direction on the horizontal axis whenplotting data but the y-direction on thehorizontal axis when displaying images usingimshow; thus, the problem was fixed byswapping the x- and y-axes whenappropriate.Figure 3: Example cell centroidsThe second part of the script selected pixelsthat would be the center pixel of true andfalse training examples. Positive pixelexamples were chosen as all pixels within adistance R from a hand-labeled centroid. Rwas measured in microns, and the data wasrescaled from pixels into microns based onthe microscope resolution. After choosing thepositive pixels, I displayed the windowaround a small subset of the pixels in order toverify that the examples were visuallycorrect. The value of R was chosen so that allpositive pixel examples were unambiguouslyin cell centroids by visual inspection. In thismanner, around 200,000 positive pixelexamples were chose from this ROI.Next, the same number of negative pixelexamples was chosen. The first iteration ofthe script chose negative training pixelsrandomly and eliminated pixels that werewithin a distance R from a cell centroid.However, I later noticed that some negativeexamples were actually still inside cells(since R was a conservative estimate), andthere were few training examples near cellsto teach the CNN about where cellboundaries were. Thus, in the seconditeration of the script, 20% of negative pixelexamples were chosen to be between adistance of R0 12µm and R1 16µm awayfrom cell centroids. These were chosenuniformly at random, using a sphericalcoordinates representation. The remainingnegative pixel examples were chosenrandomly and at least a distance of R0 awayfrom cell centroids.The third part of the script generated thetraining examples from the pixel exampleschosen above. First, the examples weremerged and shuffled. Next, the exampleswere divided into train, test, and validationsets in the ratio of 5 to 1 to 1. Finally, foreach pixel, the 93 pixel by 93 pixel windowscentered at that pixel was extracted from theCLARITY volume, the mean value of thevolume was subtracted from the window, andit was saved to a numpy array. However, as I
5. TrainingFigure 4: Sample positive (green, above) and negative(red, below) pixel examples.scaled up my training data over the course ofthe project, I began having problems savingthis much data and then loading it all intoGPU memory. To fix this problem, I adjustedmy script to just output the (shuffled andsplit) pixel example locations, and thewindows were extracted by the CNN trainingprogram instead. This did not significantlyslow down the training process.My implementation of the CNN trainingcode was based on online tutorialsimplementing a “LeNet” CNN, available atwww.deeplearning.net. The example code iswritten in python and makes extensive use ofthe python package Theano to constructsymbolic formulas. I modified this codesubstantially in order to implement the CNNarchitecture described above. While use ofCaffe was highly recommended, it did notsupport convolution over 3D volumes.Because I wanted to be able to eventuallyextend the CNN cell detection code over thefull 3D volume, I developed my code usingTheano directly. As a result, a majorchallenge involved with the project includedunderstanding and learning to use Theano;howeve, I learned a lot about the innerworkings of CNN implementation.The convolutional, max pool, and fullyconnected layers were implemented in astandard way based on the LeNet tutorial.Non-linearities used the ReLU function.Values for the weights were initialized as aninput parameter scaled by the square root ofthe “fan in” plus the “fan out” of the neuron.The final layer used logistic regression tomap the 100 neurons of the first fullyconnected layer to the pixel probability ofbeing a centroid.Training was performed on an AmazonWeb Services G2 GPU box, using a highperformance NVIDIA GPU with 1,536 coresand 4GB of memory. This accelerationallowed much quicker exploration ofparameterspace.Aftersomeexperimentation, a learning rate of 0.0001and a weight scaling factor of 1.0 waschosen. (Initial attempts to train the CNNproduced no improvements in performance.After some investigation, it turned out thiswas due to the initial weights being too smallfor the fully connected layers.)
Once the parameters were chosen within anappropriate range, the CNN tended to learnvery quickly, achieving an error of 4% (onthe pixel-wise classification) before evengetting through the whole training dataset.This suggests that the input examples arerelatively simple. After training for 10epochs, a best performance error of 2.05%was achieved on the pixel-wise classification.6. Cell DetectionOnce a CNN has been trained, it is used asa sort of pre-processing step for celldetection. That is, the learned model isapplied to the whole volume to map it to avolume of pixel probabilities, enhancing theintra-cell pixels and eliminating distractionsfrom the non-cell pixels. However, I quicklylearned that mapping the learned model overthe entire volume in a batched but naïve waywas computationally infeasible, even on aGPU. Mapping of a single pixel could take anoticeable fraction of a second, but themapping has to be applied to the 100,000,000pixels in the chosen volume, and ultimatelyon billions of pixels in the full CLARITYvolume.In order to accelerate the pixel probabilitymapping, I implemented the trick ization”,wherefullyconnected layers for the mapping process aretransformed into convolutional layers withfilter size equal to the input of the fullyconnected layer of the original trained model.By doing so, the entire ROI volume can befed into the convolutionalized model at once,and the output is all the pixel probabilitieswith resolution 4x less in both dimensions.(A factor of 4 less in this case, since the twomax-pool layers scaled down by a factor of 2each.) Thus, mapping the entire volume canbe reduced to 16 mappings of theFigure 5: Learned mapping and cell detection. (Top)original image; (middle) CNN-mapped pixelprobabilities; (bottom) detected cells. Cell centroidsare labeled by red dots in all images.
convolutionalized model, stitched backtogether. Using this optimization, mapping ofthe 1577 pixel by 1577 pixel by 41 pixelvolumewhichwaspreviouslycomputationally intractable now requiresabout 10 minutes on a GPU.To detect cells, I wrote a python scriptusing simple computer vision methods. First,I apply a binary threshold using Otsu’smethod. Next, I perform a binary opening inorder to reduce the miscellaneous isolatedpixels. Third, I cluster pixels by connectedcomponents and remove any clusters whichare too small to be cell bodies; in this case,clusters with volume smaller than a cell withradius 5µm. Finally, the centroids arecomputed as the center of mass of theremaining connected components.7. EvaluationThe problem of cell detection in CLARITYvolumes is somewhat distinct from the imageclassification problem addressed in classbecause the pure percentage performance ofthe CNN is not the main metric for quality.Instead, the performance that matters is theprecision and recall on the cell detection.To evaluate the CNN and the cell detectioncode, I trained a model using positive andnegative training examples drawn from justthe right half of the ROI, and then evaluatedprecision and recall based on the hand labelsin the left half of the ROI. Precision andrecall was found to be 91% and 91%respectively, which is on par with the bestcell-detection algorithms for calcium imagingof cell bodies.8. Reflections and future workIn this project, I have trained aconvolutional neural network to learn pixel-wise probabilities of cell bodies in aCLARITY volume. After applying thelearned probability mapping, cell detectioncan be achieved using simple computervision approaches. As a proof-of-principle, Idemonstrated that this approach can achievegreater than 90% precision and recall on oneregion of the CLARITY volume.However, this is just the first step towardsachieving a robust, CNN-based cell detectionpipeline that can be run on whole CLARITYvolumes. Two next steps are immediatelyapparent. First, it is important to test theapproach at different regions in theCLARITY volume, as detection in someregions can be more difficult than others. Asa preliminary test, I ran the CNN mappinglearned from the first ROI on several otherROIs; without having seen those regions, itperformed quite well on a few, but also didnot perform well on a few. Adding trainingexamples from those new ROI would fix thisproblem. Second, the CNN model shouldultimately be modified to run over 3D inputvolumes. Cell detection will be much morerobust with use of 3D volumes; for example,images containing thick fiber bundles mightfool a 2D mapping if the fibers runperpendicular to the z-plane, but these fiberswill be easily distinguished from cells with a3D mapping.This approach to cell detection has twoparticular advantages for CLARITY data.First, a number of factors influence how cellslook across different regions of the sameCLARITY volume, including imagingclarity, types of neurons, and expression ofthe fluorescent protein gene. Because theCNN-based mapping learns from the inputtraining examples, it should be able learn acommon mapping across the whole diversityof cell morphologies. Second, most standardcell-detection algorithms perform thedetection in 2D slices. This fails to use thedistinct advantages of the CLARITY imagingmethod, which provides z-resolution around
10 times higher than other imagingapproaches.The primary disadvantage to using a CNNbased detection approach is that thealgorithm development process is slow. Inparticular, training examples must be chosenmeticulously for each region, ensuring thatall types of cell pixels and non-cell pixels arechosen. Because there is no quick interfacebetween volume images and the trainingexample extraction code, this process canoften require a lot of time. (On the otherhand, since the CNN learned extremelyquickly based on just a few examples, it maybe sufficient to input fewer examples butfrom much more diverse regions.) Secondly,applying the learned CNN mapping is quitecomputationally intensive, even using a GPU.To map an entire 500GB CLARITY brainusing the learned CNN, a parallelizedapproach over AWS GPU boxes would likelybe required.References[1] Chung K. et al. “Structural and molecularinterrogation of intact biological systems.”Nature. Advance Online Publication 2013Apr 10.[2] Tomer R, Ye L, Hsueh B, DeisserothK. “Advanced CLARITY for rapid and highresolution imaging of intact tissues.” NatureProtocols. June 2014.[3] Yongsoo K. et al. “Maping social behaviorinduced brain activation at cellular resolutionin the mouse.” Cell Reports. 2015 January13.[4] Ciresan D.C., Giusti A., Gambardella L.M.,Schmidhuber J. “Mitosis detection in breastcancer histology images with deep neuralnetworks.” MICCAI 2013.
throughout the brain. However, traditional cell-detection approaches, which are based on a combination of computer vision algorithms hand-tuned for use on dye-stained slices, do not perform well on CLARITY samples. Here I present a method for detecting neuron ce