Transcription
InterTubes: A Study of the US Long-haul Fiber-opticInfrastructureRamakrishnan Durairajan† , Paul Barford†* , Joel Sommers , Walter Willinger‡{rkrish,pb}@cs.wisc.edu, jsommers@colgate.edu, wwillinger@niksun.com† Universityof Wisconsin - Madison* comScore,Inc. ColgateUniversity‡ NIKSUN,Inc.ABSTRACT1The complexity and enormous costs of installing new longhaul fiber-optic infrastructure has led to a significant amountof infrastructure sharing in previously installed conduits. Inthis paper, we study the characteristics and implications ofinfrastructure sharing by analyzing the long-haul fiber-opticnetwork in the US.We start by using fiber maps provided by tier-1 ISPs andmajor cable providers to construct a map of the long-haul USfiber-optic infrastructure. We also rely on previously underutilized data sources in the form of public records from federal, state, and municipal agencies to improve the fidelityof our map. We quantify the resulting map’s1 connectivitycharacteristics and confirm a clear correspondence betweenlong-haul fiber-optic, roadway, and railway infrastructures.Next, we examine the prevalence of high-risk links by mapping end-to-end paths resulting from large-scale traceroutecampaigns onto our fiber-optic infrastructure map. We showhow both risk and latency (i.e., propagation delay) can bereduced by deploying new links along previously unusedtransportation corridors and rights-of-way. In particular, focusing on a subset of high-risk links is sufficient to improvethe overall robustness of the network to failures. Finally, wediscuss the implications of our findings on issues related toperformance, net neutrality, and policy decision-making.The desire to tackle the many challenges posed by noveldesigns, technologies and applications such as data centers, cloud services, software-defined networking (SDN),network functions virtualization (NFV), mobile communication and the Internet-of-Things (IoT) has fueled many ofthe recent research efforts in networking. The excitementsurrounding the future envisioned by such new architecturaldesigns, services, and applications is understandable, bothfrom a research and industry perspective. At the same time,it is either taken for granted or implicitly assumed that thephysical infrastructure of tomorrow’s Internet will have thecapacity, performance, and resilience required to developand support ever more bandwidth-hungry, delay-intolerant,or QoS-sensitive services and applications. In fact, despitesome 20 years of research efforts that have focused on understanding aspects of the Internet’s infrastructure such as itsrouter-level topology or the graph structure resulting fromits inter-connected Autonomous Systems (AS), very littleis known about today’s physical Internet where individualcomponents such as cell towers, routers or switches, andfiber-optic cables are concrete entities with well-defined geographic locations (see, e.g., [2, 36, 83]). This general lackof a basic understanding of the physical Internet is exemplified by the much-ridiculed metaphor used in 2006 by thelate U.S. Senator Ted Stevens (R-Alaska) who referred to theInternet as “a series of tubes" [65].2The focus of this paper is the physical Internet. In particular, we are concerned with the physical aspects of the wiredInternet, ignoring entirely the wireless access portion of theInternet as well as satellite or any other form of wirelesscommunication. Moreover, we are exclusively interested inthe long-haul fiber-optic portion of the wired Internet in theUS. The detailed metro-level fiber maps (with corresponding colocation and data center facilities) and internationalundersea cable maps (with corresponding landing stations)are only accounted for to the extent necessary. In contrastto short-haul fiber routes that are specifically built for shortdistance use and purpose (e.g., to add or drop off networkservices in many different places within metro-sized areas),CCS Concepts Networks Physical links; Physical topologies;KeywordsLong-haul fiber map; shared risk; risk mitigation1 The constructed long-haul map along with datasets areopenly available to the community through the U.S. DHSPREDICT portal (www.predict.org).Permission to make digital or hard copies of all or part of this work for personalor classroom use is granted without fee provided that copies are not made ordistributed for profit or commercial advantage and that copies bear this noticeand the full citation on the first page. Copyrights for components of this workowned by others than ACM must be honored. Abstracting with credit is permitted. To copy otherwise, or republish, to post on servers or to redistribute tolists, requires prior specific permission and/or a fee. Request permissions frompermissions@acm.org.Introduction2 Ironically, this infamous metaphor turns out to be not allthat far-fetched when it comes to describing the portion ofthe physical Internet considered in this paper.SIGCOMM ’15, August 17–21, 2015, London, United Kingdom 2015 ACM. ISBN 978-1-4503-3542-3/15/08. . . 15.00DOI: http://dx.doi.org/10.1145/2785956.2787499565
propagation delay along deployed fiber routes. By framingthe issues as appropriately formulated optimization problems, we show that both robustness and performance canbe improved by deploying new fiber routes in just a fewstrategically-chosen areas along previously unused transportation corridors and ROW, and we quantify the achievable improvements in terms of reduced risk (i.e., less infrastructure sharing) and decreased propagation delay (i.e.,faster Internet [100]). As actionable items, these technicalsolutions often conflict with currently-discussed legislationthat favors policies such as “dig once", “joint trenching" or“shadow conduits" due to the substantial savings that resultwhen fiber builds involve multiple prospective providers orare coordinated with other infrastructure projects (i.e., utilities) targeting the same ROW [7]. In particular, we discussour technical solutions in view of the current net neutrality debate concerning the treatment of broadband Internetproviders as telecommunications services under Title II. Weargue that the current debate would benefit from a quantitative assessment of the unavoidable trade-offs that have tobe made between the substantial cost savings enjoyed by future Title II regulated service providers (due to their ensuing rights to gain access to existing essential infrastructureowned primarily by utilities) and an increasingly vulnerablenational long-haul fiber-optic infrastructure (due to legislation that implicitly reduced overall resilience by explicitlyenabling increased infrastructure sharing).long-haul fiber routes (including ultra long-haul routes) typically run between major city pairs and allow for minimaluse of repeaters.With the US long-haul fiber-optic network being the mainfocal point of our work, the first contribution of this paperconsists of constructing a reproducible map of this basiccomponent of the physical Internet infrastructure. To thatend, we rely on publicly available fiber maps provided bymany of the tier-1 ISPs and major cable providers. Whilesome of these maps include the precise geographic locationsof all the long-haul routes deployed or used by the corresponding networks, other maps lack such detailed information. For the latter, we make extensive use of previously neglected or under-utilized data sources in the form of publicrecords from federal, state, or municipal agencies or documentation generated by commercial entities (e.g., commercial fiber map providers [34], utility rights-of-way (ROW)information, environmental impact statements, fiber sharingarrangements by the different states’ DOTs). When combined, the information available in these records is often sufficient to reverse-engineer the geography of the actual longhaul fiber routes of those networks that have decided againstpublishing their fiber maps. We study the resulting map’sdiverse connectivity characteristics and quantify the ways inwhich the observed long-haul fiber-optic connectivity is consistent with existing transportation (e.g., roadway and railway) infrastructure. We note that our work can be repeatedby anyone for every other region of the world assuming similar source materials.A striking characteristic of the constructed US long-haulfiber-optic network is a significant amount of observed infrastructure sharing. A qualitative assessment of the risk inherent in this observed sharing of the US long-haul fiberoptic infrastructure forms the second contribution of this paper. Such infrastructure sharing is the result of a commonpractice among many of the existing service providers to deploy their fiber in jointly-used and previously installed conduits and is dictated by simple economics—substantial costsavings as compared to deploying fiber in newly constructedconduits. By considering different metrics for measuring therisks associated with infrastructure sharing, we examine thepresence of high-risk links in the existing long-haul infrastructure, both from a connectivity and usage perspective. Inthe process, we follow prior work [99] and use the popularity of a route on the Internet as an informative proxy forthe volume of traffic that route carries. End-to-end paths derived from large-scale traceroute campaigns are overlaid onthe actual long-haul fiber-optic routes traversed by the corresponding traceroute probes. The resulting first-of-its-kindmap enables the identification of those components of thelong-haul fiber-optic infrastructure which experience highlevels of infrastructure sharing as well as high volumes oftraffic.The third and final contribution of our work is a detailed analysis of how to improve the existing long-haulfiber-optic infrastructure in the US so as to increase its resilience to failures of individual links or entire shared conduits, or to achieve better performance in terms of reduced2Mapping Core Long-haul InfrastructureIn this section we describe the process by which we construct a map of the Internet’s long-haul fiber infrastructurein the continental United States. While many dynamic aspects of the Internet’s topology have been examined in priorwork, the underlying long-haul fiber paths that make up theInternet are, by definition, static3 , and it is this fixed infrastructure which we seek to identify.Our high-level definition of a long-haul link4 is one thatconnects major city-pairs. In order to be consistent whenprocessing existing map data, however, we use the following concrete definition. We define a long-haul link as onethat spans at least 30 miles, or that connects population centers of at least 100,000 people, or that is shared by at least 2providers. These numbers are not proscriptive, rather theyemerged through an iterative process of refining our basemap (details below).The steps we take in the mapping process are as follows:(1) we create an initial map by using publicly available fibermaps from tier-1 ISPs and major cable providers which contain explicit geocoded information about long-haul link locations; (2) we validate these link locations and infer whetherfiber conduits are shared by using a variety of public records3 More precisely, installed conduits rarely become defunct,and deploying new conduits takes considerable time.4 In the rest of the paper, we will use the terms “link"and “conduit" interchangeably—a “tube" or trench speciallybuilt to house the fiber of potentially multiple providers.566
documents such as utility right-of-way information; (3) weadd links from publicly available ISP fiber maps (both tier1 and major providers) which have geographic informationabout link endpoints, but which do not have explicit information about geographic pathways of fiber links; and (4)we again employ a variety of public records to infer thegeographic locations of this latter set of links added to themap. Below, we describe this process in detail, providingexamples to illustrate how we employ different informationsources.2.1websites, and that these documents can be used to validateand identify link/conduit locations. Specifically, we seekinformation that can be extracted from government agencyfilings (e.g., [13, 18, 26]), environmental impact statements(e.g., [71]), documentation released by third-party fiber services (e.g., [3–5,10]), indefeasible rights of use (IRU) agreements (e.g., [44, 45]), press releases (e.g., [49, 50, 52, 53]),and other related resources (e.g., [8, 11, 23, 27, 28, 59, 67]).Public records concerning rights-of-way are of particularimportance to our work since highly-detailed location andconduit sharing information can be gleaned from these resources. Laws governing rights of way are established on astate-by-state basis (e.g., see [31]), and which local organization has jurisdiction varies state-by-state [1]. As a result,care must be taken when validating or inferring the ROWused for a particular fiber link. Since these state-specificlaws are public, however, they establish a number of key parameters to drive a systematic search for government-relatedpublic filings.In addition to public records, the fact that a fiber-opticlink’s location aligns with a known ROW serves as a type ofvalidation. Moreover, if link locations for multiple serviceproviders align along the same geographic path, we considerthose links to be validated.To continue the example of Comcast’s network, we used,in part, the following documents to validate the locations oflinks and to determine which links run along shared pathswith other networks: (1) a broadband environment studyby the FCC details several conduits shared by Comcast andother providers in Colorado [12], (2) a franchise agreement [20,21] made by Cox with Fairfax county, VA suggeststhe presence of a link running along the ROW with Comcast and Verizon, (3) page 4 (utilities section) of a projectdocument [24] to design services for Wekiva Parkway fromLake County to the east of Round Lake Road (Orlando,FL) demonstrates the presence of Comcast’s infrastructurealong a ROW with other entities like CenturyLink, ProgressEnergy and TECO/People’s Gas, (4) an Urbana city council project update [68] shows pictures [69] of Comcast andAT&T’s fiber deployed in the Urbana, IL area, and (5) documents from the CASF project [70] in Nevada county, CAshow that Comcast has deployed fiber along with AT&T andSuddenlink.Step 1: Build an Initial MapThe first step in our fiber map-building process is to leverage maps of ISP fiber infrastructure with explicit geocodingof links from Internet Atlas project [83]. Internet Atlas isa measurement portal created to investigate and unravel thestructural complexity of the physical Internet. Detailed geography of fiber maps are captured using the procedure described, esp. §3.2, in [83]. We start with these maps becauseof their potential to provide a significant and reliable portionof the overall map.Specifically, we used detailed fiber deployment maps5from 5 tier-1 and 4 major cable providers: AT&T [6],Comcast [16], Cogent [14], EarthLink [29], Integra [43],Level3 [48], Suddenlink [63], Verizon [72] and Zayo [73].For example, the map we used for Comcast’s network [16]lists all the node information along with the exact geographyof long-haul fiber links. Table 1 shows the number of nodesand links we include in the map for each of the 9 providerswe considered. These ISPs contributed 267 unique nodes,1258 links, and a total of 512 conduits to the map. Notethat some of these links may follow exactly the same physical pathway (i.e., using the same conduit). We infer suchconduit sharing in step 2.2.2Step 2: Checking the Initial MapWhile the link location data gathered as part of the firststep are usually reliable due to the stability and static natureof the underlying fiber infrastructure, the second step in themapping process is to collect additional information sourcesto validate these data. We also use these additional information sources to infer whether some links follow the samephysical ROW, which indicates that the fiber links either reside in the same fiber bundle, or in an adjacent conduit.In this step of the process, we use a variety of publicrecords to geolocate and validate link endpoints and conduits. These records tend to be rich with detail, but have beenunder-utilized in prior work that has sought to identify thephysical components that make up the Internet. Our working assumption is that ISPs, government agencies, and otherrelevant parties often archive documents on public-facing2.3Step 3: Build an Augmented MapThe third step of our long-haul fiber map construction process is to use published maps of tier-1 and large regionalISPs which do not contain explicit geocoded information.We tentatively add the fiber links from these ISPs to themap by aligning the logical links indicated in their publishedmaps along the closest known right-of-way (e.g., road orrail). We validate and/or correct these tentative placementsin the next step.In this step, we used published maps from 7 tier-1 and 4regional providers: CenturyLink, Cox, Deutsche Telekom,HE, Inteliquent, NTT, Sprint, Tata, TeliaSonera, TWC, XO.Adding these ISPs resulted in an addition of 6 nodes, 41links, and 30 conduits (196 nodes, 1153 links, and 347 con-5 Althoughsome of the maps date back a number of years,due to the static nature of fiber deployments and especiallydue to the reuse of existing conduits for new fiber deployments [58], these maps remain very valuable and providedetailed information about the physical location of conduitsin current use. Also, due to varying accuracy of the sources,some maps required manual annotation, georeferencing [35]and validation/inference (step 2) during the process.567
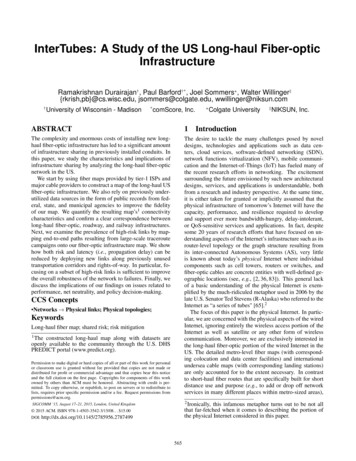
Table 1: Number of nodes and long-haul fiber links included in the initial map for each ISP considered in step 1.ISPNumber of nodesNumber of evel 3240336Suddenlink3942Verizon116151Zayo98111licly available documents reveal that (1) Sprint uses Level3’s fiber in Detroit [61] and their settlement details are publicly available [62], (2) a whitepaper related to a researchnetwork initiative in Virginia identifies link location andsharing details regarding Sprint fiber [27], (3) the “coastalroute” [13] conduit installation project started by Qwest(now CenturyLink) from Los Angeles, CA to San Francisco,CA shows that, along with Sprint, fiber-optic cables of several other ISPs like AT&T, MCI (now Verizon) and WilTel (now Level 3) were pulled through the portions of theconduit purchased/leased by those ISPs, and (4) the fiberoptic settlements website [33] has been established to provide information regarding class action settlements involving land next to or under railroad rights-of-way where ISPslike Sprint, Qwest (now CenturyLink), Level 3 and WilTel(now Level 3) have installed telecommunications facilities,such as fiber-optic cables.duits without considering the 9 ISPs above). For example,for Sprint’s network [60], 102 links were added and for CenturyLink’s network [9], 134 links were added.2.4Integra2736Step 4: Validate the Augmented MapThe fourth and last step of the mapping process is nearlyidentical to step 2. In particular, we use public filings withstate and local governments regarding ROW access, environmental impact statements, publicly available IRU agreements and the like to validate locations of links that are inferred in step 3. We also identify which links share the sameROW. Specifically with respect to inferring whether conduits or ROWs are shared, we are helped by the fact thatthe number of possible rights-of-way between the endpointsof a fiber link are limited. As a result, it may be that we simply need to rule out one or more ROWs in order to establishsufficient evidence for the path that a fiber link follows.Individual Link Illustration: Many ISPs list only POPlevel connectivity. For such maps, we leverage the corpus ofsearch terms that we capture in Internet Atlas and search forpublic evidence. For example, Sprint’s network [60] is extracted from the Internet Atlas repository. The map containsdetailed node information, but the geography of long-haullinks is not provided in detail. To infer the conduit information, for instance, from Los Angeles, CA to San Francisco,CA, we start by searching “los angeles to san francisco fiberiru at&t sprint" to obtain an agency filing [13] which showsthat AT&T and Sprint share that particular route, along withother ISPs like CenturyLink, Level 3 and Verizon. The samedocument also shows conduit sharing between CenturyLinkand Verizon at multiple locations like Houston, TX to Dallas, TX; Dallas, TX to Houston, TX; Denver, CO to El Paso,TX; Santa Clara, CA to Salt Lake City, UT; and Wells, NVto Salt Lake City, UT.As another example, the IP backbone map of Cox’s network [22] shows that there is a link between Gainesville, FLand Ocala, FL. But the geography of the fiber deployment isabsent (i.e., shown as a simple point with two names in [22]).We start the search using other ISP names (e.g.,“level 3 andcox fiber iru ocala") and obtain publicly available evidence(e.g., lease agreement [19]) indicating that Cox uses Level3’sfiber optic lines from Ocala, FL to Gainesville, FL. Next,we repeat the search with different combinations for otherISPs (e.g., news article [47] shows that Comcast uses 19,000miles of fiber from Level3; see map at bottom of that pagewhich highlights the Ocala to Gainesville route, among others) and infer that Comcast is also present in that particular conduit. Given that we know the detailed fiber maps ofISPs (e.g., Level 3) and the inferred conduit information forother ISPs (e.g., Cox), we systematically infer conduit sharing across ISPs.Resource Illustration: To illustrate some of the resourcesused to validate the locations of Sprint’s network links, pub-2.5The US Long-haul Fiber MapThe final map constructed through the process describedin this section is shown in Figure 1, and contains 273nodes/cities, 2411 links, and 542 conduits (with multipletenants). Prominent features of the map include (i) densedeployments (e.g., the northeast and coastal areas), (ii) longhaul hubs (e.g., Denver and Salt Lake City) (iii) pronouncedabsence of infrastructure (e.g., the upper plains and four corners regions), (iv) parallel deployments (e.g., Kansas City toDenver) and (v) spurs (e.g., along northern routes).While mapping efforts like the one described in this section invariably raise the question of the quality of the constructed map (i.e., completeness), it is safe to state that despite our efforts to sift through hundreds of relevant documents, the constructed map is not complete. At the sametime, we are confident that to the extent that the process detailed in this section reveals long-haul infrastructure for thesources considered, the constructed map is of sufficient quality for studying issues that do not require local details typically found in metro-level fiber maps. Moreover, as withother Internet-related mapping efforts (e.g., AS-level maps),we hope this work will spark a community effort aimed atgradually improving the overall fidelity of our basic mapby contributing to a growing database of information aboutgeocoded conduits and their tenants.The methodological blueprint we give in this sectionshows that constructing such a detailed map of the US’slong-haul fiber infrastructure is feasible, and since all datasources we use are publicly available, the effort is reproducible. The fact that our work can be replicated is not onlyimportant from a scientific perspective, it suggests that thesame effort can be applied more broadly to construct similarmaps of the long-haul fiber infrastructure in other countriesand on other continents.568
Figure 1: Location of physical conduits for networks considered in the continental United States.Interestingly, recommendation 6.4 made by the FCC inchapter 6 of the National Broadband Plan [7] states that“the FCC should improve the collection and availability regarding the location and availability of poles, ducts, conduits, and rights-of-way.”. It also mentions the example ofGermany, where such information is being systematicallymapped. Clearly, such data would obviate the need to expend significant effort to search for and identify the relevantpublic records and other documents.Lastly, it is also important to note that there are commercial (fee-based) services that supply location information forlong-haul and metro fiber segments, e.g., [34]. We investigated these services as part of our study and found thatthey typically offer maps of some small number (5–7) ofnational ISPs, and that, similar to the map we create (seemap in [41]6 ), many of these ISPs have substantial overlapin their locations of fiber deployments. Unfortunately, it isnot clear how these services obtain their source informationand/or how reliable these data are. Although it is not possible to confirm, in the best case these services offer muchof the same information that is available from publicly available records, albeit in a convenient but non-free form.3of very few prior studies that have attempted to confirm orquantify this assumption [36]. Understanding the relationship between the physical links that make up the Internetand the physical pathways that form transportation corridorshelps to elucidate the prevalence of conduit sharing by multiple service providers and informs decisions on where futureconduits might be deployed.Our analysis is performed by comparing the physical linklocations identified in our constructed map to geocoded information for both roadways and railways from the UnitedStates National Atlas website [51]. The geographic layoutof our roadway and railway data sets can be seen in Figure 2and Figure 3, respectively. In comparison, the physical linkgeographic information for the networks under consideration can be seen in the Figure 1.Geography of Fiber DeploymentsIn this section, we analyze the constructed map of long-haulfiber-optic infrastructure in the US in terms of its alignmentwith existing transportation networks. In particular, we examine the relationship between the geography of physicalInternet links and road and rail infrastructure.While the conduits through which the long-haul fiberoptic links that form the physical infrastructure of the Internet are widely assumed to follow a combination of transportation infrastructure locations (i.e., railways and roadways) along with public/private right-of-ways, we are awareFigure 2: NationalAtlas roadway infrastructure locations.6 Visually, all the commercially-produced maps agree withour basic map, hinting at the common use of supporting evidence.Figure 3: NationalAtlas railway infrastructure locations.569
Relative FrequencyWe use the polygon overlap analysis capability in the ArcGIS [30] to quantify the correspondence between physicallinks and transportation infrastructure. In Figure 4, aggregating across all networks under consideration, we comparethe fraction of each path that is co-located with roadways,railways, or a combination of the two using histogram distributions. These plots show that a significant fraction of all thephysical links are co-located with roadway infrastructure.The plots also show that it is more common for fiber conduits to run alongside roadways than railways, and an evenhigher percentage are co-located with some combination ofroadways and railway infrastructure. Furthermore, for a vastmajority of the paths, we find that physical link paths moreoften follow roadway infrastructure compared with rail infrastructure.the link from Houston, TX to Atlanta, GA is deployed alongwith NGL pipelines.4In this section, we describe and analyze two notions of riskassociated with sharing fiber-optic conduits in the Internet.At a high level, we consider conduits that are shared by manyservice providers as an inherently risky situation since damage to that conduit will affect several providers. Our choiceof such a risk model that considers the degree of link sharingand not the overall physical topology as a means to analyzerobustness is based on the fact that our map is highly incomplete compared to the 40K plus ASes and certain metrics(e.g., number of fiber cuts to partition the US long-haul infrastructure) have associated security implications [2]. Weintend to analyze different dimensions of network resiliencein future work.RailRoadRail and Road14.100.20.40.60.8Risk MatrixOur analysis begins by creating a risk matrix based on asimple counting-based approach. The goal of this matrix isto capture the level of infrastructure sharing and establisha measure of shared risk due to lack of diversity in physical connectivity. The risk matrix is populated as follows:we start with a tier-1 ISP that has vast infrastructure in theUS and subsequently add other tier-1 and major cable Internet providers to the matrix. The rows are ISPs and columnsare physical conduits carrying long-haul fiber-optic links forthose ISPs. Integer entries in the matrix refer to the numberof ISPs that share a particular conduit. As a result, values inthe matrix increase as the level of conduit-sharing increases.As an illustrative example, we choose Level 3 as a “base”network due to its very rich connectivity in the US. We useour constructed physical network map (i.e., the map we describe in §2) and extract all conduit endpoints across citypairs, such as “SLC-Denver” (c1 below), SLC-Sacramento(c2 below), and Sacramento-Palo Alto (c3 below), etc., andassign 1 for all conduits that are part of Level 3’s physicalnetwork footprint. A partial matrix is then:0.50Assessing Shared Risk1Fraction of paths co-locatedFigure 4: Fraction of physical links co-located with transportationinfrastructure.Despite the results reported above there remain conduitsin our infrastructure map that are not co-located with transportation ROWs. For example,
InterTubes: A Study of the US Long-haul Fiber-optic Infrastructure Ramakrishnan Durairajan†, Paul Barford†*, Joel Sommers , Walter Willinger‡ {rkrish,pb}