Transcription
Kafara et al. Journal of Ovarian Research (2015) 8:36DOI 10.1186/s13048-015-0165-zRESEARCHOpen AccessLipoic acid decreases Mcl-1, Bcl-xL and upregulates Bim on ovarian carcinoma cellsleading to cell deathPerrine Kafara1,2,3, Philippe Icard1,2,3,4, Marilyne Guillamin1,2,3, Laurent Schwartz4 and Hubert Lincet5,6,7*AbstractBackground: Ovarian carcinoma is the leading cause of death from gynecological cancer because there is risk ofchemoresistance. As previously demonstrated in our laboratory, Alpha-lipoic acid (LA), a co-factor for metabolicenzymes, suppresses the tumor growth. In this study, we have researched the mechanisms that are responsible forthe activity of LA.Methods: We have studied the mechanisms of LA in two ovarian cancer cell lines, a cisplatin sensitive one, IGROV1and its resistant counterpart, IGROV1-R10. These cells have been exposed to lipoic acid at various concentrations.Cell proliferation, cell cycle repartition and nuclear staining with DAPI were recorded. Western blot analyses wereperformed to detect various proteins implied in apoptotic cell death pathways. To investigate the formation of ROS,the oxidation of CM-DCFH2-DA were also determined.Findings: LA suppressed growth proliferation and induced apoptosis in both ovarian cell lines. Moreover, LAprovoked a down regulation of two anti-apoptotic proteins, Mcl-1 and Bcl-xL protein and a strong induction of theBH3-only protein Bim. Furthermore, LA induced ROS generation which could be involved in the CHOP inductionwhich is known to activate the Bim translation.Conclusions: Our results reveal novel actions of LA which could explain the anti-tumoral effects of the LA. Therefore,LA seems to be a promising compound for ovarian cancer treatment.Keywords: Lipoic acid, Mcl-1, Bcl-xL, Bim, ovarian cancer, ROSFindingsBackgroundAlpha-Lipoic acid (LA) is a naturally antioxidant lipophilic compound synthesized in small amounts by plantsand animals, including humans. It is an essential cofactor for mitochondrial enzymes (e.g. pyruvate dehydrogenase (PDH), succinate dehydrogenase (SDH)) [1, 2]involved in tricarboxylic acid cycle (TCA). Furthermore,LA has antioxidant and redox-regulating properties [3].The reduced form of LA known as dihydrolipoic acid isthe predominant form that interacts with reactive oxygen species (ROS), although the oxidized forms can also* Correspondence: hubert.lincet@univ-lyon1.fr5UMR INSERM U1052, CNRS 5286, Centre de Recherche en Cancérologie deLyon, Lyon, France6ISPB, Faculté de Pharmacie de Lyon, 8 avenue Rockefeller, F69373 Lyon,Cedex 08, FranceFull list of author information is available at the end of the articleinactive free radicals [4]. Beneficial effects of LA in several non tumoral pathologies have been described [5]. Incancer studies, LA suppressed the proliferation of cellssuch as bladder, breast, colon, hepatoma, and lung [6–11]without effect on normal cells [12] such as liver, ovarian,neurons and hepatocytes [13–15]. These effects could induce the apoptosis that is impaired in cancer.Apoptosis is under the control of Bcl-2 family members, promoting or inhibiting this process [16]. Deathsignals activate and/or induce pro-apoptotic memberssuch as Bim which promotes activation of pro-apoptoticeffectors (Bax and Bak) and releasing apoptogenic factors from mitochondria [17]. Bim, is one of the most potent BCL-2 homology (BH) 3-only molecules, in termsof cell killing [18], and has also clearly overlapping functions in p53-dependent and p53-independent apoptosis.Anti-apoptotic members, such as Bcl-2, Bcl-xL and Mcl-1, 2015 Kafara et al. This is an Open Access article distributed under the terms of the Creative Commons Attribution ), which permits unrestricted use, distribution, and reproduction in any medium,provided the original work is properly credited. The Creative Commons Public Domain Dedication waiver ) applies to the data made available in this article, unless otherwise stated.
Kafara et al. Journal of Ovarian Research (2015) 8:36overexpressed in numerous human malignancies, contribute to cell survival and drug resistance [19, 20]. Bcl-xLoverexpression has been found associated with chemoresistance and its decrease involved in apoptosis [21, 22].Moreover, MCL-1 gene, frequently amplified in humancancers [20], is associated with chemoresistance and relapse [19, 20, 23]. The reduction of Mcl-1 expression leadsto apoptosis in numerous cancer cells [22–26]. This reduction is notably induced by glucose privation [27].Many cancer cells preferentially enhance aerobic glycolysis and transform a significant part of glucose in lactate, even in the presence of oxygen, a common featureof tumor growth described as the Warburg effect [28].This metabolism furnishes a significant share of ATPand essential intermediates required for tumor proliferation [29]. Its inhibition arrests cancer cell growth [26,30–32]. The Warburg effect should be in relation withinactivation of PDH and/or over-activation of LDH [29].The PDH inactivation disconnects TCA from glycolysis,and in place of pyruvate, glutaminolysis replenishes TCAcycle. LA may reactivate PDH and could be a promisingmolecule to counteract tumor metabolism [2].In this study, we examined effect of LA on cellulargrowth of two human ovarian carcinomas and the molecular mechanisms involved. We found LA demonstrated anti-proliferative effect, induced cell cycle arrestand apoptosis. In our model, the anti-tumoral effects ofLA might involve, at least partially, from its property todecrease Mcl-1 and Bcl-xL and to up regulate the BH3only protein Bim through CHOP induction.Materials & methodsCell lines and culture conditionsThe IGROV1 cell line was kindly provided by Dr. J.Bénard (Institut Gustave Roussy, Villejuif, France). Thevariant highly chemoresistant cell line, IGROV1-R10,was established as previously described by Poulain et al.[33]. Cells were grown in RPMI-1640 medium Glutamax (Gibco Life Technologies, Cergy-Pontoise, France)supplemented with 10 % fetal calf serum, 33 mM sodiumbicarbonate (Gibco Life Technologies, Cergy Pontoise,France). Cells were maintained at 37 C in a 5 % CO2humidified atmosphere and split twice a week bytrypsinization.Lipoic acidLipoic acid (LA) was purchased from Meda Pharma(Bad Homburg v.d.h, Germany). This compound is preconditioned in a bulb for a volume of 24 ml. This solution contains 600 mg alpha-lipoic acid. The otheringredients are Trometamol (known by its synonymTris) and water for the injectable. Data were obtainedfrom the supplier. 5.105 cells were seeded in 25 cm2 flaskday before treatment. When cells have reached theirPage 2 of 13exponentially growing phase, they were treated 24 hlater continuous manner. The solution is put directlyinto the flasks at the concentration studied (0.1; 0.5 and1 mM).siRNA synthesis and TransfectionAll siRNAs used in these studies were chemically synthesised by Eurogentec (Liege, Belgium) and were received as annealed oligonucleotides. The sequence of thedouble-stranded RNA used to inhibit Bim expression(denoted siBim) is anti-sense 5′-uaacagucguaagauaacctt3′. Control siRNA (noted siCTRL) was purchased fromEurogentec (Eurogentec Negative Control SiRNA). According to the manufacturer’s instruction, exponentiallygrowing cells were seeded the day before to reacharound 50 % confluence at the time of transfection. Thetransfection has been described by Lepleux et al. [31].Proliferation analysisCell number and viability were estimated at various timesafter the beginning of treatment by a semi-automatedimage-based cell analyzer (Cedex XS Analyser, RocheApplied Science, Meylan, France) using the trypan blueexclusion method.Analysis of cellular DNA content by flow cytometryCells were prepared for flow cytometry as detailed [22, 31].Briefly, adherent and detached cells were pooled, washedin PBS and fixed in 70 % ethanol, centrifuged then incubated for 30 min at 37 C in PBS. Pellets were collectedand resuspended for staining with Propidium Iodide(PI) using the DNA Prep Reagent Kit (Beckman-Coulter,Villepinte, France). Samples were then analysed usingGallios flow cytometer (Beckman Coulter) equipped with ablue diode at 22 mW. The fluorescence of PropidiumIodide was collected in the FL3 channel with a 620 nmbandpass filter. The doublets were excluded from analysisusing an area versus peak DNA content histogram. Thesingulets were analysed in a single-parameter histogram.Gallios software was used for data acquisition. KaluzaSoftware (Beckman Coulter) was run for data analysis.Nuclear morphology study with 4′,6-diamidino-2phenylindole (DAPI)After treatment, both detached and adherent cells werepooled after trypsinization, collected on polylysine-coatedglass slide by cytocentrifugation, and fixed in ethanol/chloroform/acetic acid solution (6:3:1). The preparationswere treated as described by Lepleux et al. [31].Western immunoblottingAdherent cells were rinsed with deionized water andlysed with lysis buffer (pH 8.8 30 mmol.L 1 Tris buffercontaining 6 mol.L 1 urea, 2 mol.L 1 thiourea, 2 %
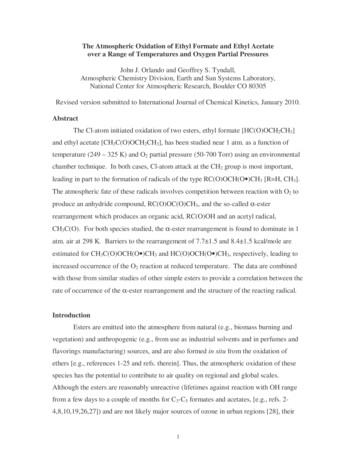
Kafara et al. Journal of Ovarian Research (2015) 8:36CHAPS, 1X protease inhibitor Mix. Western blot werecarried out as described [22]. The membrane was eitherincubated overnight at 4 C in T-TBS-milk 5 % with thefollowing primary antibodies: anti-Mcl-1 (Santa CruzBiotechnology), anti-Noxa (Calbiochem), and anti-actin(Millipore). Cleaved and total Caspase 3, PARP, Bcl-xL,Bim and CHOP were purchased from Cell SignalingTechnology (Ozyme, Saint Quentin en Yvelines, France).Membranes were washed with T-TBS and incubatedwith anti-rabbit or anti-mouse secondary antibodies.Revelation was carried out using ECL Prime detectionreagent (GE Healthcare, Orsay, France).RNA extraction and real-time quantitative reversetranscription-PCR (qRT-PCR)Total RNAs were extracted using the TRIzol (Invitrogen, LifeTechnologies, Cergy Pontoise, France). TheqRT-PCR was carried out as described [34]. Primer andprobe sequences for real-time detection of Bim mRNA(assay ID#Hs00708019 s1), Mcl-1 mRNA (assay ID#HS001 720 36 m1) and endogenous control gene GAPDHmRNA [34] were purchased form Applied Biosystems.Bim and Mcl-1 transcripts were quantified relative toGAPDH and normalized to control untreated cells bythe comparative 2ΔΔct method.Measurement of ROS with CM-DCFH2-DA probeThe probe CM-DCFH2-DA was used for assess the production of ROS according to manufacturer’s instructions. The CM-DCFH2-DA passes through the cellmembrane and once inside the cell is converted to thenon-fluorescent derivate dichlorofluorescein, which inturn remains inside the cell and reacts with intracellularROS to produce the DCF. To study the time-dependenteffect of α-LA on ROS production, 5.105 cells were exposed to 0.5 or 1 mM of α-LA for 3 h, 6 h or 24 h, andwere incubated with 5 μM CM-H2DCFDA (C6827, Molecular probes) for 30 min at 37 C in dark. The ROSscavenger NAC (3 mM) (Sigma-Aldrich, France) wasadded 1 h before LA treatment (1 mM). After, adherentcells were washed out the excess probe with PBS andthen trypsinizated. The fluorescence of DCF was measured in the FL1 channel with a 525 nm bandpass filteron Gallios flow cytometer (Beckman Coulter). Galliossoftware was used for data acquisition. Kaluza Software(Beckman Coulter) was run for data analysis. The resultswere treated and presented as means standard errorsof the means (SEM) of three independent experimentsusing GraphPad Prism5 software.ResultsEffects of lipoic acid on cell growth and cell cycleTo explore the therapeutic potential effect of LA forovarian cancer treatment, we evaluated its effect on cellPage 3 of 13growth and cell cycle distribution. For studying cellulargrowth, Cisplatin-sensitive (IGROV1) and cisplatinresistant (IGROV1-R10) human cell lines, were culturedeither in absence or in presence of LA (0.1, 0.5 and1 mM). In each cell line, cell growth was significantly reduced in a dose-dependent manner, whereas controlcells increased 3–4 folds (Fig. 1a). LA (1 mM) stronglyinhibited cell growth at each time point tested, and thenumber of viable cells remaining close to seeding after72 h (Fig. 1a). At 0.5 mM, this inhibition was also clear,but delayed after 48 h treatment. At this time, we studied cellular morphology, distribution in the differentphases of cell cycle and DAPI nuclear staining. At LA0.1 mM, no effect was detected in both cell line (Fig. 1b).From LA 0.5 mM, IGROV1 and IGROV1-R10 cells wereless confluent, as compared to untreated cells or treatedwith LA 0.1 mM (Fig. 1b, upper line of each panel).IGROV1 and IGROV1-R10 showed an important percentage of cells in sub-G1 phase (21.1 %, and 27.5 % respectively) in response to LA 1 mM (Fig. 1b, lower lineof each panel). These results were confirmed by DAPInuclear staining which showed more features of celldeath, e.g. nuclear condensations and fragmentations (asnamed apoptotic bodies) (Fig. 1b, middle line of eachpanel) and also by PARP cleavage which has been foundbut not a caspase-3 cleavage from 0.5 mM in IGROV1and resistant counterpart IGROV1-R10 cells (Fig. 1c).After 72 h of treatment (0.5 and 1 mM), in each cell line,many rounded cells were detected, suggesting detachedcells; a phenomenon which seemed dose-dependent(Fig. 1d, upper line of each panel). The cell cycle repartition revealed that percentage of cells in sub-G1 phase isdrastically increased at 72 h as compared to 48 h in bothcell lines and is also increased in a concentrationdependent manner reaching 53.4 % at LA 1 mM (Fig. 1d,lower line of each panel). Moreover, DAPI staining revealed numerous apoptotic bodies after exposure to 0.5 or1 mM LA (Fig. 1d middle line of each panel). At this time,we can see that a caspase-3 activation which was accompanied by a strong decrease of the full length PARP(116 kDa) (Fig. 1e).These results indicated that LA inhibited cellular proliferation and induced a sub-G1 peak associated caspase3 activation. The cell detachment observed in flasks,might be associated with cell death and deregulation ofapoptosis-related proteins.Effect of lipoic acid on expression of the apoptosisrelated proteinsWe tested whether the effect of LA (0.5 or 1 mM) wasassociated with a modulation the expression of theapoptosis-related proteins, Bcl-xL, Mcl-1 and Bim. At24 h after exposure to LA, no protein variation was detected (data not shown). Anti-apoptotic Mcl-1 protein
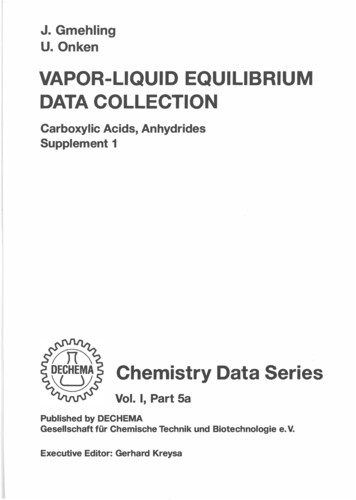
Kafara et al. Journal of Ovarian Research (2015) 8:36Page 4 of 13IGROV1IGROV1-R10AControlLA0.5 mM0.1 mM1 mMControlLA0.5 mM0.1 mM1 mMB48 21.10%Go-G1:57.21%SubG1:2.11%SubG1:1.81%LA (mM)Go-G1:60.34%SubG1:3.37%SubG1:27.50%LA (mM)Ctrl 0.5 1CPARPPro-caspase 3Ctrl 0.5 1PARPPro-caspase 3ActinControlGo-G1:65.11%Actin0.1 mMLA0.5 mM1 mMControl0.1 mMLA0.5 mM1 mMD72 :70.53%SubG1:2.46%LA (mM)Pro-caspase 3Cleavedcaspase 3ActinFig. 1 (See legend on next page.)SubG1:2.63%LA (mM)Ctrl 0.5 1PARPGo-G1:71.59%Ctrl 0.5 1EPARPPro-caspase 3Cleavedcaspase .40%
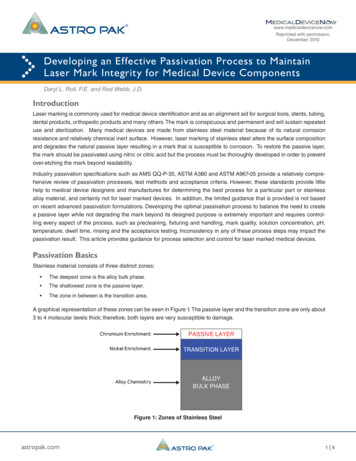
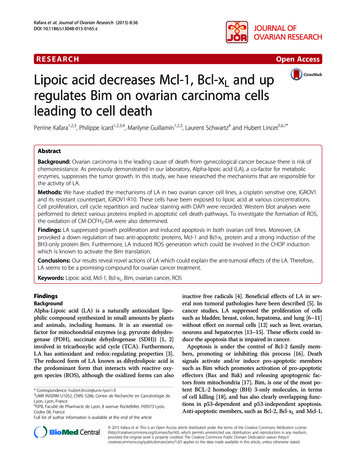
Kafara et al. Journal of Ovarian Research (2015) 8:36Page 5 of 13(See figure on previous page.)Fig. 1 Lipoic acid induces apoptosis in IGROV1 and IGROV1-R10 ovarian carcinoma cell lines. IGROV1 (left panel) and IGROV1-R10 (right panel)were treated to a continuous exposure to 0.1; 0.5 and 1 mM of lipoic acid (LA) and effects of this treatment were analyzed after 48 h and 72 h.a: Cell Viability was expressed as number of viable cells determined by the trypan blue exclusion method. Graphics were realized and are presented asmeans standard errors of the means (SEM) of three independent experiments using GraphPad Prism5 software. b and d: Morphological features ofthe cells observed by photon microscopy (upper line of each panel) and nuclear features of the cells after DAPI staining (middle line of each panel)were then studied, Bars: 20 μm. DNA content histograms obtained by flow cytometry (lower line of each panel) after a 48 h treatment (b) or a 72 htreatment (d). For each condition, the percentage in sub-G1 and G0-G1 phases is indicated. c and e: Protein expression levels of PARP (native andcleaved forms), caspases-3 (pro and cleaved forms) were assessed in control or LA-treated (0.5 or 1 mM) cells at 48 h (c) and 72 h (e) by western blotusing a specific anti-PARP and anti-caspase-3 antibody. Expression of actin was measured as a loading control. Western blots shown are from oneexperiment representative of at least three independent experiments and cell lysateslevel was reduced in a concentration-dependent mannerafter a 48 h exposure to LA 0.5 - 1 mM in both cell lines(Fig. 2a upper panel) and Mcl-1 expression was almostabolished after 72 h exposure to the LA concentrations(Fig. 2b lower panel), and was concomitant with theinduction of apoptosis (PARP cleavage, caspase-3 activation) (Fig. 1e). For the same conditions, a concomitantreduction of Bcl-xL level was found (around 20-30 %)(Fig. 2b lower panel).Interestingly, Bim was induced by LA in a dose andtime-dependent manner with occurrence of BimEL andBimS forms at 72 h (Fig. 2a and b).To determine whether the inhibition of Mcl-1 proteinand the increase of Bim were due to a reduction ofmRNA, we performed qRT-PCR. Whatever the time andthe LA concentration, no decrease in Mcl-1 mRNA wasobserved (Fig. 3a). On the contrary, LA induced a lowup-regulation of Bim mRNA in both cell lines (Fig. 3b).siRNA-mediated Bim inhibition decreases the cell death inresponse of lipoic acidTo study the importance of Bim in the response of ourmodel to LA, we tested the impact of Bim targeting bysiRNA on cell death of IGROV1 and IGROV1-R10, 24 hafter transfection exposed to LA 1 mM (Fig. 4a). We firstchecked the efficacy by showing a complete extinction ofthis protein in both cell lines after 48 h of siRNA transfection. In contrary, Bim expression was not modified intransfected cells with control siRNA (siCTRL) (Fig. 4b).siBim combination with LA (1 mM) abrogated thecytotoxic effect of LA. Indeed, 48 h after treatment, adecrease percentage of cells in sub-G1 peak, reaching15 % for IGROV1 and 9 % for IGROV1-R10 was observed when Bim was silenced, as compared to cellstreated with LA alone, (Fig. 4c right column of eachpanel and Fig. 4d right column of each panel).The DAPI nuclear staining confirmed these results,showing in both cell lines that exposure with siBim andLA 1 mM, strongly decreased these nuclear characteristics of apoptosis (nuclear condensations and fragmentations), which were strongly observed in response to LAtreatment alone (Fig. 4c middle column of each paneland Fig. 4d middle column of each panel).We investigated the impact of targeting Bim by siRNAon the apoptosis induction in our models 48 h after LAtreatment. In response to siBim and LA exposure, weobserved an inhibition of caspase-3 cleavage and also adecrease of Mcl-1 and Bcl-xL proteins (Fig. 4e). Theseresults demonstrate that Bim is involved in LA-mediatedapoptosis despite a decrease of two anti-apoptotic proteins in IGROV1 and IGROV1-R10 cells.Lipoic acid may induced the Endoplasmic Reticulumstress response and accumulation of ROSBecause Bim is frequently induced by EndoplasmicReticulum (ER) stress response via the C/EBP homologous protein (CHOP) expression, we investigated thispathway in response to LA by detecting CHOP. CHOPwas strongly expressed at 72 h in IGROV1-R10 from LA0.5 mM (Fig. 5a right panel) and was correlated with theinduction of Bim expression (Fig. 2b right panel).In order to determine whether LA treatment generatesthe ROS in our models, we measured by a converting reaction of DCFH2-DA to DCF 3 h and 6 h after LAexposure.At 0.5 mM LA, we measured a slightly increased ROSgeneration in IGROV1 and IGROV1-R10 cells from 3 hand more important at 6 h in IGROV1-R10 vs IGROV1cells (data not shown). However, the ROS productionwas more efficient at 1 mM LA whatever the time aftertreatment (e.g. at 6 h 140 % in IGROV1 and 170 % inIGROV1-R10) (Fig. 5b-c). Interestingly, pretreatmentwith ROS scavenger NAC (3 mM) decreased α-LAinduced ROS (Fig. 5b-c).DiscussionOvarian cancer is the fifth most frequent cause of cancerdeath in women, often diagnosed at an advanced stage.Despite radical surgery and a frequent good response toa first-line platinum-based chemotherapy, the 5-yearsurvival rate is about 20 % - 30 % for stage III and IVdisease [35]. Thus, discovery of new treatments is fundamental to overcome chemoresistance and improve survival. In this perspective, lipoic acid (LA) moleculewhich demonstrated a low toxicity in various pathologies(in particular, neurological sequels of chemotherapies)
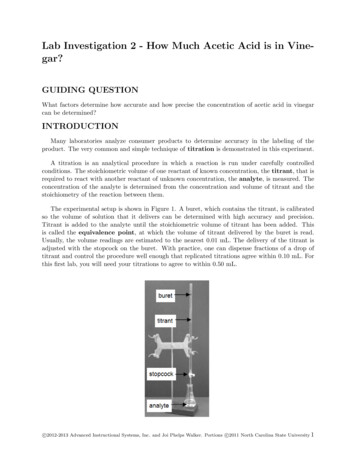
Kafara et al. Journal of Ovarian Research (2015) 8:36Page 6 of 13AIGROV148 hIGROV1-R10LA (mM)Ctrl0.5LA (mM)140 01.32Mcl-11.00.780.5623 KDaELL BimS15 KDa12 KDa1.02.79Actin30 KDaBcl-xL1.00.90ELLS5.3643 KDaFold increase0.86Fold increaseFold increaseNoxa6 KDa1.01.221.28Fold increaseActin43 KDaBLA (mM)Ctrl0.5LA (mM)72 h140 KDaCtrl0.511.00.270.051.03.234.43Fold increase1.00.700.68Fold increase1.02.202.33Fold increaseMcl-11.00.250.1623 KDaEL15 KDa12 KDaLSELBim1.04.505.9730 KDaFold increaseLSBcl-xL1.00.830.83Noxa6 KDa1.02.0143 KDaFig. 2 (See legend on next page.)2.35Actin
Kafara et al. Journal of Ovarian Research (2015) 8:36Page 7 of 13(See figure on previous page.)Fig. 2 Lipoic acid modulates Bcl-2 proteins family expressions. After 48 h (a) or 72 h (b) of LA treatment on IGROV1 (left panel) and IGROV1-R10(right panel) cell lines, whole cell lysates were immunoblotted for the indicated proteins and actin was loaded as control. The relative densitometryvalues were quantified by Image J software and are shown on the bottom. Western blots shown are from one experiment representative of at leastthree independent experiments and cell lysates. Moreover, on Fig. 2a, there are two different strips of actin both blots were carried out independentlyof one anothercould be essential to be tested clinically, if its efficiencyis demonstrated in preclinical studies.In this study, we demonstrated in two human ovariancancer cells lines, one highly chemoresistant, that LAsuppressed the proliferation and induced the cell deathin both cell lines by decreasing of Mcl-1 and Bcl-xL expression, two anti-apoptotic proteins; whereas the induction of CHOP could promote Bim transcription.In our study, the inhibition of proliferation was timeand concentration-dependent, and was in accordancewith other studies in breast, neuroblastoma, colon, andbladder cancer cells [6, 9, 11]. We showed that LA treatment provokes the cell detachment in flasks. Thisphenomenon could be due to down-regulation of β1-Aintegrin expression [36] and reduces the MMPs-2 andMMP-9 activities [37]. Thus, all data show that LA hasthe high capacity to inhibit cell growth of numerouscancer cell lines.First, in cellular cycle and morphology studies, weshowed that LA treatment resulted in a slight reductionin the growth through the G1 arrest of the cell cycle, aresult in agreement with previous studies [7, 10]. The arrest of the cell cycle was accompanied by a cellular accumulation in the sub-G1 phase, which is a characteristicof cell death. The nuclear morphology revealed fragmentation and condensation which are typical of apoptosis.This apoptosis was also supported by PARP andcomplete caspase-3 cleavages, in particular at 72 h ofIGROV1-R10IGROV1Mcl-1BBimFig. 3 Lipoic acid regulates Mcl-1 and Bim mRNA levels. Mcl-1 (a) and Bim (b) mRNA levels in IGROV1 (left panel) and IGROV1-R10 (right panel)treated with LA different times was assessed by real-time quantitative reverse transcription PCR. Data are normalized with GAPDH mRNA levelsused as an endogenous control. Results are expressed as relative to the levels in control cells set as one. This analysis was performed only 2 times
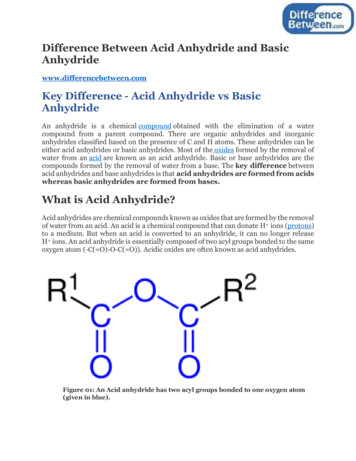
Kafara et al. Journal of Ovarian Research (2015) 8:36Page 8 of 1324h48hAnalysissiBimLA (1mM)siCtrlsiBimsiCtrlIGROV1-R10CtrlsiBimLA (1mM)siCtrlsiBimsiCtrlCtrl23 KDa23 KDa15 KDa12 KDaBim43 KDaActinDIGROV143 -G1:64.93%Sub-G1:21.10%LA (1mM)G0-G1:60.34%Sub-G1:27.50%siCtrl /LA CtrlsiBimLA (1mM)siCtrlsiBimsiCtrlIGROV1CtrlELA (1mM)Sub-G1:15.06%G0-G1:74.63%Sub-G1:9.31%siBim /LA (1mM)LA (1mM)siBimSub-G1:4.23%LA (1mM)C15 KDa12 KDasiCtrlIGROV1LA (1mM)Transfection LA (1mM)B72 hLA (1mM)T0A40 KDaMcl-140 KDa30 KDaBcl-xL30 KDa32 KDaCaspase 332 KDa19 KDa17 KDaCleavedcaspase 319 KDa17 KDaActin43 KDa43 KDaFig. 4 (See legend on next page.)
Kafara et al. Journal of Ovarian Research (2015) 8:36Page 9 of 13(See figure on previous page.)Fig. 4 siBim attenuates lipoic acid induced-apoptosis 72 h after transfection. a: The cells were treated following protocol of exposure regardingthe treatment by lipoic acid (1 mM) administered 24 h after transfection with either 20nM nonspecific siRNA control (siCRTL) or siBim, as described inmaterials and methods section. b: Bim protein expression level was assessed in control or treated-cells at 72 h post-transfection of IGROV1 (left panel)and IGROV1-R10 (right panel) by western blot. Actin protein is used as a loading control. Actin is a same actin that in Fig. (4e). This blot was performedin the same experiment as that of blot in Fig. 4e. Western blots shown come from one experiment representative of at least three independentexperiments and cell lysates. c-d: Morphological features of the cells observed by photon microscopy (left column of each panel) and nuclearfeatures of the cells after DAPI staining (middle column of each panel) were then studied, Bars: 20 μm. DNA content histograms obtained byflow cytometry (right column of each panel) after a 48 h of LA treatment in IGROV1 [c] and IGROV1-R10 (d) cell lines were studied. For eachcondition, the percentage of sub-G1 and G0-G1 phases is indicated. e: Bcl-xL, Mcl-1, caspases-3 (pro and cleaved forms) protein expressionlevels were assessed in control or treated-cells at 72 h post-transfection of IGROV1 (left panel) and IGROV1-R10 (right panel) by western blot.Actin protein is used as a loading control. Actin is a same actin that in Fig. (4b). This blot was performed in the same experiment as that ofblot in Fig. 4b. Western blots shown are from one experiment representative of at least three independent experiments and cell lysatestreatment in both cell lines. However, a more rapid caspase 3 cleaved was observed in Fig. 4e. It is likely thatthis difference is due to the transfection process. Indeedto make a transfection, the flasks were seeded with 375000 cells (results presented in Fig. 4e), less than the 500000 cells required to seed both cells lines for none transfected experiments (Fig. 1c-e). Thus, it is likely that thedifference in seeding accelerates the effect of LA. In thatIGROV1Asense, the cleavage of caspase 3, was weaker in Fig. 4e,an attenuation that could indicate a cleavage starting atthis time.It is also noteworthy that LA induced from 48 h, acomplete down expression of Mcl-1, an anti-apoptoticprotein often up-regulated in cancer cells [25, 38, 39].LA induced also a strong up-regulation of Bim, a BH3only protein which is essential for apoptosis of variousIGROV1-R1072 HLA (mM)Ctrl0.5LA (mM)1Ctrl0.51CHOPActinBCFig. 5 Lipoic acid induces ER stress and increases ROS generation in IGROV1 and IGROV1-R10. a: ER stress protein expression was assessed inIGROV1 (left panel) and IGROV1-R10 (right panel) cell lines by immunoblot using an antibody which recognizes CHOP protein. The blot shown isrepresentative of three independent experiments and cell lysates. b-c: ROS production was measured by flow cytometry using CM-DCFH2-DAprobe. Histograms show that 3 or 6 h of LA treatment (1 mM) increased ROS production compared to control and ROS scavenger (NAC). Barsrepresent the mean of n 3 independent biological replicates SEM. Graphics were realized and are presented using GraphPad Prism5 software.ROS levels in treated vs no treated cells in IGROV1 or IGROV1-R10 were analyzed by One-way analysis of variance (ANOVA) with post hoc analysisusing Newman-Keuls multiple comparison test was used for parametric data. A p value of 0.05 was considered statistically significant. * p 0.5;** p 0.1; *** p 0.01
Kafara et al. Journal of Ovarian Research (2015) 8:36cell types, including epithelial cells, endothelial cells,neurons, and lymphocytes [18, 40]. We next investigatedthe impact of siRNA-mediated Bim inhibition on theapoptosis of IGROV1 and IGROV1-R10 cells, in response to LA exposure (1 mM). We observed in theFig. 4b that siCRTL LA induced a slowly decrease ofBim expression protein in both cell lines whereas therewere an increase of cell death (subG1 peak) in both celllines. This “contradictory” result is very likely due to thetransfection process, which weakens some cells, leadinga part of them to cell death. In this condition, Bim silencing diminished apoptotic cell death, as observed by themorphological and nuclear features (Fig. 4b-c leftPage 10 of 13column of each panel). Cell cycle analysis by cytometry revealed that siBim followed by LA (1 mM) reduced thedrop of cells in sub-G1 peak, as compared LA treatmentalone: 15 % vs 21.1 % in IGROV1 and 9.3 % vs 27.5 % inIGROV1-R10 cells (Fig. 4b-c right column of each panel).Likewise, Bim silencing is correlated with an absenceof activated-caspase-3 and of PARP cleavage after LA exposure. In consequence, this loss of Bim expressionseemed to partially protect our ovarian carcinoma celllines from death. Similarly, a low expression
RESEARCH Open Access Lipoic acid decreases Mcl-1, Bcl-x L and up regulates Bim on ovarian carcinoma cells leading to cell death Perrine Kafara1,2,3, Philippe Icard1,2,3,4, Marilyne Guillamin1,2,3, Laurent Schwartz4 and Hubert Lincet5,6,7* Abstract Background: Ovarian carcinoma is the leading cause of