Transcription
Learning Ocean Science through Ocean ExplorationSection 6Ocean Primary ProductionPhotosynthesisSystems LackingPrimary ProducersEvery ecosystem requires an input of energy. Thesource varies with the system. In the majority ofocean ecosystems the source of energy is sunlight thatdrives photosynthesis done by micro- (phytoplankton) ormacro- (seaweeds) algae, green plants, or photosyntheticblue-green or purple bacteria. These organisms produceecosystem food that supports the food chain, hence theyare referred to as primary producers. The balancedequation for photosynthesis that is correct, but seldomused, is 6CO2 12H2O C6H12O6 6H2O 6O2. Waterappears on both sides of the equation because the watermolecule is split, and new water molecules are made inthe process. When the correct equation for photosynthesis is used, it is easier to see the similarities with chemosynthesis in which water is also a product.There are some ecosystems that depend on primaryproduction from other ecosystems. Many streamshave few primary producers and are dependent on theleaves from surrounding forests as a source of food thatsupports the stream food chain. Snow fields in the highmountains and sand dunes in the desert depend on foodblown in from areas that support primary production.The oceans below the photic zone are a vast space,largely dependent on food from photosynthetic primaryproducers living in the sunlit waters above. Foodsinks to the bottom in the form of dead organisms andbacteria. It is as small as marine snow—tiny clumps ofbacteria and decomposing microalgae—and as large asan occasional bonanza—a dead whale.111
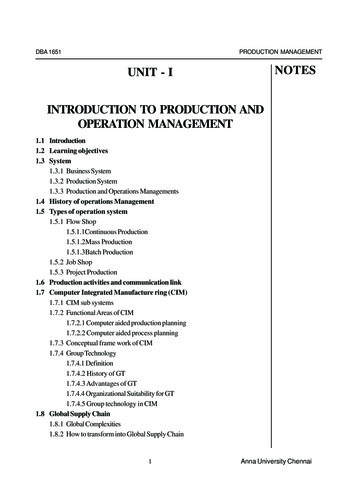
Learning Ocean Science through Ocean ExplorationSection 6: Ocean Primary cean exploration has brought to light new ecosystems,dependent on chemosynthetic bacteria which producefood from CO2 (and sometimes water) using energy fromthe metabolism of inorganic materials found aroundthem. Chemosynthesis was already well known in terrestrial systems. Nitrifying and anaerobic denitrifyingbacteria as well as sulfur-fixing and anaerobic sulfur-reducing bacteria all use energy sources other than the sun.These bacteria had been studied in terrestrial and shallow water systems, but finding entire large ecosystems inthe deep sea dependent on chemosynthetic bacteria usingsulfur and methane as substrates opened major newareas of research. The discovery of hydrothermal ventsand coldwater methane seeps has given us a new vision ofprimary production in the deep sea.Hydrothermal Vent SystemsHydrothermal vents—hot springs associated withspreading ridges on the sea floor—support exoticchemical-based ecosystems. The thriving communitiesassociated with these vents shocked the scientific worldwhen humans first observed a vent on the deep oceanfloor in 1977. These vent ecosystems depend on microbesthat use chemical energy available in the minerals fromthe hot spring water. Since they depend upon chemicalsfor energy instead of the sun, these autotrophic ventdwelling microbes are called chemoautotrophs. Sulfurin the form of hydrogen sulfide is an energy rich, buttoxic molecule. Bacteria that use hydrogen sulfideas an energy source are important to most vent foodchains. They exist as both free-living organisms and asmutualistic symbionts within animals. The equationfor chemosynthesis based on hydrogen sulfide is 6CO2 24H2S 6O2 C6H12O6 24S 18H2O. The vent foodchain supported by chemosynthetic bacteria includesshrimp, tubeworms, clams, fish, crabs, and octopi.These animals are well adapted to the extreme ventenvironment—complete darkness, water temperaturesranging from the 2 C of the surrounding seawater to400 C at the vent, hundreds of atmospheres of pressure,112
Learning Ocean Science through Ocean ExplorationSection 6: Ocean Primary Productionoceanexplorer.noaa.govand high concentrations of sulfides and other toxicchemicals.The irony is that once scientists knew what to lookfor, they went to other well-known ecosystems thatwere rich in hydrogen sulfides, such as salt marshes,and found the same mutualistic association ofchemosynthetic bacteria and animals that had stunnedthem in the deep vents. No one had ever thought to lookfor them, but they were there all along.Both photosynthesis and chemosynthesis require anenergy source and use carbon dioxide as a source ofcarbon to synthesize sugars and new water molecules.Photosynthesis gives off oxygen gas as a by-product,while chemosynthesis produces a wide variety of byproducts, depending on what chemical substrate is used.The sugars produced provide both metabolic energy andsubstrate for synthesis of other biochemical molecules.Hydrothermal vents have a number of kinds oflithotrophic (chemical-eating) bacteria associated withthem in addition to those that use hydrogen sulfide sincehydrothermal vents release many inorganic compoundsto the surrounding seawater. Not all hydrothermalvents are the same. The very hot vents are calledblack smokers because some of the minerals releasedprecipitate out as a black cloud in the surroundingcolder water. They have high flow rates and very hotwater, in addition to the variety of chemicals released.Other vents have cooler temperatures and differentchemicals. The Lost City Hydrothermal Field near theMid-Atlantic Ridge emits fluids at 40 to 75 degrees Cand builds carbonate towers up to 60 m high.Lithotrophic bacteria isolated from deep hydrothermalvents include those that oxidize hydrogen sulfide aswell as nitrifying, hydrogen oxidizing, and iron andmanganese-oxidizing bacteria. Methylotrophic bacteria113113
Learning Ocean Science through Ocean ExplorationSection 6: Ocean Primary Productionoceanexplorer.noaa.govthat use methane as an energy source also occurthere. Those that use hydrogen sulfide are the moststudied, in part because they are symbionts in thegiant tubeworms. Many of the free-living lithotrophicbacteria form mats around the vent and are grazed upondirectly by animals, so they also contribute to primaryproduction around a deep vent.Cold SeepsWhere to Find MoreActivities on OceanPrimary Productivity114Cold water seeps form above methane hydrate deposits.Communities develop around methane seeps thatdepend on the energy from hydrogen sulfide andmethane captured by bacteria. Dense huge thickets oforganisms surround the seeps. Animals from the nearbyocean may come and feed here as well as those that liveonly in the seep ecosystem.This section includes several activities related directlyto primary production in the ocean—both by photosynthesis and chemosynthesis. Additional exercises foundon the OE web site or OE CD include: Message in the Bottles from the 2002 Arctic OceanExploration Rock Eaters of the Gulf of Alaska in ExploringAlaska’s Seamounts 2002 From the Gulf of Mexico to the Moons of Jupiter inthe 2002 Gulf of Mexico expedition Candy Chemosynthesis in Submarine Ring of Fire2002 It’s a Gas from Deep East 2001 and Hudson Canyon2002114
Learning Ocean Science through Ocean ExplorationSection 6: Ocean Primary Productionoceanexplorer.noaa.govLesson Plan 15Being Productive in the Arctic OceanFocusPrimary productivity and limiting factorsFocus QuestionWhat factors limit primary productivity in the ArcticOcean?Learning ObjectivesMaterials Five sets of Sample Data Cards – one for each student groupOne Data Summary Sheet for each groupAudio/visual Materials NoneStudents will identify the major factors that limitprimary productivity in the Arctic Ocean and willdescribe how these factors exert limiting effects.Teaching TimeStudents will infer which factors are limiting in adata set of potentially limiting factors and primaryproductivity.Five groupsAdditional Information for Teachers of DeafStudentsIn addition to the words listed as Key Words, the following words should be part of the vocabulary list:AlgaePhotosynthesisChemosynthesisThe words listed as Key Words are integral to theunit and will be used in the first step of the Learning Procedure. They are really the material that willbecome the basis of the lesson. There are no formalsigns in American Sign Language for any of thesewords and many are difficult to lipread. Having thevocabulary list on the board as a reference duringthe lesson will be extremely helpful.One or two 45-minute class periodsSeating ArrangementKey WordsPelagicBenthicZooplanktonPrimary productivityPhytoplanktonPARChlorophyll aBackground InformationThis activity focuses on primary productivity inthe pelagic realm of the Arctic Ocean. Primaryproductivity refers to the amount of organic matter,usually expressed as grams of carbon per squaremeter per day, produced by organisms that makefood from simple inorganic substances usingenergy from sunlight to conduct photosynthesisor the chemical reactions of chemosynthesis.Primary productivity in the Arctic Ocean is largelydue to photosynthesis carried out by microscopicdrifting algae called phytoplankton. Photosynthesisrequires photosynthetic organisms, light, carbon115
Learning Ocean Science through Ocean ExplorationSection 6: Ocean Primary Productionoceanexplorer.noaa.govdioxide, water, and mineral nutrients. Lack of anyone of these may limit photosynthesis or primaryproduction. Which factors limit primary productionin the Arctic Ocean? How much primary productionactually occurs? This activity uses data from ascientific paper: Smith, Jr., W. O. 1995. Primaryproductivity and new production in the NortheastWater (Greenland) Polynya during summer 1992.Journal of Geophysical Research 100: 4357-4370.It enables your students to examine the factors thatlimit primary production using real data.The Arctic Ocean is the smallest of the world’sfour ocean basins. It is not easily explored as it isalmost entirely covered with ice for eight monthsof the year, a drifting polar ice pack covers thecentral and western portions year-round, and seatemperature seldom rises above 0 C. Organismsliving in the water column between the oceansurface and the bottom, largely phytoplankton,conduct most of the primary production in thepelagic water. Melting sea ice allows increasedlight to enter the sea. Algae grow rapidly since thesun shines for 24 hours a day during the summer.Through photosynthesis, these phytoplanktonprovide energy for a variety of drifting animals(zooplankton) that include crustaceans and jellyfish.Zooplankton provide food for larger pelagicanimals including fishes, squids, seals, and whales.When pelagic organisms of any size die, theysettle to the ocean bottom as detritus and becomethe energy source for benthic organisms, includingsponges, bivalves, crustaceans, polychaete worms,sea anemones, bryozoans, tunicates, and ascidians.These animals are food for bottom-feeding fishes,whales, and seals.Learning Procedure1. Review the background information on the ArcticOcean with your students. Emphasize that the seaice, pelagic and benthic communities are connected in the food chain and that photosynthesisby microscopic algae (phytoplankton) provides theenergy for all the other organisms in these realms.116116Use the OE CD or web site for information on theArctic Ocean. You may mention that a few marinesystems, such as those in the vicinity of hydrothermal vents or cold water seeps, are not dependenton photosynthesis for energy, but rely on chemosynthesis instead. Check the OE CD or the website at agos/galapagos.html and welcome.html for information on thesesystems. If necessary, review the basic concepts ofphotosynthesis. Be sure students understand thatphotosynthesis is limited by whichever of the essential components is in limited supply.2. Students have data on Arctic Ocean primary productivity and measurements of the factors that may limitproduction. Ten data sets will be examined, representing samples that were taken at 10 different timesof the year. As each sample is examined, studentsare asked to explain the results in terms of what factors seem to be limiting primary productivity.3. Distribute the five sets of sample data cards to thestudent groups. One group should receive the IceCover cards, a second group should receive theChlorophyll a cards, a third group should receivethe PAR cards, a fourth group should receive theNitrate cards, and the fifth group should receive thePrimary Productivity cards. Each set should containone card for each of the 10 sampling days.4. Briefly discuss the meaning of each set of cards: Ice Cover cards show the percent of the seasurface that is covered with ice. PAR cards list the amount ofphotosynthetically active radiation - theamount of sunlight that is usable forphotosynthesis - as a percentage of themaximum radiation that occurs during theyear. Chlorophyll a cards show the amountof chlorophyll a - a measure of thephotosynthetic-capable algae present in thesurface seawater.
Learning Ocean Science through Ocean ExplorationSection 6: Ocean Primary Productionoceanexplorer.noaa.gov Nitrate cards list the amount of nitrogencontaining mineral nutrients present such asnitrate or ammonia. Primary Productivity cards show the amountof organic matter produced throughphotosynthesis at the sea surface.5. Working with the class as a whole, have eachgroup take turns reading its cards for SampleDay #1. List the readings on the Blank Data Summary Sheet. When each group has read theircards, discuss the results. Repeat this process fortwo more days. Then have the students fill in thesheet and decide as a group what the limitingfactor for each of the days from #4 to #10 isthat limits primary production. Then discuss theirthoughts as a class. Sample Day #1: This is a fairly high rate ofPrimary Productivity. Students should notethat there is no ice to block sunlight and PARis fairly high. The significance of Chlorophylla and Nitrate concentrations will becomeapparent as other days are examined. Sample Day #2: 50% of the sea surfaceis covered with ice which limits PrimaryProductivity to less than half the value onSample Day #1, even though the PAR andNitrate levels are higher and there areonly slightly fewer algae as indicated byChlorophyll a than on Sample Day #1.Reduction of sunlight by sea ice is a majorlimiting factor for primary productivity in theArctic Ocean. Sample Day #3: Primary Productivity againis much lower than on Sample Day #1. Acombination of ice cover and reduced PAR—perhaps a cloudy day—are probablyresponsible, since Nitrate and Chlorophyll alevels are similar to previous days. Sample Day #4: Primary Productivity is lowand the obvious cause is the greatly reducedlevel of Nitrate. Sample Day #5: Everything seems favorable,but Primary Productivity is low. The students may notice that PAR is nearly 100% andmay wonder whether there is such a thingas too much light. In the Arctic Ocean,photosynthetic algae can be adapted torather low light conditions. It is possible forphotosynthesis to be inhibited if these algaeare exposed to too much light.Sample Day #6: Low Primary Productivityagain; extensive ice cover is the likely cause.Sample Day #7: Time for inferences! Whenwould you expect ice to cover 100% ofthe sea surface? Winter, of course! So,PAR would be zero because night lasts 24hours in the polar winter. We would expectChlorophyll a and Primary Productivity to bepretty close to zero as well.Sample Day #8: Reviewing the preceding datasets, students should notice that Nitrate doesnot appear to limit Primary Productivity exceptwhen it is in very limited supply. Since PrimaryProductivity is relatively high and there is 30%ice cover, students could reasonably infer thatNitrate is not limiting in this case, so it could beany of the previous levels except 0.2.Sample Day #9: Low PAR is the key here. It isprobably early winter, so students might conclude ice cover is probably fairly high (above70%) and Primary Productivity is probablyquite low.Sample Day #10: Since all other factors seempretty favorable, yet Primary Productivityis low, students should suspect that Nitratelevels are low enough to be limiting.6. Have students write individual summaries offactors that limit Primary Productivity in the ArcticOcean.The BRIDGE du/bridge/plankton.html117
Learning Ocean Science through Ocean ExplorationSection 6: Ocean Primary Productionoceanexplorer.noaa.govThe “Me” ConnectionNational Science Education StandardsHave students write a short essay or prepare a brieforal presentation on how knowledge of primaryproductivity in the Arctic Ocean might benefit thempersonally, and/or why they think this knowledgeis (or is not) important. Ask students to share theirthoughts with the class. If they like whales, theyhave a good connection.Connection To Other SubjectsContent Standard A: Science As Inquiry Abilities necessary to do scientific inquiry Understanding about scientific inquiryContent Standard B: Physical Science Chemical reactionsContent Standard C: Life Science Interdependence of organismsContent Standard D: Earth and Space Science Energy in the Earth systemEnglish/Language Arts, MathematicsActivity developed by Mel Goodwin, PhD, TheHarmony Project, Charleston, SCEvaluationHave students write their own interpretations ofSample Days #6 – 10 before these are discussedin class.Additional information for teachers of deaf studentsdeveloped by Denise Monte, Teacher of the Deafand Audiologist, American School for the Deaf,West Hartford, ConnecticutExtensionsHave students use the OE CD or visit http://oceanexplorer.noaa.gov to learn about the deep ArcticOcean and to find out what organisms researchersactually find in the three realms.Have students research primary productivity intemperate and/or tropical ocean waters and comparethese data with primary productivity in the ArcticOcean.Resourceshttp://oceanexplorer.noaa.gov – the Arctic OceanExpedition daily documentaries and discoverieshttp://www.sciencegems.com/earth2.html – Science educationresourceshttp://www.martindalecenter.com/ – References on justabout education/learn.html – Links to many sites and activities aboutphotosynthesis118118
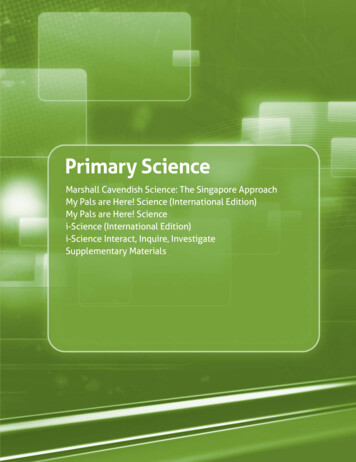
oceanexplorer.noaa.govLearning Ocean Science through Ocean ExplorationSection 6: Ocean Primary ProductionStudent HandoutICE COVER DATAICE COVER DATASample Day #1Sample Day #2Ice Cover 0%Ice Cover 50%ICE COVER DATAICE COVER DATASample Day #3Sample Day #4Ice Cover 50%Ice Cover 10%ICE COVER DATAICE COVER DATASample Day #5Sample Day #6Ice Cover 0%Ice Cover 70%ICE COVER DATAICE COVER DATASample Day #7Sample Day #8Ice Cover 100%Ice Cover 30%ICE COVER DATAICE COVER DATASample Day #9Sample Day #10Ice Cover GUESS!Ice Cover 15%119
Learning Ocean Science through Ocean ExplorationSection 6: Ocean Primary Productionoceanexplorer.noaa.govStudent Handout120PHOTOSYNTHETICALLYACTIVE RADIATION DATAPHOTOSYNTHETICALLYACTIVE RADIATION DATASample Day #1Sample Day #2PAR 75% of maximumPAR 78% of maximumPHOTOSYNTHETICALLYACTIVE RADIATION DATAPHOTOSYNTHETICALLYACTIVE RADIATION DATASample Day #3Sample Day #4PAR 45% of maximumPAR 76% of maximumPHOTOSYNTHETICALLYACTIVE RADIATION DATAPHOTOSYNTHETICALLYACTIVE RADIATION DATASample Day #5Sample Day #6PAR 98% of maximumPAR 79% of maximumPHOTOSYNTHETICALLYACTIVE RADIATION DATAPHOTOSYNTHETICALLYACTIVE RADIATION DATASample Day #7Sample Day #8PAR GUESS!PAR 82% of maximumPHOTOSYNTHETICALLYACTIVE RADIATION DATAPHOTOSYNTHETICALLYACTIVE RADIATION DATASample Day #9Sample Day #10PAR 10% of maximumPAR 79% of maximum
Learning Ocean Science through Ocean ExplorationSection 6: Ocean Primary Productionoceanexplorer.noaa.govStudent HandoutCHLOROPHYLL a DATACHLOROPHYLL a DATASample Day #1Sample Day #2Chlorophyll a 87 µg/lChlorophyll a 76 µg/lCHLOROPHYLL a DATACHLOROPHYLL a DATASample Day #3Sample Day #4Chlorophyll a 73 µg/lChlorophyll a 82 µg/lCHLOROPHYLL a DATACHLOROPHYLL a DATASample Day #5Sample Day #6Chlorophyll a 85 µg/lChlorophyll a 71 µg/lCHLOROPHYLL a DATACHLOROPHYLL a DATASample Day #7Sample Day #8Chlorophyll a GUESS!Chlorophyll a 76 µg/lCHLOROPHYLL a DATACHLOROPHYLL a DATASample Day #9Sample Day #10Chlorophyll a 5 µg/lChlorophyll a 73 µg/l121
Learning Ocean Science through Ocean ExplorationSection 6: Ocean Primary Productionoceanexplorer.noaa.govStudent Handout122NITRATE DATANITRATE DATASample Day #1Sample Day #2Nitrate 6.2 µmol/lNitrate 8.4 µmol/lNITRATE DATANITRATE DATASample Day #3Sample Day #4Nitrate 11.3 µmol/lNitrate 0.2 µmol/lNITRATE DATANITRATE DATASample Day #5Sample Day #6Nitrate 7.1 µmol/lNitrate 6.7 µmol/lNITRATE DATANITRATE DATASample Day #7Sample Day #8Nitrate 5.2 µmol/lNitrate GUESS!NITRATE DATANITRATE DATASample Day #9Sample Day #10Nitrate 7.6 µmol/lNitrate GUESS!
Learning Ocean Science through Ocean ExplorationSection 6: Ocean Primary Productionoceanexplorer.noaa.govStudent HandoutPRIMARY PRODUCTIVITY DATAPRIMARY PRODUCTIVITY DATASample Day #1Sample Day #2Surface Primary Productivity 9.3 mg C/m2/daySurface Primary Productivity 4.3 mg C/m2/dayPRIMARY PRODUCTIVITY DATAPRIMARY PRODUCTIVITY DATASample Day #3Sample Day #4Surface Primary Productivity 5.1 mg C/m2/daySurface Primary Productivity 3.4 mg C/m2/dayPRIMARY PRODUCTIVITY DATAPRIMARY PRODUCTIVITY DATASample Day #5Sample Day #6Surface Primary Productivity 4.3 mg C/m2/daySurface Primary Productivity 3.4 mg C/m2/dayPRIMARY PRODUCTIVITY DATAPRIMARY PRODUCTIVITY DATASample Day #7Sample Day #8Surface Primary Productivity GUESS!Surface Primary Productivity 6.5 mg C/m2/dayPRIMARY PRODUCTIVITY DATAPRIMARY PRODUCTIVITY DATASample Day #9Sample Day #10Surface Primary Productivity GUESS!Surface Primary Productivity 2.6 mg C/m2/day123
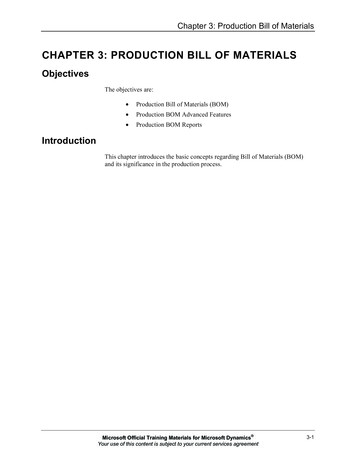
87645787573576GUESS718582737687PAR*Chlorophyll a(% of maximum)(µg/l)*photosynthetically active radiationIce Cover(% of surface)Sample l/l)Teacher’s Master Data Summary2.6GUESS6.5GUESS3.44.33.45.14.39.3Primary Productivity(mg C/m2/day)Learning Ocean Science through Ocean ExplorationSection 6: Ocean Primary Productionoceanexplorer.noaa.govTeacher Answer Key
PAR*(% of maximum)Ice Cover(% of surface)*photosynthetically active radiation10987654321Sample DayProductivity(µg/l)Chlorophyll aDATA SUMMARY SHEET(µmol/l)Nitrate(mg C/m2/day)Primaryoceanexplorer.noaa.govLearning Ocean Science through Ocean ExplorationSection 6: Ocean Primary ProductionStudent Handout125
Learning Ocean Science through Ocean ExplorationSection 6: Ocean Primary Productionoceanexplorer.noaa.govLesson Plan 16Chemosysthesis for the ClassroomFocusThe Key Words are integral to the unit but will bevery difficult to introduce prior to the activity. Theyare really the material of the lesson. There are noformal signs in American Sign Language for anyof these words and many are difficult to lipread.Having the vocabulary list on the board as a reference during the lesson will be extremely helpful. Itwill also be helpful to copy the vocabulary list andhand it out to the students to read after the lesson toreinforce what was covered as the six week projectcontinues.Chemosynthetic bacteriaFocus QuestionWhat changes affect succession in the developmentof chemosynthetic bacterial communities?Learning ObjectivesStudents will observe the development of chemosynthetic bacterial communities.Students will recognize that organisms modify theirenvironment in ways that create opportunities forother organisms to thrive.Students will be able to explain the process of chemosynthesis.Students will be able to explain the relevance ofchemosynthesis to biological communities in thevicinity of cold seeps.Additional Information for Teachers of DeafStudentsIn addition to the words listed as Key Words, the following words should be part of the vocabulary list:PhylumPolychaete wormHydrogen sulfideChemosynthetic bacteriaHydrocarbon gasesHemoglobinSeep GillsSedimentWinogradsky columnContinental marginsMethane126Materials Directions for setting up Winogradsky columns 126from eldwork/lessons/Winogradsky 5 8.pdfBlack mud from a local river, lake, or estuary,approximately 500 ml for each student groupWater from the same source used to obtain blackmud, approximately 3 liters for each studentgroup500-ml graduated cylinder for each student groupCalcium sulfate (plaster of Paris), 80 g for eachstudent group500-ml jar or beakerStirring rodStraw (hay) or small pieces of filter paper, 50 gfor each student groupSodium bicarbonate (baking soda), 4 g for eachstudent groupCrushed multivitamin pill, one for each groupPlastic wrapRubber bandsSource of artificial lightTape and markers for labeling graduated cylindersFlashlight with red cellophane over lens
oceanexplorer.noaa.gov Optional: microscopes and materials for makingwet mountsAudio/visual MaterialsNoneTeaching TimeOne 45-minute class period to set up columns,approximately 15 minutes at weekly intervals forsix weeks to make observations, and one 45-minuteclass period for presentation and discussion ofresultsSeating ArrangementGroups of four studentsKey WordsCold seepsMethane hydrate iceChemosynthesisBrine poolVestimentiferaTrophosomeSuccessionBackground InformationThis activity focuses on chemosynthetic bacteriasimilar to those that are the base of food websin cold seep communities. Black mud from alocal water body is incubated in a glass cylinder,called a Winogradsky column, with a source ofchemical energy from calcium sulfate and organicmaterial from straw or filter paper. A successionof chemosynthetic bacteria grow over a period ofsix weeks. This activity was originally developedby the Orange County Marine Institute/San JuanInstitute Activity Series and is available on NASA’sJet Propulsion Laboratory Ocean Planet web site fieldwork/lessons/Winogradsky 5 8.pdf.Deep-sea chemosynthetic communities occur wherehydrocarbon gases, often methane and hydrogensulfide and/or oil seep out of sediments. TheseLearning Ocean Science through Ocean ExplorationSection 6: Ocean Primary Productionareas, known as cold seeps, are common alongcontinental margins and, like hydrothermal vents,are home to many unique species. Typical featuresof the seep communities that have been studied sofar include mounds of frozen crystals of methaneand water called methane hydrate ice, that arehome to polychaete worms. Brine pools, containingwater four times saltier than normal seawater, alsooccur. Researchers often find dead fish floating inthe brine pool, apparently killed by the high salinity.Where hydrogen sulfide is present, large tubewormsknown as vestimentiferans (formerly classified asbelonging to the phylum Pogonophora, but recentlyPogonophora and Vestimentifera have been includedin the phylum Annelida) grow in clusters of millionsof individuals. These unusual animals lack a mouth,stomach, or gut. Instead, they have a large organcalled a trophosome, that contains chemosyntheticbacteria. Vestimentiferans have tentacles that extendinto the water. The tentacles are bright red due tothe presence of hemoglobin that absorbs hydrogensulfide and oxygen. The hemoglobin transportsthem to bacteria in the trophosome. These bacteriaproduce organic molecules that provide nutrition tothe tubeworm. A similar symbiotic relationship isfound in clams and mussels that have chemosyntheticbacteria living in their gills. Bacteria also liveindependently from other organisms in large bacterialmats. Coldwater seep communities also includesnails, eels, sea stars, crabs, lobsters, isopods, seacucumbers, and fish which likely use the tubeworms,mussels, and bacterial mats as food.The Gulf of Mexico has the largest fossil fuel reservoirin the continental U.S. Its geology has been intensivelystudied for more than 50 years. Yet cold seep communities were only discovered in the Gulf about 20 yearsago, and, as of 2001, their biology was examined atonly three sites less than 20 km apart.Learning Procedure1. Lead a discussion of deep-sea chemosyntheticcommunities. Contrast chemosynthesis withphotosynthesis. In both processes, organisms127
Learning Ocean Science through Ocean ExplorationSection 6: Ocean Primary Productionbuild sugars from carbon dioxide and ahydrogen source. This process requires energy;photosynthesizers obtain this energy from thesun, while chemosynthesizers obtain energyfrom chemical reactions. Discuss the variety ofchemical reactions that can provide this kind ofenergy. Contrast hydrothermal vent communitieswith cold seep communities. Visit ld seeps/ for a virtual tourof a cold seep community.oceanexplorer.noaa.govgrowth of other bacterial species. The processesthey observed in the Winogradsky columnsroughly models the development of deep-seachemosynthetic communities. Ask the studentsto speculate about what other organisms mightappear in the community if these processes weretaking place in the area from which the mud wascollected.The BRIDGE Connectionwww.vims.edu/BRIDGE/vents.html2. Challenge your students to make their ownchemosynthetic communities—closed ecosystemsin a bottle. Have them follow the steps given fieldwork/lessons/Winogradsky 5 8.pdf to set up two kinds ofWinogradsky columns, using locally-collectedblack mud. Divide the groups in half and assigneach group to either the light or the dark half.Cover each column tightly with plastic wrapand secure with rubber bands. One half of thecolumns will be placed in a darkened area andthe other in indirect light—not direct sunlight.Students should observe the light and darkcolumns weekly and record their observations.You may have them make wet mounts formicroscopic examination at
living in the water column between the ocean surface and the bottom, largely phytoplankton, conduct most of the primary production in the pelagic water. Melting sea ice allows increased light to enter the sea. Algae grow rapidly since the sun shines for 24 hours a day durin