Transcription
Application NoteSmall MoleculePharmaceuticalsAnalysis of Tween 80 by high‑performance liquid chromatographywith diode array detectionAuthorsJianxin Yu, Scott Citrowske,Nikki Carlson, andJacob StrangeAbbott Laboratories,Saint Paul, MN 55117John RhoadsAgilent Technologies, Inc.AbstractTween 80 is commonly used as a stabilizing excipient in pharmaceuticalmedications, or an anticalcification agent for tissues treatment. The quantificationof Tween 80 is challenging because of the heterogeneous mixtures and lack ofgood chromophore. This study developed a simple and fast high-performance liquidchromatography (HPLC) method using an Agilent InfinityLab Poroshell 120 EC-C18column and max plot diode array detection (DAD) to analyze Tween 80 in 0.02 Mphosphate buffer. The quantitative determination is based on the sum of peak areasof peaks in the Tween 80 elution region. Precision, accuracy, linearity, and limit ofquantitation/detection experiments gave acceptable results during the evaluation ofthe method. This method could be applied to various aqueous solutions containingTween 80 for quality control and stability monitoring.
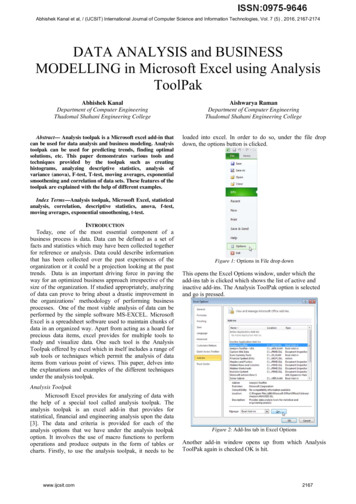
IntroductionTween 80, also known as polysorbate 80,is a common nonionic surfactant,emulsifier, stabilizer, and solubilizerwidely used in pharmaceuticalmedications, food products, cosmetics,vitamins, vaccines, intravenouspreparations, lotions, and soaps. Inprotein formulations, Tween 80 and otherpolysorbates can minimize adsorptionto surfaces, reduce the rate of proteindenaturation, and increase drug solubilityand stability. Tween 80 can be alsoused in pre- and postglutaraldehydetissue (fixation) treatments to actas anticalcification agent for tissuesprepared for tissue heart valves1. Due tothese critical roles, accurate quantitationof Tween 80 is needed to ensure productquality.Tween 80 is a mixture of partial estersof fatty acids, mainly oleic acid, withsorbitol and its anhydrides ethoxylatedwith approximately 20 moles of ethyleneoxide for each mole of sorbitol andsorbital anhydrides. Figure 1 shows itsmolecular structure. As macromolecularcompounds, the quantification ofpolysorbates is difficult because of theheterogeneous mixtures and lack ofUV chromophore. Several methods toquantitate polysorbate 80 have beendescribed in literature. Indirect methodsbased on the chemical transformationof polysorbate 80, such as alkali inducedhydrolysis into oleic acid, have beenreported2,3. These methods are laboriousand time-consuming, involving 6 to18 hours of digestion at an elevatedtemperature of 40 to 60 C. A few directmethods for analysis of Tween 80 havebeen developed using HPLC separationcoupled with different detections suchas evaporative light scattering detection(ELSD)4–6, charged aerosol detection(CAD)7, and mass spectrometry (MS)8.2OOHOO zOOOOwOHxOHyw x y z 20Figure 1. Molecular structure of Tween 80.Some researchers tried not to separateand use a single chromatographic peakfor quantitation4,9. These methods mayneed complex equipment or could not beused to monitor the stability of Tween 80solutions.This study introduces a simple andfast method for the determination ofTween 80 in aqueous solution usingreversed‑phase HPLC separation basedon an Agilent InfinityLab Poroshell120 EC‑C18 column with diode arraydetection. The suitability of the methodfor the determination of Tween 80 inphosphate buffer has been evaluated bytesting its specificity, linearity, precision,sensitivity, and accuracy. This methodprovides an option for scientists becausediode array detection is more commonlyused than ELSD, CAD, and MS detectorsfor HPLC analysis.ExperimentalMaterials and instrumentationTween 80 standard was obtained fromUS Pharmacopeial Convention (Rockville,MD). Tween 80 from Fisher Chemical(Fair Lawn, NJ) was used to prepareTween 80 samples. Acetonitrile (HPLCgrade), sodium phosphate monobasicdihydrate (certified crystalline), sodiumphosphate dibasic dihydrate (certifiedcrystalline), and phosphoric acid ( 85 %)were purchased from Fisher Chemical.Water was prepared with a Milli-Qwater purification system (Millipore,Bedford, MA).Tween 80 samples were analyzed usingan HPLC system coupled to a diode arraydetector (DAD). An Agilent InfinityLabPoroshell 120 EC‑C18 column,3.0 100 mm, 2.7 µm (p/n 695975‑302A)(Agilent Technologies, Santa Clara,CA) was used to elute Tween 80peaks. The DAD was set at 1.2 nmresolution, scanning from wavelength195 to 400 nm. The max plot signalwas collected for quantitation. A 20 μLsample amount was injected usingan isocratic mobile phase consistingof mobile phase A: water with 0.1 %phosphoric acid, and mobile phase B:acetonitrile with 0.1 % phosphoric acid, ata constant ratio of A:B 20:80. Throughoutthe analysis, the column was kept at30 C, and the mobile phase flow ratewas maintained at 0.4 mL/min.Results and DiscussionOptimization of the analysisA few HPLC columns and mobile phasessuch as an HPLC C18 column havebeen recommended4 with gradientsstarting at a water/methanol ratio of70:30 and, at four minutes, changing towater/methanol 10:904. Neither a singlepeak nor complete elution of Tween 80was obtained. The current conditionsdescribed above using an InfinityLabPoroshell 120 EC-C18 column and maxplot diode array detection resulted in afast and relatively simple approach toanalyze the concentration of Tween 80 inphosphate buffer.
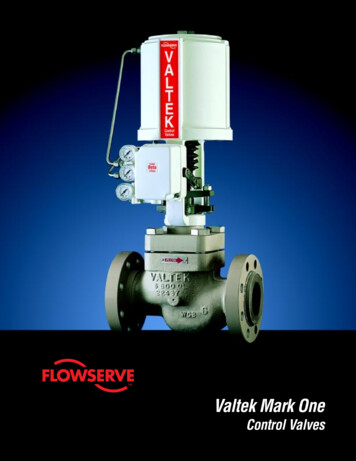
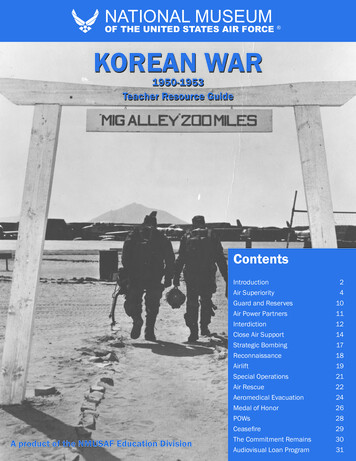
Can one peak or one group of peaks inthe max plot chromatogram be usedto quantitate Tween 80? Tween 80solutions at 10 mg/mL prepared fromUSP Tween 80 standard and FisherTween 80 were compared, and theirmax plot chromatograms are shownin Figures 2 and 3A, respectively. Thechromatograms show varying intensityof peaks at similar retention times eventhough the concentration of Tween 80was comparable, 10.033 mg/mL of USPTween 80 against 10.145 mg/mL ofFisher Tween 80.AU0.200.150.100.0500246810Time (min)1214161820Figure 2. The chromatogram of USP Tween 80 standard at 10 mg/mL in 0.02 M phosphate bufferobtained by max plot diode array detection from 195 to 400 nm.A0.350.300.25AUWeak UV absorbance of Tween 80 haslimited the analysis of Tween 80 by afixed single wavelength. M. Klein; et al.10used a gel filtration chromatography(GFC) column and UV at 245 nm toanalyze Tween 80. The sensitivity forKlein’s method was poor. When wetried to extract a chromatogram at245 nm from the DAD data, a surprisingchromatogram was obtained. Figure 3presents the comparison of the maxplot of a Tween 80 sample and itschromatogram extracted at 245 nm. Theextracted chromatogram at 245 nm hadfewer peaks than its original max plotchromatogram, and all peaks in the maxplot chromatogram displayed weak UVabsorbance at 245 nm. It is clear thatmax plot diode array detection is a betterchoice for Tween 80 analysis.0.250.200.150.100.0500246810Time (min)1214161820246810Time (min)1214161820B0.350.300.25AUA max plot chromatogram is generatedby plotting the maximum spectralabsorbance measured at each timepoint. A max plot chromatogram allowsone to see all the chromatographicpeaks in a sample regardless ofλmax (the wavelength at maximumabsorbance). Figure 2 shows a maxplot chromatogram of USP Tween 80standard in 0.02 M phosphate buffer.0.200.150.100.0500Figure 3. The comparison of the max plot (A) and its extracted chromatogram at 245 nm (B) for aTween 80 sample at 10 mg/mL (at the same scale) in 0.02 M phosphate buffer.3
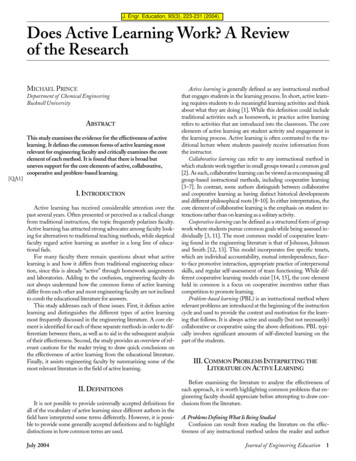
Group 1: 1.8 to 3.7 minutes Group 2: 3.7 to 5.3 minutes Group 3: 5.3 to 6.8 minutes Group 4: 6.8 to 11.6 minutes Group 5: 11.6 to 14.2 minutesThe ratio between two Tween 80materials at similar retention time groupsdiffers from 0.99 (10.033/10.145),indicating that these individual groupsof peaks could not represent the wholemixture of Tween 80. The summed peakarea from 1.8 to 14.2 minutes was alsoused as a comparison, with the resultingratio being 0.98 to 0.99, which is veryclose to the ratio of the concentrationof Tween 80 in these two solutions.Therefore, it is recommended to usesum of peak areas of peaks from 1.8to 14.2 minutes for the quantitation ofTween 80 in this method.Analysis of Tween 80 inphosphate bufferThe proposed analytical methodwas evaluated for the determinationof Tween 80 in 0.02 M phosphatebuffer used for tissue treatment. Theparameters evaluated were linearity,specificity, accuracy, precision, and limitof quantitation (LOQ).Linearity: The linearity of response wasassessed by injecting Tween 80 standardsolutions prepared in 0.02 M phosphatebuffer. The concentration range ofTween 80 investigated was 10–200 % ofthe theoretical target Tween 80 content(target 10 mg/mL, therefore, range 1 to 20 mg/mL). The sum of all peakareas of each standard solution againstTween 80 concentrations (1.0, 2.5, 5.0,10, 15, and 20 mg/mL) were plotted byTable 1. Ratio of total peak area of each group of peaks.Ratio of peak area of Tween 80 from USP/FisherGroup of peaksRep 1Rep 2Rep 3Rep 4Rep 5%RSDGroup 1 (1.8–3.7 minutes)1.941.951.981.971.970.9 %Group 2 (3.7–5.3 minutes)0.790.800.790.790.800.7 %Group 3 (5.3–6.8 minutes)2.232.192.212.192.190.9 %Group 4 (6.8–11.6 minutes)0.810.820.820.800.821.1 %Group 5 (11.6–14.2 minutes)0.770.780.770.750.771.1 %Sum of peak area (1.8–14.2 minutes)0.980.990.990.980.990.6 %The two solutions contained USP Tween 80 at 10.033 mg/mL and Fisher Tween 80 at 10.145 mg/mL,respectively. The ratio of their concentrations is 0.99. 10711109876543210y 4.57e 006x 6.06e 005R2 0.999902R 0.999951012345Figure 4. Linear plot and equation.4linear regression. The linear equationwas y (4.57 106)x (6.06 105), withcorrelation coefficient, R2 0.999951(see Figure 4 for details). The percentdeviation of individual levels from lowconcentration to high concentrationwas –3.8, –1.0, 0.2, 0.4, 0.8, and –0.5 %.The results for linearity show that themethod has excellent linearity in therange of 1 to 20 mg/mL of Tween 80 in0.02 M phosphate buffer.AreaTable 1 presents the ratio of total peakarea of each group if we divided onechromatogram into five groups of peaks:678910 11Amount121314151617181920
Accuracy: Accuracy was evaluatedby analyzing Tween 80 test solutionsprepared at approximately 10 %(low), 100 % (mid), and 160 % (high)of Tween 80 target concentration10 mg/mL in 0.02 M phosphate buffer.Table 2 shows the measured amountand prepared amount, percent recovery,mean recovery, and %RSD of thereplicates for each level. The resultsshow that the %RSD (n 3) at low,mid, and high levels is 11, 1, and 1 %,respectively.phosphate buffer; the recovery obtainedfor three replicates was 96, 111, and143 %, with 20 %RSD. The %RSD is a bithigh, therefore, the LOD is estimated tobe 0.1 mg/mL. As for LOQ, linearity andaccuracy results indicate that the LOQ forthe method is approximately 1 mg/mL ofTween 80 in the buffer.Specificity: Specificity was assessedby injecting sample solution, 0.02 Mphosphate buffer (matrix), and Tween 80standard solution at 1 mg/mL in 0.02 Mphosphate buffer. The injection of thesample matrix had weak and broadpeaks that could not be integrated bythe software. If they were integratedmanually, the sum of peak areas wasless than 5 % of the sum peak areasof the lowest calibration standard ofTween 80 (1 mg/mL). This could becaused by carryover due to the stickinessof Tween 80. To reduce material buildupin the column, an acetonitrile injectionand column flush (100 % mobile phaseB) after each sequence could behelpful. If sample solutions are closeto 10 mg/mL, the effect of carryover isnegligible.Table 2. Accuracy results.LevelsLOQ and limit of detection (LOD)Since Tween 80 has multiple peaks, it isimpossible to estimate the method LODand LOQ based on signal-to-noise ratio ofthe peaks. Tween 80 standard solutionswere diluted to 0.1 mg/mL in 0.02 MThis method could be used formonitoring the stability of Tween 80sample and standard solutions. Figure 5compares a Tween 80 standard solutionat 10 mg/mL to the solution beingre‑injected after five days with a piercedcap at room temperature. The peaks at6.5, 8, and 12 minutes grew, while thepeaks at 2 to 5 minutes decreased. Howthe solution changed, and what waschanged is beyond this study.MeasuredTheoreticalconcentration (mg/mL) concentration (mg/mL)Recovery(%)Low 15,007,7411.12721.0145111.1 %Low 25,318,1931.19711.0284116.4 %Low 34,167,6630.93811.007393.1 %Mid 144,297,6969.971410.145098.3 %Mid 245,302,50210.197610.284099.2 %Mid 345,041,30210.138810.0730100.7 %High 172,116,90916.233516.440098.7 %High 271,863,77316.176516.463098.3 %High 374,398,91916.747116.873099.3 %0.40Meanrecovery (%)RSD106.9 %11 %99.4 %1%98.8 %1%A0.350.30AU0.250.200.150.10Method precision0.05000.40246810Time (min)1214161820246810Time (min)1214161820B0.350.300.25AUMethod precision was evaluated duringone analytical run by the preparation andanalysis of six replicates from the samehomogenous sample solution. The %RSDof the six results was calculated to be0.3 %, which is much lower than the 2 to5 % requirement of method precision fora typical HPLC method .Peak areaStability0.200.150.100.0500Figure 5. Comparison of a Tween 80 standard solution at 10 mg/mL (A) to the solution being re-injectedafter five days with a pierced cap at room temperature (B).5
ConclusionsReferencesA fast and simple HPLC method using anInfinityLab Poroshell 120 EC‑C18 columnand max plot diode array detection hasbeen developed to analyze Tween 80 in0.02 M phosphate buffer. The methodis accurate, precise, and sensitive. Awide calibration range could apply themethod to various aqueous solutions,such as therapeutic protein formulations,if appropriate sample pretreatment weremade. In addition, the method can beused to study the stability of Tween 80solutions.1.Yperman, J. Cell Repopulation ofBioprosthetic Heart Valves, (LeuvenUniversity Press, Belgium, 2006), 77.2.Hu, M.; et al. J. Chromatogr. A 2003,984, 233–236.3.Adamo, M.; et al. Chromatogr. B2010, 878, 1865–1870.4.Nair, L. M., et al. J. Chromatogr. A2003, 1012, 81–86.5.Nayak, V. S.; et al. Chromatogr. Sci.2012, 50, 21–25.6.Wu, Y.; et al. AOAC International2010, 93, 917–921.7.Shi, S.; et al. Anal. Bioanal. Tech.2015, 6, 245–252.8.Zhang, R.; et al. Chromatogr. Sci.2012, 50, 598–607.9.McCarthy, S. M. Waters ApplicationNote, 720005323EN, Mar 2015.10. Klein, M.; Preston, J. PhenomenexApplication Note, App ID 23389.www.agilent.com/chemThis information is subject to change without notice. Agilent Technologies, Inc. 2018Printed in the USA, March 29, 20185991-9188EN
good chromophore. This study developed a simple and fast high-performance liquid chromatography (HPLC) method using an Agilent InfinityLab Poroshell 120 EC-C18 column and max plot diode array detection (DAD) to analyze Tween 80 in 0.02 M phosphate buffer. The qua