Transcription
International Journal of Scientific & Engineering Research Volume 12, Issue 5, May-2021ISSN 2229-5518712Analysis of Portfolio Rebalancing and TechnicalIndicatorsSamruddhi Bhosle, Pranav Vibhandik, Neha Kahane, Snehal Patil, Amol DumbareAbstract— Stock Market is a scenario where investments can yield high rewards. However, each investment in any kind of financial marketcomes with a significant amount of risk for a period of time, a lot of interest has been diverted towards reducing risk associated in theinvestment and maintaining the risk to reward ratio as high as possible. In this article, we represent strategies and factors for rebalancingportfolio’s that can accommodate changes as per the changes in the financial market environment to reduce the risk. Rebalancing is theprocess of buying and selling portions of your portfolio in order to set the weight of each asset class back to its original state. It is a weightingmethod of as asset that includes purchasing and selling assets in a portfolio regularly in a specific period of time to preserve an initial ordesired amount of asset allocation or risk.Index Terms— CAGR, Indicators, Investment, Maximum Drawdown, Portfolio, Rebalancing, Risk to Reward, Sharpe ratio, Stock Market.—————————— ——————————1 INTRODUCTIONEach layer of the portfolio addresses a particular investmentgoal, independent of the other investment goals. Investorstarget low-risk investments like cash and money marketfunds to preserve wealth, they target bonds and dividend-paying stocks to provide income, and they target risky investmentslike emerging market stocks and IPOs to have a chance to getrich . Opportunities to reduce risk by combining assets withlow correlations may be neglected and inefficient investingmay result from offsetting positions in the various layers.Portfolio rebalancing is a powerful risk-control strategy.Over time, as a portfolio’s different investments produce different returns, the portfolio drifts from its target asset allocation,acquiring risk and return characteristics that may be inconsistent with an investor’s goals and preferences. A rebalancingstrategy addresses this risk by formalizing guidelines abouthow frequently the portfolio should be monitored, how far anasset allocation can deviate from its target before its rebalanced,and whether periodic rebalancing should restore a portfolio toits target or to some intermediate allocation.This paper establishes a framework for developing a portfolio-rebalancing strategy. We start by exploring various rebalancing decisions and a portfolio’s risk and return characteristics. Investors select a rebalancing strategy that balances theirwillingness to assume risk against returns net of the cost of rebalancing. We also explore a second important determinant ofthe appropriate rebalancing strategy the characteristics of theportfolio’s assets. For example, high correlation among the returns of a portfolio’s various assets reduces the risk that theportfolio will drift from its target allocation, thus limiting theneed to rebalance.2 PORTFOLIO REBALANCING AND �———— Samruddhi Bhosle is currently pursuing degree program in Computer engineering in Pimpri Chinchwad College of Engineering and Research, Pune,India PH-9921496929. E-mail: samruddhi.dattatray@gmail.com Pranav Vibhandik is currently pursuing degree program in Computer engineering in Pimpri Chinchwad College of Engineering and Research, Pune,India PH-8055417849. E-mail: pranav.vibhandik3@gmail.com Neha Kahane is currently pursuing degree program in Computer engineeringin Pimpri Chinchwad College of Engineering and Research, Pune, India Snehal Patil is currently pursuing degree program in Computer engineeringin Pimpri Chinchwad College of Engineering and Research, Pune, India Prof. Amol Dumbare Pimpri Chinchwad College of Engineering and Research, Pune, IndiaPortfolio management (PM), to be brief, the management ofbasket of stocks and (or) bonds, is the art of selecting the rightinvestment policy for the investor in terms of maximum returnat a given risk level. Financial theory suggests a wide range ofmotives for portfolio rebalancing: one of the widely reportedrationales is the fact that investor is passively exposed to greatermarket risk when realized return on financial assets result inmechanical variations in portfolio allocation. This risk is managed by actively rebalancing his/her portfolio when asset returns change over time. The periodical resetting of weights ofasset classes - stocks and bonds - in the portfolio is one of thecontroversial aspects of portfolio management. Rebalancing ofportfolio often involves taking profit from outperforming assets(so as to avoid overweighting) and buying underperforming assets. Portfolio rebalancing helps investors achieve their investment goals and avoid the common investment mistakes. Thereare two major benefits of portfolio rebalancing the first benefitis risk control which maintains the asset allocation as its originaltarget. The second benefit is the potential return which can beachieved by buy-low/sell-high opportunities.Portfolio rebalancing is like a tune-up for your car: it allowsindividuals to keep their risk level in check and minimize risk.Thus, rebalancing is the process of buying and selling portionsof your portfolio in order to set the weight of each asset classback to its original state. In addition, if an investor's investmentstrategy or tolerance for risk has changed, he or she can use rebalancing to readjust the weightings of each security or assetclass in the portfolio to fulfill a newly devised asset allocation.3 MATHEMATICAL RATIOS AND KPI’SIn this section, some risk management ratios and KPI’s (KeyPerformance Indicators) will be discussed which will be usedfor calculations of portfolio rebalancing. For rebalancing yourportfolio, the goal is to align your portfolio with desired assetIJSER 2021http://www.ijser.org
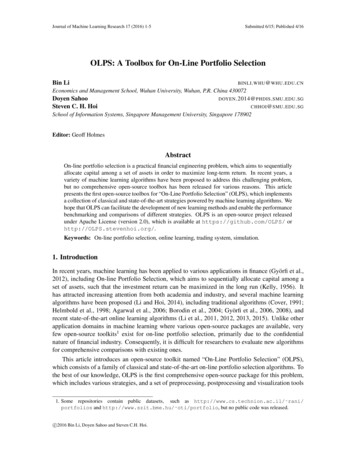
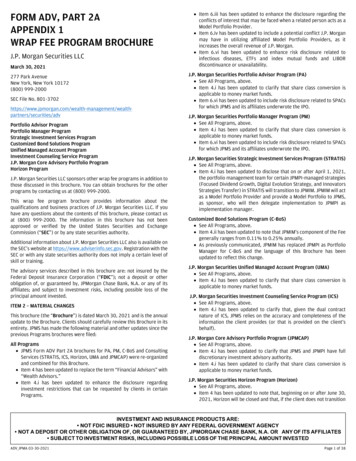
International Journal of Scientific & Engineering Research Volume 12, Issue 5, May-2021ISSN 2229-5518713allocation. As we invest over time its desired that our asset allocation will change. As our goal shifts our time horizon maychange and so as our risk tolerance. Hence by using this ratiosand KPI’s we can calculate our risk for a specific asset.Where:Variance (Pav – Pi)2 / nPav Mean PricePi Daily Stock Price on ith day3.1 CAGR(Compound Annual Growth Rate)Hence the annualize volatility can also be written as:Compound annual growth rate (CAGR) is the rate of return that would be required for an investment to grow from itsbeginning balance to its ending balance, assuming the profitswere reinvested at the end of each year of the investment’slifespan.CAGR (EV / BV)1/n – 1(1)Where:EV Ending ValueBV Beginning Valuen Number of yearsCAGR can be used in portfolio rebalancing, as it is the mostaccurate way to calculate and determine returns of anythingthat can rise or fall in a value of time. We can use CARG of twoalternative assets in order to check which stock performed wellagainst the other in the markets.This formula is continuous compounding which means thatall the profits are being reinvested continuously. CAGR provides ease of comparison between different trading strategies.It does not reflect investment risk and therefore should alwaysbe used in conjunction with a volatility measure.Annualized volatility 252 ( (Pav – Pi)2 / n)(3)3.3 Sharpe / Sortino ratioSharpe ratio is the measure of risk-adjusted return of a financialportfolio. A portfolio with a higher Sharpe ratio is consideredsuperior relative to its peers. The ratio is the average returnearned in excess of the risk-free rate per unit of volatility or total risk. Sharpe ratio is a measure of excess portfolio return overthe risk-free rate relative to its standard deviation.It gives information about both risk and return simultaneously. Sharpe has become industrial standard for measuring theperformance or measuring the suitability of particular fund orstrategy.Sharpe Ratio (Rp – Rj) / Av(4)IJSERWhere:Rp Return of portfolioRi Risk free rateAv Standard deviation of portfolio’s excess returnA good sharpe ratio is considered as the below following table:3.2 Annualized Volatility(AV)Volatility of a strategy is represented by a standard deviation ofthe returns. This captures the variability of the returns from themean return. Measuring the volatility of trading strategy welook at the daily return or monthly returns (or whichever timeframe you prefer working with), then we try to see how variablewere the returns compared to mean return. If your CAGR ishigh and volatility is also high that means your returns is compensated by the risk you are taking.(higher the volatility riskierthe security). If you are working with daily data, to calculatevolatility you will calculate the daily returns and you will findsd (standard deviation) of those returns, it will give you volatility. Annualization is achieved by multiplying the volatility withsquare root of the annualization factor.1.2.3.4.Table 1 Sharpe Ratio Parameters3.4 Maximum DrawdownA maximum drawdown (MDD) is the maximum observedloss from a peak to a trough of a portfolio, before a new peakis attained. Maximum drawdown is an indicator of downside risk over a specified time period.To annualize daily volatility multiply by sqrt (252) – asthere are 252 trading days in a year.To annualize weekly volatility multiply by sqrt (52) – asthere are 52 trading weeks in a year.To annualize monthly volatility multiply by sqrt (12) – asthere are 12 trading months in a year.It does not capture the tail risk.Annualized Volatility is represented as:Annualized Volatility Formula 252 Variance(2)IJSER 2021http://www.ijser.orgFigure 1 Maximum Drawdown
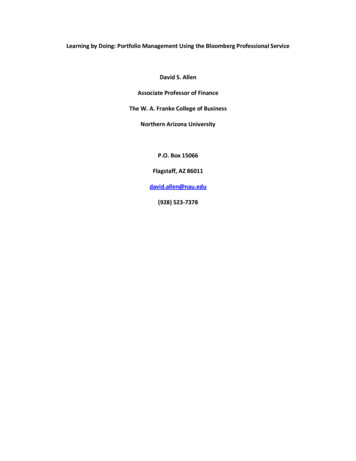
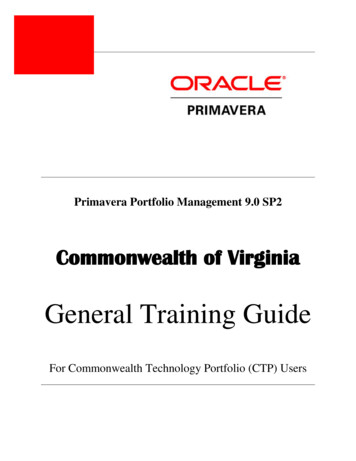
International Journal of Scientific & Engineering Research Volume 12, Issue 5, May-2021ISSN 2229-5518Largest percentage drop over a specified time period i.e. distance between peak and trough in the line curve of the asset.Investment with longer back testing period will likely havelarger max drawdown and therefore caution must be applied incomparing across strategies. The formula for maximum drawdown is:MDD (Trough Value Peak Value) / Peak Value (5)Maximum drawdown (MDD) measures the maximum fallin the value of the investment, as given by the differencebetween the value of the lowest trough and that of the highest peak before the trough.By measuring the difference between the highest peak andthe lowest trough values of an investment, MDD shows thevolatility of its value in the past, which provides an almostaccurate way of predicting future price movements.In addition to associated risk, maximum drawdown alsoacts as an indicator for market performance.3.5 Calmar Ratio714Under this strategy, the asset allocation of the portfolio driftsrandomly along with the market movements and the marketwill rebalance the asset allocation. There are a variety of waysto find buy-and-hold stocks. The asset allocation is allowed tovary significantly from the starting allocation as risky assets,such as stocks, increase or decrease. The portfolio becomesmore aggressive as stocks rise and you let the profits ride, nomatter how high the stock value gets. This strategy also presents benefits like with lower costs like no taxes, trading or brokerage fees and commission.For example below, we have chosen a monthly rebalancingoption (periodic rebalancing) with the intention of allowingonly minor deviation from the investment strategy in order tocreate a version of rebalancing that shows as much distinctionfrom a buy-and-hold approach as possible. However, most ofthe strategies tend to more closely resemble a buy-and-hold approach in terms of how they work.IJSERThe Calmar ratio is a formula that measures the performance ofan investment fund compared to its risk. It is commonly usedas a risk-adjusted measure in the selection of investments. TheCalmar ratio is determined by taking the investment annualrate of return and dividing it by its maximum drawdown. Theformula for calmar ratio is:Calmar Ratio Rp – Ri / Maximum Drawdown(6)Where:Rp Portfolio returnRi Risk-free rateRp – Ri Annual rate of returnFigure 2 Buy and Hold PerformanceThe higher the calmar ratio the better it is. The calmar ratio of3.0 to 5.0 is often recommended as very good.The buy and hold approach gives more returns over a period of time. The volatility of buy and hold approach is lessas compared to the other rebalancing strategies. The maximum potential loss of other strategies is also higher due tohigh volatility as compared to the buy and hold strategy.Based on the risk metrics, the buy-and-hold strategy wouldhave required the investor to have lower risk ability comparedto the rebalancing approach. It may also be astonishing thatboth approaches were similar even though the buy-and-holdapproach drifted significantly from the neutral allocation multiple times. Hence the buy and hold has an edge over the otherstrategies due to less volatility and keeping the portfolio morestable with minimum risk and more returns.4 REBALANCING METHODS4.2 Buy and Hold Rebalancing Strategy4.1 Rebalancing Approach Buy and HoldThe rebalancing in buy and hold strategy will be done on thebasis of the output values calculated of a specific stock using therisk management ratios and KPI’s (Key Performance Indicators)mentioned above. If a stock is performing good by taking intoconsideration of the KPI’s value then that stock will be pickedor replaced with the worse performing stock in the portfolio.Choose a particular set of stocks from the universe of stocks The Calmar ratio measures the performance of an investment fund – such as a hedge fund – compared to its risk.It aims to demonstrate the amount of risk required to obtain a return. It will help investors to balance their risk appetite with their investment decisions.The ratio cannot be adjusted to various time horizons;hence, portfolios must have the same period of backtesting.Rebalancing is often thought of as a return enhancer. However, it can also be thought of as a risk reducer, particularlyfor those investors who employ a buy-and-hold approach.The objective of buy-and-hold is to buy the initial allocationmix and then hold it indefinitely, regardless of performance.IJSER 2021http://www.ijser.org
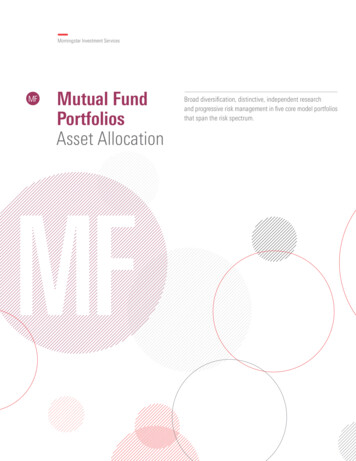
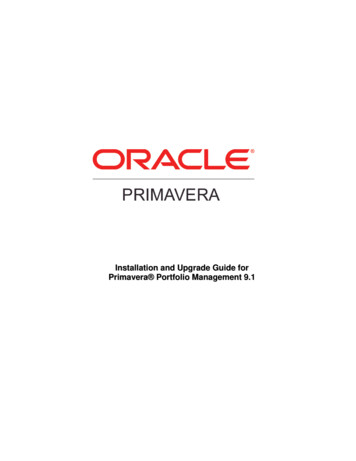
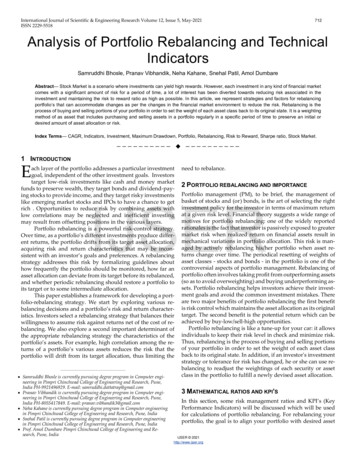
International Journal of Scientific & Engineering Research Volume 12, Issue 5, May-2021ISSN 2229-5518(Large cap, mid cap, small cap, industry specific, factor specific,etc.) and stick to the group of stocks as the source for your portfolio for entire duration of back testing. This particular set ofstocks will be fixed and the portfolio will be rebalanced amongthem based on their performance. Investor has to build/set afixed individual position size for long positions only by picking‘M’ number of stocks based on monthly returns which will begiven by KPI’s. As the position sizing is fixed every single position for the ‘M’ number of stocks will be same. For consideration if the number of stocks ‘M’ is 5 and the total portfolio valueis 5 lakh rs then each individual position will of 1 lakh rs respectively. The portfolio will now dirft according to the market conditions for a period of 1 month. After a period of a month basedon the performance of the M stocks the portfolio will be rebalanced. The worst performing N number stocks will be replaced with the top performing N number of stocks from theset with keeping the total M number of stocks in the portfolioconstant with respect to maintaining the position size of eachindividual stock same.If a particular stock X is performing well and giving good returns then that stock can be selected again. For consideration ifN stocks are removed from the portfolio and (M–N) are replaced with them then that stock X will be selected again in (MN) number of stocks. Hence, the investor will have 2 positionsof a single particular stock X with other 3 stocks in the portfoliohaving same position sizing.The following are the results by comparing DJI (Dow Jones Index) with Buy and Hold portfolio rebalancing strategy:Three KPI’s and risk management ratios CAGR, Sharpe ratio and Maximum Drawdown are calculated for a period oftime for comparing the results.715By plotting the returns on a line chart it clearly shows that thestrategy is having a consistent and higher rate of return than theDJI index. As the chart shows the strategy is moving in a similarkind with the DJI index but with a higher rate of return whichclearly states that the Buy and Hold rebalancing strategy is having an edge over the market in terms of the rate of return for theportfolio.5 RESULT AND DISCUSSIONWe had backtested the rebalancing strategy and applied it ondifferent time period to check whether this strategy performswell in each time period and gives consistent return on investment with minimum risk. A set of stocks from NSE (NationalStock Exchange) has been taken. All the stocks are of differentsector and industries. The Buy and Hold rebalancing strategywill be backtested on the following set of stocks only by including and excluding them in the portfolio for rebalancing purpose.The following is the set of stocks picked up from NSE:RELIANCE.NS, TCS.NS, HDFCBANK.NS, INFY.NS, HINDUNILVR.NS, HDFC.NS, ICICIBANK.NS, S,SBIN.NS, ASIANPAINT.NS, WIPRO.NS, MARUTI.NS, AXISBANK.NS, LT.NS, DMART.NS, ADANIGREEN.NS, ULTRACEMCO.NS, BAJAJFINSV.NS, HDFCLIFE.NS, SUNPHARMA.NS, TITAN.NS, ONGC.NS, ADANIPORTS.NS, BAJAJ AUTO.NS,TATAMOTORS.NS,POWERGRID.NS,M M.NSIJSERBy using, the rebalancing strategy on the above mentioned set of stocks the following results were obtained by rebalancing the portfolio in a daily, weekly and monthly periodof time and were compared with the NSE index:Table 2 DJI and Buy and Hold KPI values5.1 Daily RebalancingTable 3 Daily Rebalancing ResultsThe numbers and results clearly reflect that CAGR, Sharperatio and Maximum Drawdown of the Buy and Hold portfoliorebalancing strategy is giving more returns than the DJI.Figure 3 Index vs Strategy ReturnIJSER 2021http://www.ijser.org
International Journal of Scientific & Engineering Research Volume 12, Issue 5, May-2021ISSN 2229-5518716In weekly rebalancing the CAGR, Sharpe and Maximum drawdown were greater for the Buy and Hold strategy than that ofthe index and the chart also supports as we can see the returnsat the end of the strategy were greater than the index. The performance of the strategy at the starting was less but after a certain period of time there was a sudden increase in the performance of the strategy which kept on increasing gradually.5.3 Monthly RebalancingTable 5 Monthly Rebalancing ResultsFigure 4 Daily RebalancingAs we can clearly see the strategy return in daily period oftime is way more than the index return in terms of the outputof the ratios and as well as by plotting it on a chart. The valueof CAGR, Sharpe and Maximum drawdown is greater for theBuy and Hold strategy than that for the index which in termprovides more returns as it can also be seen in the chart above.For a period of time the strategy and index returns were increasing gradually and similarly but after a period of time there wasas sudden increase in the returns for the strategy which keptincreasing over a period of time.5.2 Weekly RebalancingIJSERTable 4 Weekly Rebalancing ResultsFigure 6 Monthly RebalancingIn monthly period of rebalancing, the sharpe ratio forstrategy was less than that of the index but the CAGR and Maximum drawdown for the strategy were greater than the indexand in terms of the final returns, the strategy performed wellthan the index after a certain period of time.It is evident form the above results that the Buy and Holdrebalancing strategy produces highest returns as compared tothe index. In all daily, weekly and monthly periods of rebalancing the strategy has given more returns than the index and thereby validating form the above results and charts came to the conclusion that the Buy and Hold rebalancing strategy produceshighest returns in each period of time.6 CONCLUSIONFigure 5 Weekly RebalancingBenjamin Graham wrote in the Intelligent Investors than,“The essence of Investment Management is the management ofrisks, not the management of returns. Well-managed Portfoliosstart with this precept.” The portfolio can drift away from theoptimal target weights as the asset price changes over a periodof time. Thus, a profitable portfolio rebalancing strategy is sigIJSER 2021http://www.ijser.org
International Journal of Scientific & Engineering Research Volume 12, Issue 5, May-2021ISSN 2229-5518nificant in this case, because it affects the returns and risks associated with the portfolio. The portfolio performance can beoptimized by using technical analysis or proposed rebalancingstrategies.First, although the return of buy-and-hold strategy is higherthan some of the Index returns. Second, the rebalancing strategies results is lower risk than the Index and gives more percentage of returns. Thirdly, the strategy has a greater risk rewardthan the index. Fourthly, the return of this buy and hold strategy in each period and timeframe is greater than the index return. In trending market, this strategy always performs andyields more returns than the index.The strategy performs consistently in all periods for rebalancing the portfolio. Having an edge of different risk management ratios and KPI’s for rebalancing purpose the strategyoutperform in each and every investors portfolio.REFERENCES[1][2][3][4][5][6][7]M. Lam, "Is Porsrtfolio Rebalancing Good for Invest," ProQuest, 2014N.Bao, "Technical Analysis of ETF Portfolio Rebalancing Strategy,"ProQuestTokat, Y., "Portfolio Rebalancing in theory and pratice"M. Rasu, “Algorithmic Trading and Quantitative Analysis using Python”H. Hong, "Portfolio Rebalancing Revisited: What Strategy OptimallyTriggers an Adjustment to the Asset Weights?"T. M. Antti Ilmanen, "Portfolio Rebalancing Part 1 of 2: Strategic AssetAllocation," AQR, 2015S. E. R. M. S. K. N. b. A. H. Endang Soeryana Hasbullah, "Optimizationof the Mean-Variance Investment Portfolio of Some Stocks underMarket Sentiment and the ARMAX-GARCH Model," InternationalJournal of Advanced Science and Technology, 2020IJSERIJSER 2021http://www.ijser.org717
Analysis of Portfolio Rebalancing and Technical Indicators Samruddhi Bhosle, Pranav Vibhandik, Neha Kahane, Snehal Patil, Amol Dumbare Abstract— Stock Market is a scenario where investme