Transcription
How ExtraordinaryLeaders DoubleProfitsby Jack Zenger and Joe Folkman
How ExtraordinaryLeaders Double ProfitsOverwhelming evidence proves that extraordinary leaders create far more economicvalue for an organization than leaders that are good.Business success can be attributed tois the quality of leadership inside themany causes. These range from theorganization. This paper addresses theindustry you are in, a dramatic new tech-evidence we have for the relationshipnology that you’ve discovered, an un-between leadership and business out-usually well-designed product, a brilliantcomes and explores the likely reasonsstrategy, the timing of beginning yourfor that occurring. Finally, it describesenterprise, and yes, plain old good luck.what organizations can do to developWe acknowledge that all of these can ac-excellent leaders.count for an organization’s success.There is one factor, however, that isconsistent and predictable in its impacton the success of every business. That 2019 Zenger FolkmanCan extraordinary leaders doubleprofits?They can. It doesn’t always happen, nordoes it happen in the short run. But let1
Each branch had 25–35 people reporting to a branch manager. To assess theleadership effectiveness of each branchmanager, we used a 360-degree assessment to measure their leadershipcompetencies. This process included aself-assessment by the branch manager,a rating by that person’s manager, ratingsby the peers within the organization (i.e.other branch managers and corporateor regional staff), plus a number of directreports. We arbitrarily divided the branchmanagers into three groups based ontheir 360-degree feedback scores. Wedefined the top 10 percent as the bestus review an example of where it did. Wemany of the external factors that influencewere commissioned to conduct a studybusiness results, thus clearly revealingfor a division of a Fortune 500 mortgagethe significant impact leadership had onlending organization. In doing so, we dis-its bottom line. The organization includ-covered compelling evidence that leader-ed more than a hundred offices in citiesship effectiveness has a direct impact onscattered across North America. Theynet income.provided mortgage loans to home buyers.Interest rates were consistent between2Fortunately, this was an organization inoffices. Policies and procedures werewhich the profit was easy to measuregenerally alike. Profitability metrics wereon a granular, branch by branch level.readily available with no added or burden-In this instance, we were able to isolatesome cost.leaders, the bottom 10 percent as theworst leaders, and the middle 80 percentcomprised the rest of the leaders. Thisdivision provided dramatic contrast aboutthe impact of poor and extraordinaryleaders.We then cross-referenced this data withthe operating profits of each of the officesthose leaders managed. As you mightexpect, the results show the bottom 10percent did poorly and the top 10 percentdid exceptionally well. But it’s striking to
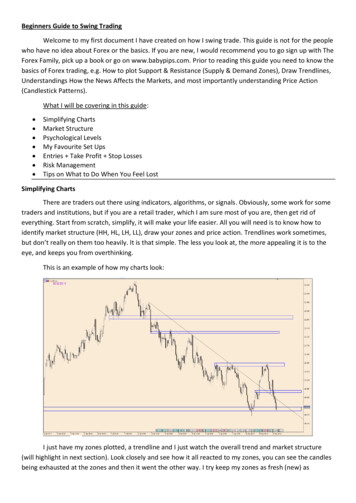
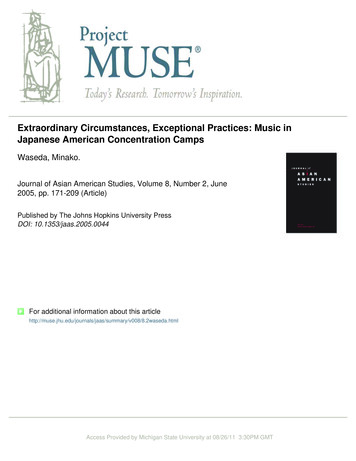
see just how significant the differencesdiscover the effectiveness of a leader,were.ask those who are led by and interact asThe Trend LineDo extraordinary leaders double the orga-peers with a leader. These questionnairesnization’s profit in every case? While theyFigure 1 shows:were collected within hundreds of compa-did in the previous case study, we ac- Net loss of 1.2 million for the bottomnies around the world. In addition, someknowledge that the answer to that ques-10 percent of branch managers.concrete performance metrics on thesetion is “probably not.”Profit per branch of 2.4 million for thesame managers allowed us to comparemiddle 80 percent of leaders.their measurable business results withHowever, we do have the data to showProfit of 4.5 million for the branchestheir leadership effectiveness.that the trend line will likely look the same. managed by the top 10 percent ofbranch managers.Regardless of whether the raw numbersThis data-driven approach has furtheredor percentages show a poor leader losingour understanding of leadership, revealing 1 million or breaking even, or an excel-The middle group actually triples profitshow we can identify extraordinary lead-lent leader doubling profits or increas-per branch in comparison to the bottomers and how such leaders develop. As aing them by 20 percent, the contention10 percent. The top 10 percent more thanresult, our leadership model provides ourremains the same. Good leaders createdoubled the average profit per branch ofclients with practical and tactical methodsmore economic value than poor leaders,the other 90 percent.for both determining a leadership focus,and extraordinary leaders create signifi-as well as the means for developingcantly more economic value than the rest.In recent years, one of the authors, Dr.strengths.Folkman, led a team that has analyzedHow leadership drives profita substantial database of over 750,000Most of all, our work in leadership de-multi-rater feedback instruments (com-velopment is focused on the positivelink between leadership and profitabilitymonly called 360-degree feedbackbusiness outcomes that great leadershipdirectly, but there has been much re-reports) that pertain to approximate-creates. In other words, our processsearch about the various elements thatly 56,000 managers. He was an earlypromises to convert leadership develop-drive profit. We can measure the factorspioneer in the development and use ofment into business results. It shows “howthat consistently lead to profitability. These360-degree feedback instruments andextraordinary leaders double profits,” andindirect influences, or what some wouldwrote a doctoral dissertation on thewhy that occurs.call intervening variables on profitability,subject. He believes that if you want to 2019 Zenger FolkmanIt’s not always possible to measure theinclude:3
ee commitment scores at the 23rd percentile. Then compare that to employeesreporting to leaders in the top 10 percent.These employees had satisfaction andcommitment scores at the 80th percentile.(This study is based on 30,661 leadersfrom all over the globe.)Retention and TurnoverMore than 80 percent of employees “thinkabout quitting” their jobs if they report toleaders in the bottom 10 percent, versusthe 4 percent who “think about quitting” ifthey report to leaders in the top 10 percent. It’s worth noting that in normal economic times, about half of the people inAbility to recruit good talent.The link between leadership effectiveness Employee satisfaction/commitment.and each of these business outcomes is Employee turnover.often easier to determine than the single Percent of employees who “thinkultimate outcome of profitability.in a financial services company.)Employee commitmentSales Growthbecause of political problems and lowerabout quitting.” Satisfaction with pay. Sales effectiveness. Customer satisfaction.lately about the importance of employee Corporate image.commitment. When looking at the impact Corporate culture.of leadership effectiveness on employee Innovation.satisfaction and commitment, note that Workforce productivity.employees reporting to managers in theFor example, much has been writtenbottom 10 percent of leaders had employ4the organization who say they are thinking about quitting actually quit within a year!(These results are from over 2,500 leadersIn 2014, the economy in Mexico struggledthan expected growth. Every sector of theeconomy was impacted. The executivesof a retail store chain, however, believedthat effective store managers would
deliver improved sales even in a difficulteconomy.To verify their hypothesis, we analyzed theleadership effectiveness of 95 retail storemanagers. Assessments were completedby managers, peers, direct reports, andinternal customers on each store manager. Because the size of stores varied,along with some locations being morefavorable than others, we used as ourprimary measure the percentage increasein sales of each store compared to theprevious year. Figure 4 shows the results.The worst leaders, defined as those in thebottom 10 percent, showed a 0.7 percentimprovement from the prior year. The bestleaders, defined as those at the top 10percent, showed a 7.4 percent improvement in year over year sales.PayEven satisfaction with pay shows a dramatic disparity, with less than 37 percentof employees satisfied with their pay ifthey reported to a leader in the bottom 10 2019 Zenger Folkman5
firm. But let’s dig a bit deeper to see if wecan better understand why this happens.When people come to work they havethe option of putting forth a minimalamount of effort—just enough to get byand not get fired—or they can put forthan extreme amount of effort and energyto accomplish what they can see as thehigh priority tasks that would benefit theorganization. That combination of choosing high leverage tasks to work on, alongwith a focused, efficient execution, enablethose people to be far more productive.Most of us can identify with coming intoHaving established the dramatic andcent of employees satisfied with their paymeasurable impact that leadership has onat organizations led by the top 10 percent.various business outcomes, and ultimatelyWhat is especially interesting about thisthe bottom line, let’s now look at the obvi-statistic is that employees were not beingous question this raises.all in the face of a clear deadline. HowWhy does better leadership improvetic. We’ve all experienced it.We hope it is obvious to every reader thatHowever, is an immediate trip or impendingpaid more by leaders in the top 10 percent in comparison to those who workedfor leaders in the bottom 10 percent. Theyare living proof of the sentiment underlyingprofitability?the old saying, “You can’t pay me enoughthe business outcomes described aboveto work for that person.”are really the key intervening variables thatultimately translate into profits for the6work knowing that we’re leaving on apercent. Contrast that with nearly 60 per-week-long business trip or a vacation thenext day. It is amazing what can be accomplished with intense focus and effort,variable is discretionary effort? It is gigan-event the only force to influence discretionary behavior? Our research confirms thatthe immediate manager also has a profound effect on whether direct reports put
forth the maximum or the minimum effort.Figure 6 describes that relationship.In a global pharmaceutical company, theimpact of leadership on discretionaryeffort was even more pronounced, asshown in Figure 7.Discretionary effort is one of the majorinfluences on worker productivity. Thereare others, of course, including havingadequate tools and resources, efficientsystems and procedures, and appropriaterewards and incentive systems. Giventhose, however, a huge factor determiningworker productivity is the decision within the worker about how much they willproduce on a given day. The late PeterDrucker observed that for most companies in which labor costs amounted toroughly half of their total expense, that a10 percent increase in productivity woulddouble most organizations’ profits.This isn’t an entirely new concept. In1976, Robert Sibson researched and pub- 2019 Zenger Folkman7
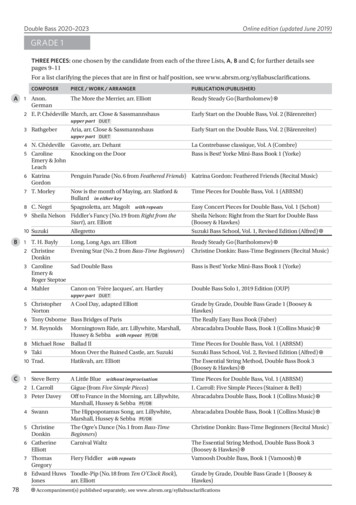
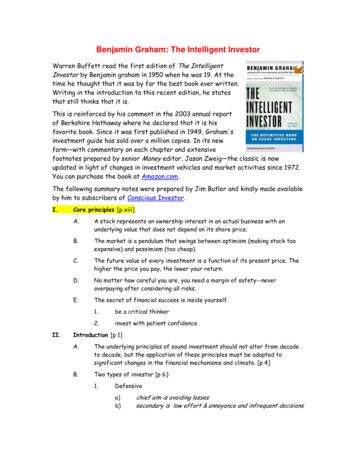
Fig 8. Impact of Productivity GainsAnd productivity improvement is If people costsare 80%160%320%50%50%100%200%500%Then percent increase in pre-tax profit is lished his findings about the impact thatIn a study at Zenger Folkman based onGallup claims that 16 percent of the work-improving productivity had on increasingover 235,000 employees, we found thatforce are actively disengaged, 55 percentprofits.1 Our research confirms Sibson’s20 percent of employees have high satis-of employees are not engaged at work,findings and carries it into the 21st centu-faction and commitment scores, and thatand that only 29 percent of employeesry. As a matter of fact, we’ve found that if37 percent are moderately satisfied andare engaged. They claim this costs thepeople costs are 50 percent (as a percentcommitted. But that leaves 43 percentUS economy upwards of 350 billion.of sales) and productivity improvement iswho have lower satisfaction and commit-The difference between these research10 percent, then the increase in pre-taxment. Ponder that. Just under one-half offindings is probably in the definition ofprofit is 100%. Even if productivity im-the employee workforce would have sig-engagement. It is obvious, however, thatprovement is just 5 percent and peoplenificantly higher productivity if their levelsif 71 percent of your workforce is activelycosts are 50 percent, that’s still an in-of engagement and commitment could bedisengaged or not engaged, there is easilycrease in pre-tax profit of 50 percent!improved—a factor that is strongly influ-room for a 10 percent increase in produc-enced by leadership effectiveness.tivity from the overall workforce.Figures 8 and 9 summarize why we thinkthere is ample room for productivity improvement in most organizations.18Sibson, Robert E. Increasing Employee Productivity, AMACOM: New York. 1976. p. 12.
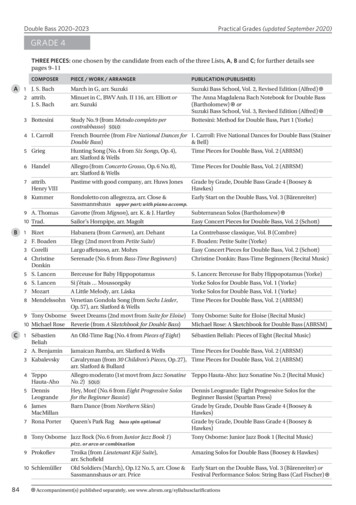
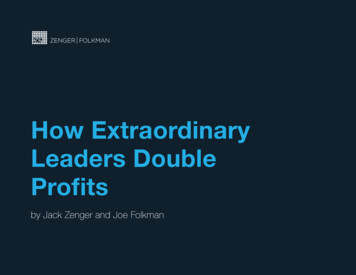
Fig 9. Compiled Research on employee satisfaction, commitment, productivity, and engagementResearch by Zenger FolkmanResearch by Hunter, Schmidt &JudieschResearch by Gallup20% with high satisfaction andcommitmentMedium complexity job: person attop 1% was 85% more productivethan person at 50th percentile20% of employees engaged37% with moderate satisfaction andcommitmentHigh complexityjob: person at top 1% was 127%more productive than person at50th percentile55% not engaged43% with low satisfaction and commitmentMeta-analysis of 80 studies onproductivity16% activelydisengaged, costing the US economy 350 billionHunter, Schmidt, and Judiesch ap-In high-complexity jobs, they found thatis “Can we develop extraordinary lead-proached the productivity question bythe person in the top 1 percent was 127ers?” The simple answer is “yes!” We canlooking at the dramatic differences inpercent more productive than the persondevelop leaders who inspire people toproductivity from those people doing ex-at the 50th percentile. Again, assumingperform at a higher level and thus increaseactly the same work. They broke out theirthat many of the low performers wereorganizational productivity. There aredata by various levels of job complexity.reporting to the least effective bosses, anmany organizations that show consistentThe greater the job complexity, the greaterimprovement in leadership effectivenessimprovement in productivity over time asthe difference between the top perform-could be predicted to have significanta direct result of their leadership devel-ers and the middle or lower performers.impact on productivity.opment programs. For instance, Gen-For example, they showed that for medium-complexity jobs, the person in the top1 percent was 85 percent more productive than the person in the 50th percentile. 2019 Zenger Folkmaneral Electric had a 5 percent per annumDeveloping Extraordinary LeadersWho Can Double Profitsgrowth in employee productivity at a timewhen many organizations wereThe next question you might logically ask9
languishing with 1– 2 percent productivitywill have real value for the organiza-When an organization has an evi-improvement.tion. We have identified specific itemsdence-based competency model andthat are most effective at differentiat-measurement tools that can accurate-We have found that the most sure-footeding great leaders from average andly predict a leader’s effectiveness, theyway to accomplish this is to follow a pro-poor leaders. These items have beencan begin building and developingcess combining the following elements:validated to predict engagement, turn-these leadership competencies, orover, profitability, sales, and customerstrengths. These become the clearsatisfaction. These items also have apath to extraordinary leadership, tobased on hard data and analysis,normative base to compare individu-increasing productivity, and finally toversus the pooled opinions of aal leaders to those who score at thethe maximization of profits for thefew executives. The organization75th and 90th percentile across theorganization.must rely on a leadership developmentglobe.1. Create a competency modelmodel that defines the competencieswhich will make a difference. Compe-About half of our clients utilize ourtency models define the key leader-standard assessment, while theship behaviors that will lead to orga-other half utilizes their organization’snizational success. This doesn’t bodecustomized competency model. Inwell for a trendy leadership programsome case, clients use both their ownself-awareness first illuminates thethat has no evidence of changingcompetency model and their ownstrengths that the individual possess-behavior and fails to focus on those360-degree feedback instrument. Re-es. It also needs to call attention tobehaviors that truly help the organiza-gardless of which competency modelany serious failings that detract fromtion to create value.and 360-degree feedback instrumentthe leader’s performance. We think itis used, we have been able to demon-wise to utilize a world-class 360-de-By emulating “evidence-based”strate that leaders who have highergree feedback instrument that ismedicine—gathering the aggregatescores on the assessment also haveeasily understood and digested by thedata from 750,000 360-degree feed-more positive scores on key factorsparticipant.back instruments describing 56,000that leverage the success of the orga-managers—you can then produce anization.leadership development model that102. Provide leaders with insightfulawareness about how well theycurrently perform against thismodel. Any journey begins by knowing where you’re starting from. This3. Make feedback motivational.Telling everyone in the organization
where they fall on a bell-shaped curveMotivation and confidence increasevery often a person’s current job.of IQ scores or performance measure-when a practical and actionable planFor example, could there be a betterments is virtually guaranteed to beis created.situation in which to learn the skills ofdemotivating and discouraging to 95building relationships than your currentpercent of the population. Only thoseOur research has shown that mag-few at the very top will have positivenifying a competency to the point atfeelings. Everyone else is deflated. Butwhich it becomes a strength is not thefeedback can be enormously motiva-same as curing a weakness. Non-lin-tional when delivered in a caring andear development, akin to an athleteences in the outcomes of any lead-constructive way. When the feedbackengaging in cross training, giveser’s development process when theemphasizes strengths and is translat-participants a fresh, new approach formanager is intimately involved versused into specific actions it becomes adeveloping themselves.not being engaged. Clearly the man-positive experience. This allows participants to translate this new awarenessinto a self-development plan to whichthey are committed.position?6. Involve the manager. Our researchforcibly points out the huge differ-ager’s involvement greatly elevates the5. Provide appropriate skill develop-participant’s motivation, not to men-ment. Greater self-awareness helpstion the practical contributions that themost leaders identify areas in whichmanager can make to a direct report’sthey can be far better. Often it is indevelopment efforts.We often hear of organizations whothe skill of coaching. Most leaderssend leaders their 360-degree feed-acknowledge that giving colleaguesback report by email or regular mail.corrective feedback is something theyData is dumped on the leader withoutpostpone and duck. Other managersThere are many approaches to devel-regard for its impact on their motiva-benefit from presentation skills trainingoping leaders and each organizationtion to improve.or developing greater comfort in thehas to decide which process will servestrategic thinking process.it best. If there is a lack of follow-up on4. Assist in creating personal de-7. Create sustainment. Leadershipdevelopment isn’t a new concept.a leadership program, basic principlesvelopment plans. Most participantsThis development does not alwayswill have to be repeated over and overhave not, and probably will not, createneed to be formal training conductedagain. New skills and behaviors rapidlya personal plan of developmentin a classroom. A perfect “classroom”evaporate if there are no sustainmentwithout some organizational support.in which to learn leadership skills ismechanisms in place. To put it in 2019 Zenger Folkman11
statistical terms, 87 percent of whatThere is no substitute for measure-Leader research, we have detected whata person learns in a leadership pro-ment and feedback, and there is anit takes to develop extraordinary leadersgram will be gone within 30 days ifassortment of follow-up metrics andand confirmed that it is possible to mea-there is no follow-up. Follow-up cantools that work with customized lead-sure leadership in dollars. Boiling it downbe as simple as asking for monthlyership development as well as moreto the simplest of terms, good leadersprogress reports from team members,traditional programs.create more economic value than poor2colleagues, employees, and/or peers.Specific suggestions for improvementleaders, and extraordinary leaders creParting Thoughtsate far more value than good ones. ThatMany of us intuitively know that leadershipbeing the case, you may wisely choose tobe part of the follow-up process. Con-affects the bottom line. We have pre-invest in developing exceptional leaders inducted every four to six months, thesesented a variety of evidence to supportyour organization.mini surveys reveal areas for improve-that assertion. Through our Extraordinarycan be requested. Mini-surveys canment “before and after” the individualtakes part in the leadership program.3Rackham, Neil. SPIN Selling New York: McGraw-Hill. 1988.Goldsmith, Marshall, Lyons, Laurence, Freas, Alyssa. “Teambuilding Without Time Wasting.” Coaching for Leadership: Howthe World’s Greatest Coaches Help Leaders Learn. Jossey-Bass Pfeiffer: San Francisco. 2000.23Boiling it down to the simplest of terms, good leaders createmore economic value than poor leaders, and extraordinaryleaders create far more value than good ones.12
About UsZenger Folkman relentlessly seeks to rise above the inconsistent, and sometimesmisleading, nature of popular leadership philosophies and beliefs brought on byopinion. The discipline of leadership and those who pursue it deserve better. Our mostvaluable asset is the expertise of combining hard data and statistical analysis withlogical explanations and actionable application that help individual leaders thrive andorganizations succeed.www.zengerfolkman.com
Good leaders create more economic value than poor leaders, and extraordinary leaders create signifi-cantly more economic value than the rest. How leadership drives profit It’s not always possible to measure the link between leadership and profitability directly, but there has been much re-search about