Transcription
MODUL-8Financial AccountingFinancial Statement AnalysisByMUH. ARIEF EFFENDI,SE,MSI,AK,QIAMagister Accounting Program (MAKSI)BUDI LUHUR UNIVERSITYJakarta - Indonesia2010
Financial Statement AnalysisAfter studying this topic, students should be able to:1.Understand the outline of Financial Statement Analysis.2.Understand the Basic of Financial Statement Analysis.3.Understand the External & Internal Use of Financial Statement Analysis.4.Understand the Framework for Financial Analysis.5.Identify the Tools of Financial Statement Analysis.6.Understand the Horizontal Analysis and Vertical Analysis.7.Understand the Objective Ratio Analysis , Rationale Behind Ratio Analysis &Limitations of Ratio Analysis.8.Understand the Classification of Financial Ratio Analysis (Liquidity, Profitability, andsolvency Ratio).9.Understand the DuPont Model / Method.10.Understand the Concept of Earning Power, and how Irregular Items are presented.11.Understand the Concept of Quantitative Market Analysis.
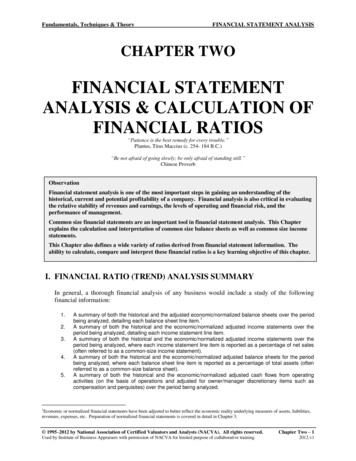
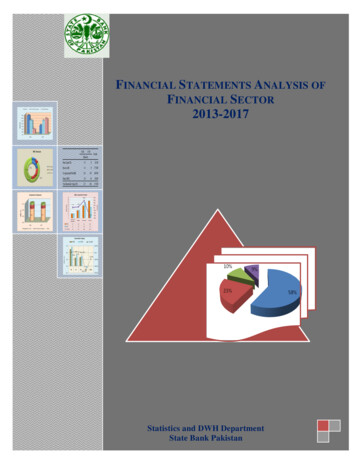
The Outline ofFinancial Statement AnalysisFinancial Statement AnalysisBasics ofFinancialStatementAnalysis Need forcomparativeanalysisTools ofanalysisHorizontal andVertical Analysis Ratio AnalysisBalancesheet Liquidity ProfitabilityIncomestatement Solvency SummaryRetainedearningsstatementEarning Powerand IrregularItems Discontinuedoperations Extraordinaryitems Changes inaccountingprincipleComprehensiveincomeQuality ofEarnings Alternativeaccountingmethods Pro formaincome Improperrecognition
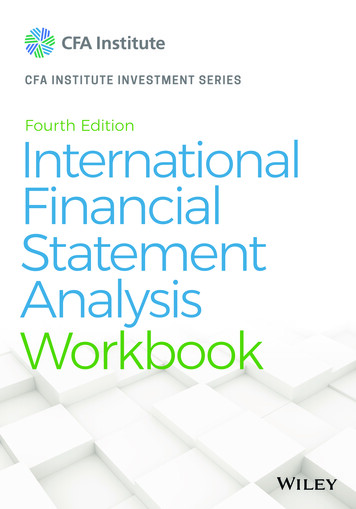
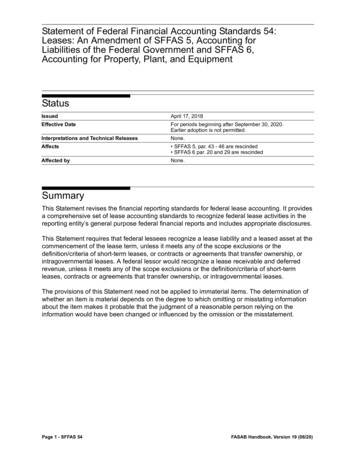
Basics of Financial Statement AnalysisAnalyzing financial statements involves:Tools ofAnalysisComparisonBasesCharacteristics Liquidity Profitability Solvency IntracompanyIndustryaveragesIntercompany Horizontal Vertical Ratio
Examples of External Uses ofFinancial Statement Analysis Trade Creditors : Focus on the liquidity of thefirm.Bondholders : Focus on the long-term cashflow of the firm.Shareholders : Focus on the profitability andlong-term health of the firm.
Examples of Internal Uses ofFinancial Statement Analysis Plan : Focus on assessing the current financialposition and evaluating potential firmopportunities. Control : Focus on return on investment forvarious assets and asset efficiency. Understand : Focus on understanding howsuppliers of funds analyze the firm.
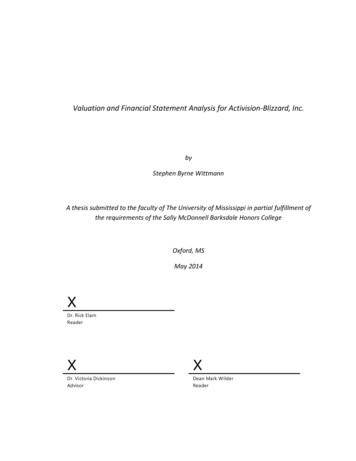
Framework For Financial AnalysisTrend / Seasonal Component How much funding willbe required in the future?1. Analysis of the fundsneeds of the firm. Is there a seasonalcomponent?Analytical Tools Used Sources and UsesStatementStatement of CashFlowsCash Budgets
Framework For Financial AnalysisHealth of a Firm1. Analysis of the fundsneeds of the firm.2. Analysis of the financialcondition and profitabilityof the firm.Financial Ratios :1.2.3.4.IndividuallyOver timeIn combinationIn comparison
Framework For Financial Analysis1. Analysis of the fundsneeds of the firm.2. Analysis of the financialcondition and profitabilityof the firm.3. Analysis of the businessrisk of the firm.Business risk relates tothe risk inherent in theoperations of the firm.Examples:1. Volatility in sales.2. Volatility in costs.3. Proximity to breakeven point.
Framework For Financial Analysis1. Analysis of the fundsneeds of the firm.2. Analysis of the financialcondition and profitabilityof the firm.3. Analysis of the businessrisk of the firm.Determiningthefinancingneeds ofthe firm.A FinancialManager mustconsider allthree jointlywhendetermining thefinancing needsof the firm.
Framework For Financial Analysis1. Analysis of the fundsneeds of the firm.2. Analysis of the financialcondition and profitabilityof the firm.3. Analysis of the businessrisk of the firm.Determiningthefinancingneeds ofthe firm.Negotiationswithsuppliers ofcapital.
Quantitative Financial Analysis Common-size & Index Analysis :1. Common-size Analysis : An analysis of percentagefinancial statements where all balance sheet items aredivided by total assets and all income statement items aredivided by net sales or revenues.2. Index Analysis : An analysis of percentage financialstatements where all balance sheet or income statementfigures for a base year equal 100.0 (percent) andsubsequent financial statement items are expressed aspercentages of their values in the base year.
Quantitative Financial Analysis Financial Ratios : is an index that relates twoaccounting numbers and is obtained by dividing onenumber by the other.1. Balance Sheet Ratio.2. Income Statement & Income Statement / BalanceSheet Ratio. Growth / trend Analysis / Horizontal Analysis. Quarterly analysis. The DuPont Model / Method. Earning Quality / Normalizing Earning.
Quantitative Financial Analysis Systematic analysis of key elements based onanalysis context.Quantitative techniques to standardizefinancial information for relevantcomparisons.In-depth analysis for key factors, including“red flags”.
Quantitative Financial Analysis :Common-size Analysis Overview vs. detail.Balance sheet: total assets 100%.Income Statement: sales (or total revenues) 100%.Comparisons over time & across firms (orindustry averages).Useful starting point for financial overview.
Tools of Analysis : Horizontal Analysis /Trend Analysis / Growth Analysis Horizontal analysis, also called trend analysis, is atechnique for evaluating a series of FinancialStatement (FS) data over a period of time. Its purpose is to determine the increase or decreasethat has taken place. Horizontal analysis is commonly applied to the BalanceSheet (BS), income statement, and Statement ofRetained Earnings (RE).
Quantitative Financial Analysis : GrowthAnalysis (Period- By-Period Change) Long-term trends over time can be significant. Arecurrent year performance measures consistent withearlier years (e.g., maintaining consistent ratioswhile sales are rising smoothly)?As a first step, present growth rates (including %increases) for the last 5-10 years.Declining or negative growth rates might beobvious red flags; Red flags and other indicators ofpoor growth performance require further analysis.
Quantitative Financial Analysis : TrendAnalysis (Base-Year Analysis) Set the earliest year, evaluated as the base year, at100.[Note: this assumes that earliest year is ―normal.‖]Calculate growth by dividing the more currentyear numbers by the base year number. This is an alternative presentation to growth ratepercentages over 5-10 years (or more).
Quantitative Financial Analysis :Quarterly Analysis The most recent financial data is presentedquarterly (e.g., 10-Q). [The one exception is at yearend, with annual information is presented].Financial analysts focus on quarterly data and thequarterly earnings announcement is the mostimportant (& earliest) information.Common-size and ratios analysis is conducted, andcompared over earlier quarters: particularlyimportant are current quarter data to (1) theprevious quarter and (2) the same quarter one yearago.
Tools of Analysis : Vertical Analysis Vertical analysis, also called common-size analysis,is a technique that expresses each FinancialStatement (FS) item as a percent of a base amount. On an Income Statement (IS), we might say thatselling expenses are 16% of net sales. Vertical analysis is commonly applied to the BalanceSheet (BS) and the Income Statement (IS).
Objective of Ratio Analysis Standardize financial information for comparisons.Evaluate current operations.Compare performance with past performance.Compare performance against other firms orindustry standards.Study the efficiency of operations.Study the risk of operations.
Rationale Behind Ratio Analysis A firm has resources.It converts resources into profits through : production of goods and servicessales of goods and servicesRatios : Measure relationships between resources and financialflowsShow ways in which firm’s situation deviates from Its own pastOther firmsThe industryAll firms-
Ratio Analysis A ratio converts financial information to apercentage, one approach to standardization.Each ratios provides a somewhat differentanalysis.Ratios overlap—a problem in one area shouldshow up as problems in other areas.The importance of specific ratios differs, basedon the purpose of the financial analysis.Ratios for the most recent period are usuallythe most important.
Ratio AnalysisWhen analyzing a firm, we want to know : if the firm is able to meet its short-term financialobligations (is it solvent?); if the firm is able to meet its long-term financialobligations (going bankrupt in the future?); how well the assets of the firm are managed; how well the overall operations of the firm are managed(is it profitable?); how the market interprets accounting data and whatexpectations are factored in.
Ratio Analysis Short-term solvency and liquidity ratios:Indicate the firm’s abilityto pay its bills over the short run without undue stress. Financial leverage: Describe a firm’s long-term ability to meet its financialobligations Asset utilization turnover ratios:Describe how efficiently (intensively) afirm uses its assets to generate sales. Profitability ratios:Describes how efficiently the firm manages its overalloperations (the higher, the better!) Market ratios : Describe how the market values the firm.
Limitations of Ratio Analysis A firm’s industry category is often difficult to identify.Published industry averages are only guidelines.Accounting practices differ across firms.Sometimes difficult to interpret deviations in ratios.Industry ratios may not be desirable targetsSeasonality affects ratios.Ratios are presented on a percentage basis.Relative size is ignored (e.g., both large & small firms can becompared).It is assumed that all numbers used are correct (consider bothpossible errors and earnings management).If the numbers are not reliable, ratios are not particularly useful.
Financial Statement Analysis :Comparison BasesA single ratio by itself is not very meaningful.
Types of Comparisons forFinancial RatioTypes of Comparisons1. Internal Comparisons2. External Comparisons
External Comparisons &Sources of Industry Ratio This involves comparing the ratios of one firm with those ofsimilar firms or with industry averages. Similarity is important as one should compare “apples toapples.”Examples:1. Risk Management Association.2. Dun & Bradstreet.3. Almanac of Business and Industrial Financial Ratios.
Ratio Analysis :Financial Ratio Classifications1. Liquidity Ratio :Measures short-term ability of the company to pay its maturingobligations and to meet unexpected needs for cash.2. Profitability Ratio :Measures the income or operating success of a company for a givenperiod of time.3. Solvency :Measures the ability of the company to survive over a long periodof time.A Financial Ratio is an index that relates two accountingnumbers and is obtained by dividing one number by the other.
Financial Ratio Classifications :Liquidity Ratio Short-term creditors such as bankers and suppliersare particularly interested in assessing liquidity. Ratios include :1. Current Ratio2. Quick (Acid-Test) Ratio3. Receivables Turnover4. Inventory Turnover.
Financial Ratio Classifications :Liquidity RatioCurrent Ratio (CR) Current AssetsCurrent LiabilitiesQuick (Acid-Test) Ratio (QATR) Current Assets - InventoryCurrent LiabilitiesReceivables Turnover (RT) Net Credit SalesAverage Net ReceivableInventory Turnover (IT) Cost of Good SoldAverage Inventoryor Inventory Turnover SalesInventory
Financial Ratio Classifications :Profitability Ratio Income, or the lack of it, affects the company’s abilityto obtain debt and equity financing, liquidity position,and the ability to grow. Ratios include the profit margin, asset turnover, returnon assets, return on common stockholders’ equity,earnings per share, price-earnings, and payout ratio.
Financial Ratio Classifications :Profitability Ratio Profit Margin (PM) Net Profit Margin (NPM) Net IncomeNet SalesEBITSalesNet SalesAverage AssetsSalesTotal AssetsAsset Turnover (AT) Return On Assets (ROA) Total Asset Turnover (TAT) Net IncomeAverage Assets Return On Equity (ROE).Net IncomeTotal Equity Return On Common Stockholders’ Equity (ROCSE).Net Income - Preffered DividendsAverage Common Stockholders’ Equity Earnings Per Share (EPS) Retention Ratio Net IncomeWeighted Average Common Shares OutstandingEPS - DividenEPSPrice Earnings Ratio (PER) Market Price per Share of StockEarnings per Shares Payout Ratio (PR) Cash DividendsNet Income
Financial Ratio Classifications :Debt & Solvency Ratio (Leverage)Debt to total assets and times interest earned are two ratios that provideinformation about debt-paying ability.Debt to Total Assets : Measures the percentage of the total assets that creditorsprovide.Times Interest Earned : Provides an indication of the company’s ability to meetinterest payments as they come due. Debt to Total Assets Ratio (DAR) Total DebtTotal Assets Times Interest Earned (TIE) Income Before Income Taxes and Interest ExpenseInterest Expense
Financial Ratio Classifications :Debt & Solvency Ratio (Leverage)Debt to Equity Ratio : Total Liabilities / Total Stockholders’ EquityDebt Ratio : Total Liabilities / Total AssetsInterest Coverage : (Income Before Tax Interest Expense) / Interest Expense[note that the numerator is earnings before interest and taxes or EBIT]*Long-term Debt to Equity: Long-term Liabilities / Total Stockholders’ EquityDebt to Market Equity: Total Liabilities at Book Value / Total Equity at MarketValue*alternatively: (income from continuing operations interest expense taxexpense)/interest expense
Activity Ratio Analysis Inventory turnover: cost of sales [orCOGS]/average inventoryReceivables turnover: sales/average accountsreceivablePayables turnover: sales/average accountspayableWorking capital turnover: sales/averageworking capitalFixed asset turnover: sales/average property,plant & equipm
Horizontal analysis, also called trend analysis, is a technique for evaluating a series of Financial Statement (FS) data over a period of time. Its purposeis to determine the increase or decrease that has taken place. Horizontal analysis is commonly applied to the Balance Sheet (BS), income statement, and Statement of Retained Earnings (RE).