Transcription
CONCEPT DEVELOPMENTMathematics Assessment ProjectCLASSROOM CHALLENGESA Formative Assessment LessonFerris WheelMathematics Assessment Resource ServiceUniversity of Nottingham & UC BerkeleyBeta VersionFor more details, visit: http://map.mathshell.org 2012 MARS, Shell Center, University of NottinghamMay be reproduced, unmodified, for non-commercial purposes under the Creative Commons licensedetailed at http://creativecommons.org/licenses/by-nc-nd/3.0/ - all other rights reserved
Ferris WheelMATHEMATICAL GOALSThis lesson unit is intended to help you assess how well students are able to: Model a periodic situation, the height of a person on a Ferris wheel, using trigonometricfunctions. Interpret the constants a, b, c in the formula h a b cos ct in terms of the physical situation,where h is the height of the person above the ground and t is the elapsed time.COMMON CORE STATE STANDARDSThis lesson relates to the following Standards for Mathematical Content in the Common Core StateStandards for Mathematics:F-BF: Build a function that models a relationship between two quantities.Build new functions from existing functions.F-TF Model periodic phenomena with trigonometric functions.This lesson also relates to the following Standards for Mathematical Practice in the Common CoreState Standards for Mathematics:4.7.Model with mathematicsLook for and make use of structure.INTRODUCTIONIt is helpful if students have met graphs of the sine and cosine functions before this lesson unit.The unit is structured in the following way: Before the lesson, students attempt the assessment task individually. You then review their workand formulate questions for students to answer in order for them to improve their work.During the lesson, students engage in collaborative discussion in pairs or threes on a related task.They regroup to assess each other’s work. Throughout their work they justify and explain theirdecisions to peers. In a whole-class discussion, students explain and extend their solutions andmethods.Finally, students work alone again on a task similar to the assessment task.MATERIALS REQUIREDEach student will need a copy of the first assessment task: Ferris Wheel, the second assessment task,Ferris Wheel (revisited), a scientific calculator (not a graphing calculator), a mini-whiteboard, a pen,and an eraser.Each small group of students will need one copy of Card Set A: Graphs, Card Set B: Functions, CardSet C: Descriptions of the wheels, a large sheet of paper, a glue stick, and a pair of scissors. Someteachers cut the cards into sets before the lesson; others ask students to do this for themselves.There are some projector resources to help with the discussions.If you have to split the lesson over two teaching sessions, you will need some paper clips.TIME NEEDED:20 minutes before the lesson, a 90-minute lesson (or two shorter lessons), and 20 minutes in a followup lesson (or for homework). Timings approximate. Exact timings will depend on the needs of yourclass.Teacher guideFerris WheelT-1
BEFORE THE LESSONAssessment task: Ferris Wheel (20 minutes)Set this task in class or for homework a few days beforethe formative assessment lesson. This will give you anopportunity to assess the work and identify students whohave misconceptions, or need other forms of help. Youshould then be able to target your help more effectively inthe follow-up lesson.Ferris WheelStudent MaterialsAlpha version January 2012Ferris WheelA Ferris wheel is 60 meters in diameter and rotates once every four minutes.The centre axle of the Ferris wheel is 40 meters from the ground.1.Using the axes below, sketch a graph to show how the height of apassenger will vary with time.Assume that the wheel starts rotating when the passenger is at thebottom.*!4.,562/ )!,0/(!-.2.73'!&!%! !Give each student a copy of the task sheet, and a scientificcalculator.Have any of you been on a Ferris wheel?About what diameter was it?How fast did it turn?#!"!!!"# %&'() ,-./,0/-,012.32.A mathematical model for this motion is given by the formula:h a b cos ctwhereh the height of the car in meterst the time that has elapsed in minutesa, b, c are constants.Find values for a, b and c that will model this situation.Make sure students are familiar with the context. Thenpose the problem:On your own, I want you to answer the questions on the sheet.Do as much as you can in 20 minutes.Record all your thinking and calculations, so that I can follow your reasoning.If there is anything you don’t understand then please ask me. 2010 Shell Center/MARS University of Nottingham UKS-1It is important that, as far as possible, students answer the questions without assistance.Advise your students they should not worry too much if they cannot do everything because you willteach a lesson using a similar task that should help them make progress. Explain that, by the end ofthe next lesson, they should expect to answer questions such as this one with confidence.Assessing students’ responsesCollect students’ written work for formative assessment. Read through their scripts and makeinformal notes on what their work reveals about their current levels of understanding and theirdifferent problem-solving approaches.Do not write grades on students’ work. Research shows that this is counterproductive, as itencourages students to compare grades and compete with each other. That distracts them fromfocusing on how they could improve their mathematics.To help students make further progress, write questions that focus attention on aspects of their work.Some suggestions for these questions are given on the next page. These have been drawn fromcommon difficulties observed in trials of this unit.We suggest you write your own lists of questions, based on your own students’ work, using the ideasbelow.You may choose to write questions on each student’s work or, if you do not have time for this, justselect a few questions that will help the majority of students. These can then be written on the boardat the end of the lesson. These questions will guide students in improving their solutions.The formative assessment activity will also inform your understanding of the issues your studentsneed to work on during the lesson.Teacher guideFerris WheelT-2
Common issues:Suggested questions and prompts:Graph is drawn, starting at the origin (Q1) How high is the axle of the wheel? How high is the person when she is in thebottom car?Graph consists of straight-line segments (Q1) In which part of the ride is the passenger isrising most rapidly? How is this shown onyour graph? How does the vertical speed of the passengerchange on your graph? Describe what would happen to your heightabove the ground if you went on a ride likethis.For example: The points (0, 10), (60, 40),(120, 70) are joined with straight-line segments.Constraints are not transferred correctly intographical features (Q1)For example: The height of the axle - the centralaxis of the graph - is not shown as h 40.Or: The rate of rotation is incorrect, as the graphis not shown as periodic every 4 minutes.Or: The diameter of the wheel – the peak-to-peakamplitude of the graph – is not shown as 60meters.Student does not interpret the given model(Q2)For example: The student rejects the use of cosineand adopts the sine function.Or: The student does not attempt to find valuesfor a, b, c.Student tries to find the values of variables bysubstitution, rather than analyzing thestructure of the situationFor example: The student attempts to substitutevalues of t and tries to solve for a, b and c:When t 0 , a bcos(0c) a b 10 .When t 4 , a bcos(4c) 10 .! When t 2 , a bcos(2c) 70 .!!Teacher guide What is the height of the axle? How does yourgraph show the height of the axle? How long does it take for the wheel tocomplete one turn? How does your graphshow the rate of rotation? What is the diameter of the wheel? How doesyour graph show this diameter? Which quantities vary as the Ferris Wheelturns? Which measures do not vary? What do you know about the cosine function? When is the cosine function zero? How doesthis connect to the motion of the Ferris Wheel? What does c represent? When t 4, what is the value of the function?How do you know? What does this tell youabout the rate of turn? Think about the equation and structure of thephysical situation. Which of a, b, or c wouldchange if I raised or lowered the axis of theFerris wheel? Suppose the wheel turned more quickly.Which of a, b, or c would this change in theequation? Suppose you had a Ferris wheel with a largerdiameter. Which of a, b, or c would change? How can these facts help you to fit thefunction to the graph?Ferris WheelT-3
SUGGESTED LESSON OUTLINEIntroduction: Transforming the cosine function (20 minutes)Give each student a mini-whiteboard, a pen, and an eraser.Begin the lesson by asking students use their mini-whiteboards to respond to questions. If at any stagestudents get stuck, offer a few more, similar, questions on those particular types of transformation.For example, if they get stuck on y 2cosx, then look at y 3cosx, y 4cosx, and so on.On your mini-whiteboards, sketch the graph y cos x.What is its maximum value? [1]What is the minimum value? [-1]What is the period of the cosine function?[After 360º the function values repeat.]Where does it cross the x-axis?Now show me y 1 cos x.What is the maximum value? Minimum value? [2, 0]What does adding the constant do to the graph of y cos x?[Translates the graph 1 units -2-3Show me y 2cos x.What is the maximum value? Minimum value? [2, -2]Where does the graph cross the x-axis?What does multiplying by a constant do to the graph of y cos x?[Stretch by factor of 2 parallel to y-axis.]Has the period of the function changed? [No.]What about multiplying by -1? That gives y - cos x.[This reflects the graph in x-axis.]Has the period of the function changed? [No.]3210-1-2-33210-1-2-3Show me y cos 2x.What does multiplying the x by a constant do to the graph?[Stretch parallel to x-axis.]Is the period of this function different?[Yes. The period is now 180 degrees.]3210-1-2-3Try to combine some changes.Show me y 1 2cos x.What is the maximum value? Minimum value? [3, -1]Where does this graph cross the x-axis? Estimate! [120 , 240 ]What has happened to the graph of y cos x?[Stretched by a factor of 2 parallel to the y-axis, and translated 1units vertically.]Teacher guideFerris Wheel3210-1-2-3T-4
Now show me y 1 – cos2x.What is the effect if you combine multiplying by -1, and multiplyingthe x by a constant?[Stretch parallel to the x-axis, with a reflection of the graph in thex-axis.]3210-1090180270360-2-3Throughout this activity, encourage students to articulate their reasoning, justify their choicesmathematically, and question the choices put forward by others. This introduction will providestudents with a model of how they should work with their partners throughout the first small groupactivity.Collaborative group work on matching graphs and functions (30 minutes)Organize students into pairs or groups of three, and give each group a large sheet of paper, a gluestick, a pair of scissors, and one copy each of Card Set A: Graphs and Card Set B: Functions.Students should not use a calculator for this activity.I’m going to give each group a set of graphs and functions card. They all use the cosine function.Cut the sheets into cards. There is one blank – keep that, too.Take it in turns to match and place cards. Place them next to each other, not on top, so thateveryone can see.When you match two cards, explain how you came to your decision.Your partner should either explain that reasoning again in his or her own words, or challenge thereasons you gave.You both need to be able to agree on and explain the placement of every card.If you cannot find a card to match, then make one up yourself.There is a slide (P-1), Working Together, to remind students of these instructions.Whilst students are working, you have two tasks: to listen to the different ways that students approachthe task, and to support and challenge their reasoning.Notice students’ approaches to the task.Which aspects of the task do students find difficult? Which information do they first use to sort thecards? Which features do they use to match the cards? Are they able to interpret the period of thefunction, and relate this to the algebraic formula? Do they question each other’s reasoning? You canuse this information to focus whole-class discussion towards the end of the lesson.Support and challenge students’ reasoning.Try not to tell the students how to do the task at this stage. Instead, ask questions to help them clarifytheir own reasoning. The questions in the Common issues table may be helpful.In particular, when a student places a card, ask another student to justify the placement. This shouldhelp students to understand that the purpose of the task is for them to share their reasons for placingcards, rather than just correctly matching pairs.We suggest that if you need to split this lesson between two teaching periods, you break at this point.Give each group of students a paper clip and ask them to clip any unglued cards to their posters. Youcan then resume the lesson with the next collaborative activity.Teacher guideFerris WheelT-5
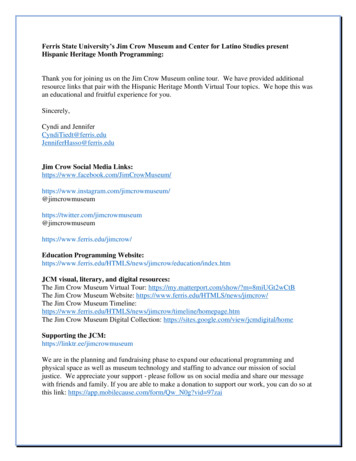
Collaborative group work on matching graphs and descriptions (20 minutes)Project the slide The Ferris Wheel (P-2) onto the board.The Ferris WheelProjector ResourcesFerris WheelP-2Give each pair of students a copy of Card Set C: Descriptions of the Wheels.Each of the functions you have been looking at models the motion of a Ferris wheel.I now want you to try to match the correct wheel description to the graphs and functions on thetable.On these graphs the heights are given in meters and the times in seconds.Matching these cards will encourage students to think about the motion of a wheel.As you watch students working, ask them to explain the connections they find:How is the height of the axle related to the graph?How is the speed of rotation related to the graph?How is the diameter of the wheel related to the graph?How is the height of the axle related to the algebraic function?How is the speed of rotation related to the algebraic function?How many degrees per second does this wheel turn through?How is the diameter of the wheel related to the algebraic function?Why do both these functions fit this graph?Why do we have two graphs with the same description?What is different about the graphs?Whole-class discussion (25 minutes)Organize a discussion about what has been learned. The intention is that you focus students ondescribing the relationships between the different representations, rather than checking that everyonegets the correct matches for cards.Sheldon, where did you place this card? How did you decide?Howard, put that into your own words.Ask students to come up with a general explanation of how to decide which function goes with whichsituation.Teacher guideFerris WheelT-6
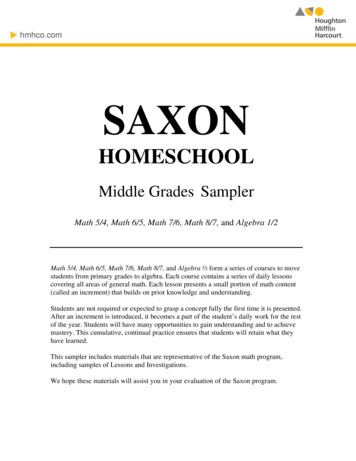
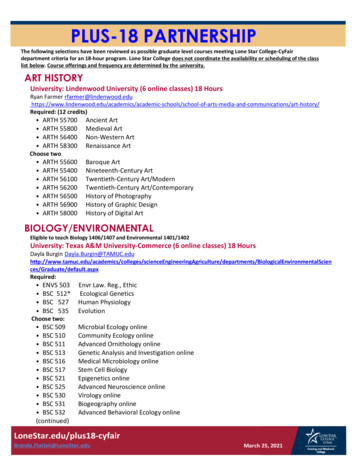
Suppose I wrote down the function h a - b cos t.What can you tell me about the Ferris Wheel?[Height of axle a; diameter of wheel 2b; turns once every 360 seconds.]Suppose I wrote down the function h a - b cos 2t.What can you tell me about the Ferris Wheel?[Height of axle a; diameter of wheel 2b; turns once every 180 seconds.]You may find it helpful to project the following diagram, which is reproduced on slide P-3, Analyzingthe Ferris Wheel, to help students explain the analytical connection between the geometry of thesituation and the function h a - b cos ct.The diagram shows the position of a rider, P, atsome time during the ride.Height of the axle OA aRadius of the wheel OP b"At this time, suppose the angle POA x%As P goes round steadily, then x ct for someconstant c.(c 1, wheel turns round once after 360 seconds; c 2, wheel turns round once every 180 seconds,and so on.)The height of the rider PB OA - OP cos x!# So h a - b cos ctFollow-up lesson: Review of work on Ferris Wheel (20 minutes)This work can be done either in a follow up lesson, or for homework.Re-issue students with their individual work on Ferris Wheel and give each student a copy of thesimilar task Ferris Wheel (revisited).Ask students to work individually to revise their work on the Ferris Wheel task, using the questionsyou have written on the board or on their work, for support.Read through your solution to Ferris Wheel, and answer the questions on the board/on yourscript.Make some notes on what you have learned during the lesson.Ask students to attempt the second task:Now try to answer the questions on the second sheet: Ferris Wheel (revisited).Can you use what you have learned to answer these questions?Teacher guideFerris WheelT-7
SOLUTIONSAssessment task: Ferris Wheel1. Height 012345678TimeThe graph of the Ferris Wheel’s motion shows how height varies periodically over time.It should show that:The graph has y-intercept (0, 10) as the passenger starts at the bottom.The amplitude is 60m, the diameter of the wheel. Minimum value of the function 10m,maximum 70m.The wheel rotates once every 4 minutes, so the minima / maxima are 4 minutes apart.The graph is a smooth curve.2. The function that models the situation is h 40 - 30 cos 90 t.This is of the form h a b cos ct, where:a 40m. This is the height of the axle of the Ferris Wheel.b -30m. The magnitude of this number is the radius of the wheel. The person’s height starts 30mbelow the axle, rising to 30m above the axle. The sign is negative because the person starts at thebottom (when t 0, h 40-30).c 90. This is the rate of turn in degrees per minute. To ensure that the wheel turns once every 4minutes, we obtain c by dividing 360 by 4.Since the minimum and maximum value of the cosine function are -1 and 1, the minimum andmaximum values of h are a - b (10m) and a b (70m) as required.Assessment task: Ferris Wheel (revisited)The task is structurally similar to the initial assessment task; all that has changed is the values of theparameters.1. Height 012345678Time2. h 30 - 25cos120tTeacher guideFerris WheelT-8
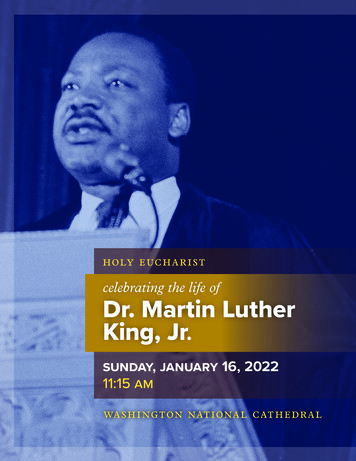
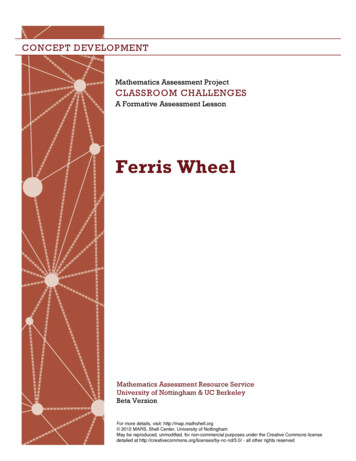
Lesson task: Card SortWhen matching cards, students may work in either direction: from graph to function, or function tograph.For example:Graph A immediately shows that the wheel has a diameter of 60 meters (it rises from 10m to70m) and the axle height is thus 40m (the mean of 10m and 70m).So this implies that in the function h a b cos ct, a 40 and b -30.The graph shows the wheel turns 2.5 times in one minute. This is a rate of 2.5 x 360/60 15degrees per second. Thus c 15. So the function that fits is: h 40 - 30 cos 15t (Card 4).Function h 60 - 20 cos 15t (card 6) may be interpreted as having an axle height of 60m, anddiameter of 40 m (it rises from 60-20 to 60 20) and the wheel turns once every 360/15 24seconds; or 2.5 times per minute. This fits with graph C.GraphFunctionDescriptionACard 4: h 40 - 30 cos 15tCard 3: Diameter of wheel 60 mHeight of axle above ground 40 mNumber of turns per minute 2.5BCard 10: h 60 - 30 cos 15tThe student has to write this function.Card 2:Diameter of wheel 60 mHeight of axle above ground 60 mNumber of turns per minute 2.5CCard 6: h 60 - 20 cos 15tCard 8: h 60 20 cos (15t 180 )GCard 2: h 60 20 cos 15tCard 1: Diameter of wheel 40 mHeight of axle above ground 60 mNumber of turns per minute 2.5DCard 3: h 40 - 30 cos 18tCard 9: h 40 30 cos (18t 180 )ECard 1: h 40 30 cos 18tFCard 5: h 60 20 cos 18tCard 6: Diameter of wheel 40 mHeight of axle above ground 60 mNumber of turns per minute 3HCard 7: h 40 20 cos 18tCard 5: Diameter of wheel 40 mHeight of axle above ground 40 mNumber of turns per minute 3Card 4: Diameter of wheel 60 mHeight of axle above ground 40 mNumber of turns per minute 3On the next page there is a photograph of a poster made using these cards.Teacher guideFerris WheelT-9
Teacher guideFerris WheelT-10
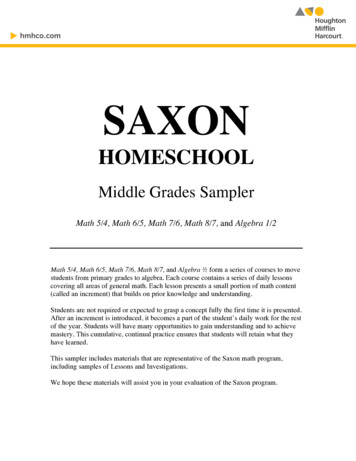
Ferris WheelA Ferris Wheel is 60 meters in diameter and rotates once every four minutes.The center axle of the Ferris Wheel is 40 meters from the ground.1.Using the axes below, sketch a graph to show how the height of apassenger will vary with time.Assume that the wheel starts rotating when the passenger is at thebottom.*!4.,562/ )!,0/(!-.2.73'!&!%! !#!"!!!"# %&'() ,-./,0/-,012.32.A mathematical model for this motion is given by the formula:h a b cos ctwhereh the height of the car in meterst the time that has elapsed in minutesa, b, c are constants.Find values for a, b and c that will model this situation.Student MaterialsFerris Wheel 2012 MARS, Shell Center, University of NottinghamS-1
Card Set A: 402060402000102030405060001020TimeStudent MaterialsFerris Wheel 2012 MARS, Shell Center, University of Nottingham30405060TimeS-2
Card Set B: Functions1.2.h 60 20 cos 15th 40 30 cos 18t3.4.h 40 - 30 cos 18t5.h 40 - 30 cos 15t6.h 60 20 cos 18t7.h 60 - 20 cos 15t8.h 40 20 cos 18t9.h 60 20 cos (15t 180 )10.h 40 30 cos (18t 180 )Student MaterialsFerris Wheel 2012 MARS, Shell Center, University of NottinghamS-3
Card Set C: Descriptions of the wheels1.2.Diameter of wheel 40 mDiameter of wheel 60 mHeight of axle above ground 60 mHeight of axle above ground 60 mNumber of turns per minute 2.5Number of turns per minute 2.53.4.Diameter of wheel 60 mDiameter of wheel 60 mHeight of axle above ground 40 mHeight of axle above ground 40 mNumber of turns per minute 2.5Number of turns per minute 356.Diameter of wheel 40 mDiameter of wheel 40 mHeight of axle above ground 40 mHeight of axle above ground 60 mNumber of turns per minute 3Number of turns per minute 3Student MaterialsFerris Wheel 2012 MARS, Shell Center, University of NottinghamS-4
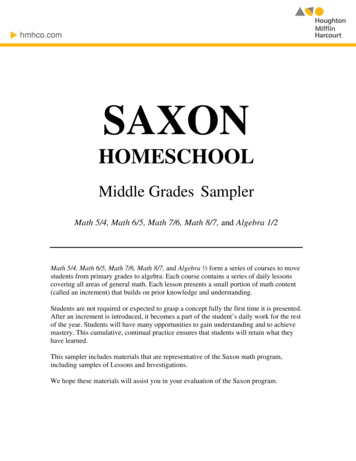
Ferris Wheel (revisited)A Ferris Wheel is 50 meters in diameter and rotates once every three minutes.The center axle of the Ferris Wheel is 30 meters from the ground.1.Using the axes below, sketch a graph to show how the height of apassenger will vary with time.Assume that the wheel starts rotating when the passenger is at thebottom.90Height 80in70meters60504030201000123456789Time in minutes2.A mathematical model for this motion is given by the formula:h a b cos ctwhereh the height of the car in meterst the time that has elapsed in minutesa, b, c are constants.Find values for a, b and c that will model this situation.Student MaterialsFerris Wheel 2012 MARS, Shell Center, University of NottinghamS-5
Working Together Take turns to match and place cards. When you match two cards:– Place cards next to each other so that everyone can see.– Explain carefully how you came to your decision. Your partner should either explain that reasoning againin his or her own words, or challenge the reasons yougave. You both need to be able to agree on and explain theplacement of every card. If you cannot find a card to match, then make one upyourself.Projector ResourcesFerris WheelP-1
The Ferris WheelProjector ResourcesFerris WheelP-2
Analyzing the Ferris WheelThe diagram shows the position of arider, P, at some time during the ride.Height of the axle OA aRadius of the wheel OP bAngle POA xAs P goes round,then x ct for some constant c.Height of the rider PB OA - OP cos xSo h a - b cos ctProjector Resources!Ferris WheelP-3
Mathematics Assessment ProjectCLASSROOM CHALLENGESThis lesson was designed and developed by theShell Center Teamat theUniversity of NottinghamMalcolm Swan, Nichola Clarke, Clare Dawson, Sheila EvanswithHugh Burkhardt, Rita Crust, Andy Noyes, and Daniel PeadIt was refined on the basis of reports from teams of observers led byDavid Foster, Mary Bouck, and Diane Schaeferbased on their observation of trials in US classroomsalong with comments from teachers and other users.This project was conceived and directed forMARS: Mathematics Assessment Resource ServicebyAlan Schoenfeld, Hugh Burkhardt, Daniel Pead, and Malcolm Swanand based at the University of California, BerkeleyWe are grateful to the many teachers, in the UK and the US, who trialed earlier versionsof these materials in their classrooms, to their students, and toJudith Mills, Carol Hill, and Alvaro Villanueva who contributed to the design.This development would not have been possible without the support ofBill & Melinda Gates FoundationWe are particularly grateful toCarina Wong, Melissa Chabran, and Jamie McKee 2012 MARS, Shell Center, University of NottinghamThis material may be reproduced and distributed, without modification, for non-commercial purposes,under the Creative Commons License detailed at ll other rights reserved.Please contact map.info@mathshell.org if this license does not meet your needs.
Ferris Wheel A Ferris wheel is 60 meters in diameter and rotates once every four minutes. The centre axle of the Ferris wheel is 40 meters from the ground. 1. Using the axes below, sketch a graph to show how the height of a passenger will vary with time. Assume that the wheel