Transcription
Neuroinform (2009) 7:93–111DOI 10.1007/s12021-009-9048-zDatabase Analysis of Simulated and RecordedElectrophysiological Datasets with PANDORA’s ToolboxCengiz Günay · Jeremy R. Edgerton · Su Li ·Thomas Sangrey · Astrid A. Prinz · Dieter JaegerPublished online: 28 May 2009 Humana Press Inc. 2009Abstract Neuronal recordings and computer simulations produce ever growing amounts of data, impedingconventional analysis methods from keeping pace. Suchlarge datasets can be automatically analyzed by takingadvantage of the well-established relational databaseparadigm. Raw electrophysiology data can be enteredinto a database by extracting its interesting characteristics (e.g., firing rate). Compared to storing theraw data directly, this database representation is several orders of magnitude higher efficient in storagespace and processing time. Using two large electrophysiology recording and simulation datasets, we demonstrate that the database can be queried, transformedand analyzed. This process is relatively simple andeasy to learn because it takes place entirely in Matlab,using our database analysis toolbox, PANDORA. Itis capable of acquiring data from common recordingand simulation platforms and exchanging data withexternal database engines and other analysis toolboxes,Electronic supplementary material The online versionof this article (doi:10.1007/s12021-009-9048-z) containssupplementary material, which is available toauthorized users.C. Günay (B) · J. R. Edgerton · A. A. Prinz · D. JaegerDept. of Biology, Emory University,1510 Clifton Rd., Atlanta, GA 30322, USAe-mail: cgunay@emory.eduS. LiNeurosurgery Department, School of Medicine,Emory University, Atlanta, GA 30322, USAT. SangreyComputational Neuroscience Unit,Okinawa Institute of Science and Technology,Okinawa, Japanwhich make analysis simpler and highly interoperable.PANDORA is available to be freely used and modified because it is open-source eywords Database · Data visualization · Matlab ·Neural model · Simulation · Electrophysiology ·SQL · Large datasets · Automated analysis ·Pandora · Open-sourceIntroductionThe amount of electrophysiological data is increasingas more channels can be sampled and recording qualityimproves, while rapid advances in computing speedand capacity (e.g., with grid computing) have enabledresearchers to generate simulation data very quicklyin massive amounts. Especially when diverse and customized sets of data analysis are used, proper handlingof this data poses a neuroinformatics challenge (Bjaalie2008).Since more than 30 years, relational databaseshave been successfully used to manage large amountsof data (Chamberlin and Boyce 1974; Elmasri andNavathe 1994). In neuroscience, databases have beentraditionally used to improve laboratory procedures,record keeping, and data sharing (Shepherd et al. 1998;Pittendrigh and Jacobs 2003; Hines et al. 2004; Morse2007; Gardner et al. 2008), but only more recentlythey were found to be useful for storing and analyzingneural data (Prinz et al. 2003, 2004; Calin-Jagemanet al. 2007), and being subjected to data mining (Lytton2006; Taylor et al. 2006; Günay et al. 2008b). Constructing databases of neural analysis results addresses a
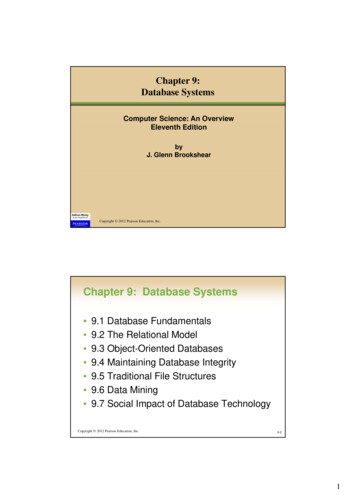
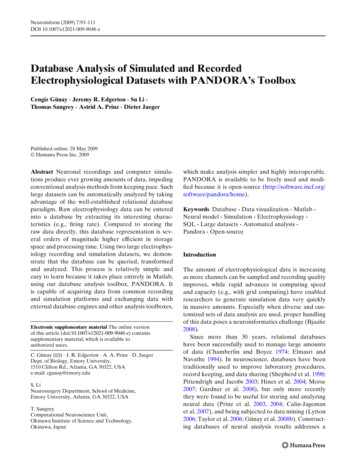
94bottleneck of neuroscience, which is analysis automation. In contrast, eyeballing or other semi-automaticanalysis procedures would make it intractable to analyze the traces produced by the hundred thousands,or even millions, of neuron and network models (Prinzet al. 2003, 2004; Calin-Jageman et al. 2007; Günay et al.2008a, b), or to analyze the continuous streams fromdozens of electrodes (Nicolelis et al. 2003). Fully automatic analysis was demonstrated by Prinz et al. (2004)of intracellular data traces from 20 million neuronalnetwork models, where the analysis results were savedin a custom database consisting of a collection of textfiles. Although reading text files is straightforward, understanding the organization of their contents requiresspecialized tools because of the lack of a queryingcapability. For instance, adding the output of a newanalysis method into the text files would entail parsingand reconstructing thousands of files occupying a spaceof several hundred gigabytes. Using a more generaldatabase tool can provide the same functionality muchmore easily. Despite the need for database approachesto neural data analysis, almost no software tool havebeen developed to date for general use. Günay et al.(2008a) used such a tool to study the rat globus pallidus(GP) by comparing a database of recordings from 146neurons to a database of 100,602 neuron models. In thecurrent study, we illustrate the strengths of this database approach, specifically with the PANDORA toolbox (Günay 2008a, b) employed in the above study.The PANDORA database approach transforms theraw data into numerical matrices by collecting itsimportant aspects (e.g., spike shape and firing ratecharacteristics), which enables the cross comparisonbetween the model and recorded GP neuron databases efficiently. PANDORA works within the Matlabenvironment (Mathworks Inc., Natick, MA), which allows accessing other commonly used electrophysiological and statistical analysis toolboxes such as Chronux(Brown et al. 2004; Bokil et al. 2006), FIND (Meieret al. 2008), BSMART (Cui et al. 2008), and sigTOOL(Lidierth 2009). Interoperability with other analysistools allows both: (1), improving reproducibility andcross validation of results; and (2), promoting to reuseexisting analysis methods that helps the developmentof robust community toolboxes (Cannon et al. 2007;Günay et al. 2008c; Herz et al. 2008). Interoperability isachieved by using compatible input and output formats.PANDORA can import data from several differentelectrophysiological acquisition and simulation programs, and it constructs a self-describing database bykeeping associated metadata in Matlab structures, thatcan be exported to several external spreadsheet anddatabase formats. Here, we describe the specific advan-Neuroinform (2009) 7:93–111tages of using the PANDORA toolbox for electrophysiological data analysis, first in analyzing the above GPdataset (Günay et al. 2008a), and then by extending thedatabase approach to study a network model datasetfrom the lobster stomatogastric ganglion (Prinz et al.2004; Günay et al. 2008b) to show that the toolbox iscapable of operating on different types of data.MethodsThe PANDORA toolbox defines a methodology tocreate searchable databases of electrophysiology data(see the user manual in Günay 2007, 2008a, b). Itcomes as an add-on toolbox to the Matlab computingand analysis environment (MathWorks Inc., Natick,MA). PANDORA is distributed free of charge withan open-source license (Academic Free License version3.0; rganized with an object-oriented approach (see Supp.Methods A.1.1).Overview of Database Analysisfor Electrophysiological DataIn PANDORA, database analysis consists of the following steps (Fig. 1):1. Organizing raw data files in a dataset for performing automatic analysis;2. Analyzing each raw electrophysiological data traceby measuring its electrophysiological characteristics (e.g., firing rate);3. Inserting sets of measured characteristics from allitems of a dataset into a database;4. Analyzing databases by comparing, merging, joining, reducing dimensions, and calculating correlations, histograms, statistics, and componentanalyses;5. Linking back to raw data traces associated withparticular analysis values found; and6. Visualizing raw or transformed results in a varietyof graphical representations.In this paper, we show application of this analysis approach first to a study of recordings and simulationsfrom the globus pallidus (GP) of the rat (Günay et al.2008a), and then to a study of the pyloric network of thelobster stomatogastric ganglion (Günay et al. 2008b). Inthe GP dataset, database analysis starts with identifyingthe sources from which to load the data.
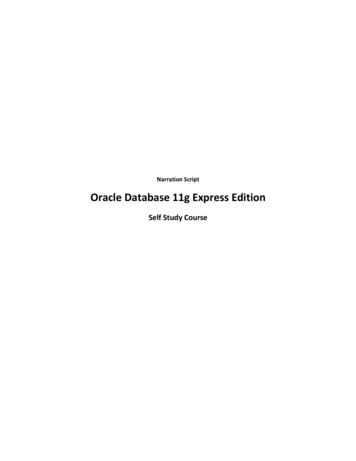
Neuroinform (2009) 7:93–11195Fig. 1 Main componentsof PANDORA. Raw datatraces are analyzed to createmeasurement profiles andthen inserted into thedatabase matrix along withmetadata. See text for thedetails of the required stepsOrganizing Data Files into a Datasetto Create a DatabaseThe model GP neuron dataset contains 100,602 neurons modeled with nine Hodgkin and Huxley (1952)type ion channels with variable maximal conductanceparameters (Günay et al. 2008a). Each of these modelsis simulated five times with different current stimulusmagnitudes. The result was a dataset of more than500,000 files. Especially with such large datasets, organizing and keeping track of data files scattered acrossmany directories becomes challenging. The process offinding data files, loading the data with correct parameters, and inserting the measured characteristics intoprofile objects to create databases is automated bythe dataset component in PANDORA (Fig. 1). Theseare achieved by keeping, in the dataset, the necessaryinformation such as the location of raw data files; andthe parameters used to load, preprocess and identifythem (see Supp. Methods A.1.2 for details). Using thisinformation, the dataset object creates the databasestructure after iterating through its data files.The dataset can process any Matlab-readable datafile. The supported data formats include the outputs ofneural simulators, such as Genesis (Bower and Beeman1998) and Neuron (Carnevale and Hines 2006), andoutputs of data acquisition programs compatible with theNeuroShare initiative (http://neuroshare.sourceforge.net; see Supp. Methods. A.1.3 for a full list of formats).After the data are loaded into Matlab, they areanalyzed to enter their salient characteristics into adatabase.Measuring Electrophysiological Characteristicsto be Entered into the DatabaseInteresting electrophysiological characteristics (e.g., firing rate) that deserve to be entered into the databasemust be extracted from loaded data files automatically.To achieve this, we programmed Matlab functions toextract a uniform set of characteristics from data tracefiles. As such functions for each data type need toextract different sets of salient characteristics, we groupthe functions into separate software components. Forinstance, functions for intracellular voltage traces ofthe GP dataset are grouped in the data trace component (Fig. 1). These functions extract the followingcharacteristics: the voltage mean, minima and maxima;action potential (AP) peaks and troughs from voltage minima and maxima using a sliding-windowapproach;firing rate statistics from AP times: mean rate andinter-spike-intervals (ISIs), their standard deviation and ISI coefficient of variation (ISI-CV);the AP initiation point, using complex heuristics(Sekerli et al. 2004); and,using the initiation point, spike shape characteristics such as: the amplitude, rise and fall times, andthe after-hyperpolarization (AHP) depth (Fig. 2a).In the case when a stimulus is applied to the traces,additional characteristics must be measured.Measuring Responses to a Current Injection StimulusTo test the input resistance of the neurons in the GPdataset and to find their firing rate as a function ofinput current (f/I curve), we used a current injectionpulse (CIP) stimulus, which is commonly employed forcurrent-clamp recordings and simulations. When thereis a stimulus applied, the change in electrophysiologicalcharacteristics depending on the timing of the stimulusbecomes interesting. With the use of the CIP stimulus protocol, the electrophysiological characteristics ofthe activity before, during and the recovery after the
96ANeuroinform (2009) 7:93–111Bvoltage [mV]annotated spike characteristics-60-70-80Creating a Database from Measured Dataset Files-90A prerequisite to creating a database is having themeasured characteristics uniform across dataset elements. During the creation, one function of the datatrace component collects all of these characteristics andplaces them in a trace profile component object (Fig. 1).To form the database object, multiple profile objectsare concatenated together into a matrix.Since the measured characteristics and the parameters of the data files are all numeric, the PANDORAdatabase object consists of a double-precision numerical matrix and its associated metadata. The metadataconsists of parameters associated with the recordingor simulation such as an identifying number, conductance values or drug concentrations. The dataset transfers the data and metadata from the files to createthe database structures. To demonstrate this, a simpleexample shows how a database can be created fromarbitrary data and metadata (Fig. 3). The metadataallows giving labels to the indices such as ‘firing rate’,‘spike amplitude’, etc. The labels can be given to therows, columns and pages (the third dimension) of thematrix, although the matrix can hold more dimensions. By convention, columns represent parametersand measurements, and rows represent independentobservations (e.g., from a neuron, or from one of itstraces with specific parameters). This convention allows specific types of analyses to be performed on thisdatabase.-10014501500time [ms]1550Fig. 2 PANDORA offers functions for automated measurementof electrophysiological characteristics from intracellular voltagetraces. a Action potential (spike) shape characteristics of threshold, base width, amplitude and afterhyperpolarization (AHP)annotated on a single spike. b Automatically found spikes annotated on a recorded intracellular trace (PANDORA commandsto obtain this plot are given in Supp. Matlab Code 1)CIP period can be observed (Fig. 5c). Thus, the abovemeasurements are replicated for each of these periodsfor CIP-applied data traces (cip trace componentin Supp. Mat. A.3). We also include additional measurements special to CIP-applied traces (described inGünay et al. 2008a), such as: Once a comprehensive set of measurements are extracted from electrophysiology traces, they are usedto represent the recorded or simulated neuron in theabsence of the raw traces.the firing rates at the beginning and at the end ofthe CIP period corresponding to the initial responseto current stimulus and the steady-state firing ratereached,the firing rate of the two halves of the recoveryperiod corresponding to the initial recovery andsteady-state rate reached,the ratio of the firing rates in periods before andafter CIP,the voltage “sag” when a hyperpolarizing current isapplied to measure the hyperpolarization-activatedinward current (Ih ), andthe firing rate accommodation during the CIP period (ratio of last ISI to first ISI).Database AnalysisDatabase analysis is performed by asking queries andapplying transformations to a database and placing theresults in new database objects (Supp. Methods A.1.4).Statistics, histogram, or cross-correlation functions that db obj tests db([1 2; 3 4],{’col1’, ’col2’},{’row1’, ’row2’}, ’a 2x2 DB’)Fig. 3 A simple example of creating a database from a 2 2arbitrary data matrix. tests db is the name of the databasecomponent and it also represents the constructor function thatgenerates such database objects. The function uses its argumentsto generate the database object assigned to the db obj variable.The function arguments consist of the matrix data, metadatato label column and row dimensions, and finally an identifying name for the database (see the Supp. Methods and theonline PANDORA Manual in Günay 2007, 2008a, b for moredetails)
Neuroinform (2009) 7:93–11197operate on a database produce their results in newspecialized database objects. For instance, when thehistogram of a database column is calculated, the histogram bins appear in a new histogram database object (histogram db component in Supp. Mat. A.1.4)with the bin center and height as columns, whichallows visualization and calculation of statistics such asthe Kullback–Leibler (KL) divergence (Kullback andLeibler 1951; Johnson and Sinanović 2001; Sinanovićand Johnson 2007, see Supp. Methods A.1.6). Similarly, a database can be subjected to statistics functions such as mean, mode, median, standard deviation,and standard error that generate a statistics database(stats db component). In this database, the numberof samples used for calculating the statistic is reportedseparately for each column for downstream analysisand plotting functions (e.g., see n values in bar plotsof Figs. 5b and 8b) because it may be different due tomissing values in the originating database. These missing values are represented by the not-a-number (NaN)symbol of Matlab, and treated specially by variousPANDORA functions (e.g., averaging will skip NaNs).Since the statistics results are in databases, they can bequeried to find an activity of interest (e.g., histogrampeak, tail, outliers or specific ranges) and the queryresults can be used to query the original database to findthe individual neurons that contributed to the desiredactivity.The results of the function are the mean and the standard deviation (STD) of the measured characteristicscorresponding to the repeated rows (see Supp. Matlab Code 2 for an example). After averaging repeatedexperimental conditions, we needed to find effectson characteristics between the changing parameterconditions.Querying the DatabaseComparing Measured Characteristics of Two NeuronsThe database contents can be searched by placing multiple constraints on the metadata and measured characteristics in database queries. In PANDORA, queriesare expressed in the Matlab language syntax for addressing vector and matrix indices using parentheses,allowing the use of Matlab logical expressions (seeSupp. Methods A.1.4 for examples). Returning matching database entries is only a simple application ofqueries, and they can be used to achieve more elaboratetasks. For example, queries were used to find uniqueparameter sets for automatically averaging repeatedtrials in the GP dataset.Comparing neuron representations is especially useful to test whether a model neuron successfully simulates features of recorded neurons. The measuredcharacteristics in the database represent a neuron ina vector format, making it easy to compare the characteristics across neurons (see Supp. Methods A.1.10for PANDORA commands used). We use the normalized Euclidean distance method to calculate a distance between two vector neuron representations (seeSupp. Methods A.1.9). Although these analysis methods are described above in the context of the GPdataset, they can be applied to the analysis of othertypes of data.Averaging Repeated Trials in the DatabaseOften experimental data from repeated trials withthe same recording conditions need to be averaged.PANDORA’s meanDuplicateParams function (seeSupp. Section A.3) does this by collapsing all databaserows that are equivalent in terms of chosen parameters(e.g., stimulus conditions) but, at the same time, distinguished by other parameters (e.g., neuron identifiers).Multivariate Parameter AnalysisIn electrophysiology datasets, it is common to havemultiple recording or simulation parameters. Acrosstrials, parameters such as drug concentrations andstimuli magnitude vary. Especially in large datasets,unavoidable inconsistencies between values of theseparameters makes it harder to find parameter effects on electrophysiological characteristics. For findingstatistically significant effects, a sufficient number ofconsistent parameter values must be identified, whichcan be achieved with multivariate analysis methods.PANDORA has functions to identify consistent values,at the same time for several parameters, and calculatestatistics from their effects on measured characteristics(see Supp. Methods A.1.8 for details and examples).Independent of the parameters, the uniform set of characteristics in the database also made it straightforwardto compare neuron representations to one another.Database Analysis of a Neuron ActivitySensor DatasetTo show how to analyze data other than the GPintracellular voltage recordings in PANDORA (seeSupp. Methods A.1.12), we applied the PANDORAmethodology to a database of 20,250,000 models of the
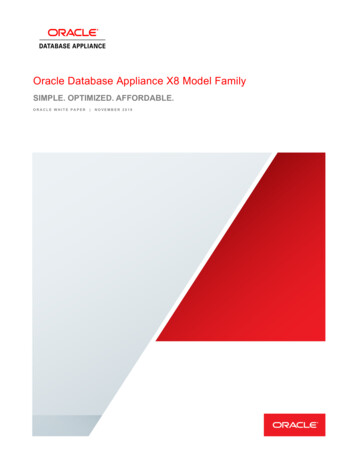
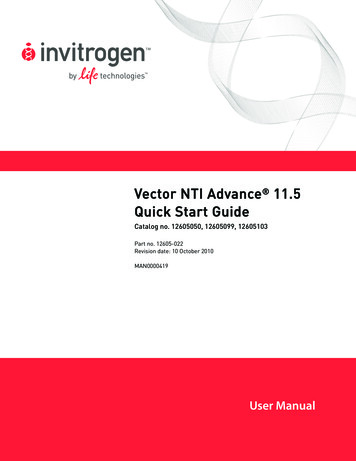
98Neuroinform (2009) 7:93–111Fig. 4 Electrophysiologicalactivity of the real and modelpyloric networks of thelobster stomatogastricganglion. a Recordedfunctional network rhythmsfrom the pyloric network.(b, c) Example functional(b) and non-functional (c)activity produced by themodel pyloric networksABpyloric network in the stomatogastric ganglion (STG;Fig. 4a) of the lobster (Prinz et al. 2004). We used a newset of simulations of these models where the averagevalues of calcium-dependent activity sensors (Liu et al.1998) were saved from the model neurons in eachnetwork to create a sensor dataset (Günay et al. 2008b).In this dataset, average sensor readings from a singlemodel network represented the raw data. From the rawsensor data, we measured the separation between functional and non-functional network models and savedthem as characteristics in a database. These characteristics included a separation success rate obtained froman optimal linear classifier using sensor readings (seeSupp. Methods A.1.13). From the characteristics in thedatabase, this project aimed at identifying sensor parameters that can distinguish functional network activitypatterns (Fig. 4b) from non-functional activity (Fig. 4c).Out of the 20 million networks, we only used a 10thousand-network subset that was chosen randomly.We chose this subset because it provides a good representation of the entire dataset, which is too large toanalyze directly (Günay et al. 2008b).In the sensor database each network model has threemodel neurons with 366 sensors with different parameters, which makes the database especially large.Therefore, to store the bulk of the data we used anexternal MySQL (MySQL AB, Uppsala, Sweden) database. Manageable chunks of 10,000–250,000 networksfrom this database was transferred to PANDORA foranalysis. Next, we describe the specific advantages ofthe PANDORA database analysis approach, startingwith the analysis done on the GP dataset.ResultsIn Günay et al. (2008a), we considered a large modelneuron database for matching the experimentally observed variability in rat globus pallidus (GP) neurons,and we showed that models matching recordings couldbe found efficiently by PANDORA (Fig. 5 showsthat the distributions of model neuron characteristics,n 89766n 14402040 50100spont. rate [Hz]AP amp. [mV]05AP width [ms]n 14410501 2Fig. 5 Extracted electrophysiological characteristics wereadequate for comparing model and recorded GP neurons. aSpontaneous firing rate, action potential (AP) amplitude, andhalf-width characteristic distributions from the model neurondatabase were similar (symmetric KL divergence 6.19, 1.65, and360402001 2 100 pA210- 100 pA2nd pulse spike5050n 14480voltage [mV]15n 89104spike width500020spike amplitude2550Cn 100602010000model countUsing External Storage for Large DatabasesB10spont firing rateneuron countAC00- 50- 50500- 50500- 5001 2123 0123510time [ms]0.98 bits, respectively; see Supp. Methods A.1.6) and overlappedwith distributions from the recorded neuron database. b Meanand standard deviation (STD) of the characteristics displayed inpanel a (1: real, 2: model database). c Raw traces of matchingreal (top) and model (bottom) neurons
Neuroinform (2009) 7:93–11199obtained only with conductance variations, are highlysimilar to that of recorded neurons). Here, we showin more detail the use of PANDORA in addressingthis and similar problems that require database studiesof electrophysiological recordings and simulations. Inthe subsequent sections, we show the advantage ofconstructing databases of extracted electrophysiological characteristics (such as spike times, spike shapeinformation, and firing rates) rather than directly usingthe raw data traces from real and model GP neurons,and how these resulting databases of extracted characteristics can easily be queried to find interesting features of the neurons. Then, to establish the advantageof an automated technique over manual analysis ofdata, we demonstrate more practical uses of the database for routine maintenance of GP neural data suchas averaging redundant recording trials. The databaseapproach is useful for more complex parameter analysisthat is often needed for understanding neural data. Thefollowing section describes the multivariate analysisperformed in PANDORA to find the effects of pharmacological block experiments in GP recordings andmatching model manipulations in the nine conductanceparameters. Furthermore, our approach to extract thesame characteristics from recorded and simulated neurons enabled their direct comparison, thus allowing usto better analyze parallels between model and real GPneurons. In the following section, we describe how tofind models with different conductance densities thatbest match different recorded GP neurons and describe their natural variability. Finally, to show that thePANDORA analysis techniques can be applied to studies on datasets other than these GP neuron databases,we describe the database analysis to study a lobsterstomatogastric ganglion neuronal network model in thefinal results section (Günay et al. 2008b). This studyconcerns 20 million instances of the network model andaims to find activity sensors that work best for separation of functional network activity patterns (Fig. 12shows that activity sensors with inactivating variablesperformed better in these model networks).among the characteristics in the database, the raw datacan be consulted again for validation, visualization,and further analysis. To access the raw data associatedwith the results found, a database must also containthe recording or simulation parameters as metadata(e.g., an identifying label, current stimulation amplitude, physiological blocker concentration, etc.).In Günay et al. (2008a), constructing such a database of extracted electrophysiological characteristicsproved to be an efficient way to examine the overalldistributions of electrophysiological data. The characteristics were extracted from 146 neurons recordedfrom the rat globus pallidus (GP) and from 100,602model GP neurons. Characteristics, including for example firing rate, spike width and amplitude, andafterhyperpolarization depth before, during and after stimulation (see “Methods”), were extracted fromvoltage traces recorded in current-clamp mode (see“Methods”, Fig. 5c). The extracted databases improvedthe efficiency of the analysis by reducing the amountof data to be accessed: (1) the disk space occupiedby the raw data was reduced from 2.4 gigabytes to357 kilobytes for the recorded neuron database—areduction of about four orders of magnitude; (2) andthe simulation data was reduced from 6.8 gigabytes,in compressed form, to 109 megabytes in the databaseformat. These databases of extracted characteristicswere not intended to replace the raw data, but ratherto complement it.After constructing these two databases, we compared them to judge the quality of the model neuronsin representing the recorded biological neurons (Fig. 5).Comparing the histograms representing the characteristic distributions of from both databases indicated thatthe varying conductance densities in the models canexplain the natural variability found in GP neurons(Fig. 5a). Statistics of these characteristics offered asummary of comparison between the two databases(Fig. 5b). Highly similar recorded and model neuronscould be found in the databases by using the queryingcapabilities of PANDORA (Fig. 5c).Constructing a Database of ExtractedElectrophysiological Characteristics was EfficientThe Database Can be Queried in Matlab for FindingSpecific Neuronal PhenomenaEspecially with large datasets (Prinz et al. 2003, 2004;Calin-Jageman et al. 2007; Günay et al. 2008a), it becomes difficult to store, search, and process the rawdata quickly and efficiently for answering specific questions. Questions can be answered much faster if characteristics (such as firing rate) that pertain to the targetquestions are extracted and placed in a more compactdatabase format. Once interesting entries are foundAn important advantage of using database-supportedanalysis is that we can query the data easily. For instance, in the GP recording database, the bias currentapplied to maintain recording quality was varied acrosstrials from the same cell. To be consistent across trials,results from recordings with excessive bias currents hadto be removed before interpreting the data. A single,simple PANDORA query composed of Matlab logical
100Neuroinform (2009) 7:93–1112125- 250 S/m levels of NaF2000B Effect of NaF on AP half- widthNaF 125NaF 250Count0- 20- 40- 600-1.5Small effect of NaF on halfwidth50201000Cvoltage [mv]ANaF 125NaF 2500- 50- 80-1-0.506Δ half width [ms]810121468time [ms]10time [ms]Fig. 6 PANDORA’s querying capability allows picking up models that exhibit characteristics in different regions of a distribution. a Histogram distribution of the effect of changing the fastsodium conductance (NaF) from 125 to 250 S/m2 on the actionpotential (AP) half-width in the GP model neuron database. b Ata fixed conductance background in two example model neuronsshow a large change in AP half-width with increasing NaF.c Another pair of models show a small change in AP half-widthwith increasing NaFexpressions allowed removing rows of characteristicsextracted from such trials (see Supp. Methods A.1.4).Querying is also useful to find traces or neuronsfrom the histogram distributions which are outliers, orbest represent an example of a desired activity pattern (Fig. 6). Together with sorting functions, queryingallows finding maximal values from a database, suchas the neuron with the fastest firing rate, with theshallowest afterhyperpolarization (AHP), or with thewidest spike. Multiple queries can be nested or logicallylinked with Matlab logical operators, and additiona
tages of using the PANDORA toolbox for electrophys-iological data analysis, first in analyzing the above GP dataset (Günay et al. 2008a), and then by extending the database approach to study a network model dataset from the lobster stomatogastric ganglion (Prinz et al. 2004; Günay e