Transcription
NBER WORKING PAPER SERIESCOAL SMOKE AND THE COSTS OF THE INDUSTRIAL REVOLUTIONW. Walker HanlonWorking Paper 22921http://www.nber.org/papers/w22921NATIONAL BUREAU OF ECONOMIC RESEARCH1050 Massachusetts AvenueCambridge, MA 02138December 2016I thank David Atkin, Dan Bogart, Leah Boustan, Karen Clay, Dora Costa, Neil Cummins, PabloFajgelbaum, Roger Foquet, Tim Guinnane, Matt Kahn, Ed Kung, Miren Lafourcade, NaomiLamoreaux, Adriana Lleras-Muney, Petra Moser, Alexander Rothenberg, Werner Troesken andseminar participants at Arizona, Arizona State, Boston University, Bristol, Carnegie-Mellon,LSE, NYU Stern, UC Davis, UC Irvine, UCLA, USC, Warwick, Wharton, The World Bank, andYale for their helpful comments. Reed Douglas, Qiyi Song and Vitaly Titov provided excellentresearch assistance. I thank the Rosalinde and Arthur Gilbert Program in Real Estate, Finance andUrban Economics at UCLA, the California Center for Population Research at UCLA, and theNational Science Foundation (CAREER Grant No. 1552692) for generous funding. The viewsexpressed herein are those of the author and do not necessarily reflect the views of the NationalBureau of Economic Research.NBER working papers are circulated for discussion and comment purposes. They have not beenpeer-reviewed or been subject to the review by the NBER Board of Directors that accompaniesofficial NBER publications. 2016 by W. Walker Hanlon. All rights reserved. Short sections of text, not to exceed twoparagraphs, may be quoted without explicit permission provided that full credit, including notice, is given to the source.
Coal Smoke and the Costs of the Industrial RevolutionW. Walker HanlonNBER Working Paper No. 22921December 2016JEL No. N13,N53,Q52,R11ABSTRACTWhile the Industrial Revolution brought economic growth, there is a long debate in economicsover the costs of the pollution externalities that accompanied early industrialization. To helpsettle this debate, this paper introduces a new theoretically-grounded strategy for estimating theimpact of industrial pollution on local economic development and applies this approach to datafrom British cities for 1851-1911. I show that local industrial coal use substantially reduced longrun city employment growth over this period. Moreover, a counterfactual analysis suggests thatplausible improvements in coal use efficiency would have led to substantially higher urbanizationrates in Britain by 1911.W. Walker HanlonDepartment of EconomicsUniversity of California, Los Angeles8283 Bunche HallLos Angeles, CA 90095and NBERwhanlon@econ.ucla.edu
1IntroductionThe Industrial Revolution represented a watershed in economic growth, yetthere is a long-running debate over the costs that industrialization imposedon the generations that lived through these events. In the early stages ofthe Industrial Revolution, factories were predominantly driven by clean waterpower, but by the mid-19th century, coal had become the dominant powersource. As a result, by the 1840’s, contemporary writers such as Engels (1845)described cities blackened with thick smoke and urban slums crowded withdiseased and dying people.How large were the external costs of Britain’s reliance on dirty coal powerin the 19th and early 20th century? Existing work on this topic, such asWilliamson (1981b), suggests that these costs were not large. However, thesefindings have been criticized for drawing broad conclusions, which seem to contradict contemporary evidence, from relatively sparse data (Pollard (1981)).1As a result, the debate over the size of the negative externalities that accompanied the Industrial Revolution remains largely unresolved. This matters,both because of the central role that the Industrial Revolution played in economic history and because the experiences of early industrial countries areused to help inform the decisions of countries, such as China and India, thatare currently struggling with the negative consequences of industrial growth.This study documents the impact of industrial pollution on long-run localeconomic development in English cities from 1851-1911. I focus specifically onthe effects of air pollution generated by coal burning, the most important typeof industrial pollution during this period. In order to measure how industrialpollution affected local economic growth, I extend a standard Rosen-Roback1See also (Williamson, 1981a, 1982).1
model to accommodate many industries which are heterogeneous in their useof a polluting input, coal. The theory delivers a new estimation approachthat has three key features. First, it allows me to separate the positive effectof industry growth on local employment growth, through job creation, fromthe negative effects that are generated when this growth occurs in heavilypolluting industries. These negative pollution effects, which operate on allindustries in a city, can occur either because pollution makes a location lessattractive (the amenities channel), or because pollution makes workers andfirms less productive (the productivity channel). The second feature of myestimation strategy is that it will capture the impact of pollution occurringthrough both of these channels. A third feature of my estimation strategy isthat it can be implemented without the need for local wage and rent data,which are largely unavailable during the period I study. Instead, I use a modelto show how data on quantities, in this case the quantity of employed workers,can be used in place of the more scarce data on prices (real wages in thiscase). As a result, my approach requires only panel data on city-industryemployment, which I have constructed for every decade from 1851-1911 for 31English citiesMy results show that industrial coal use substantially reduced long-run employment growth in English cities during this period. Specifically, in Englishcities that experienced rapidly rising coal use, employment growth was systematically lower relative to the growth that we would have expected given theinitial mix of industries in each city and national industry growth rates. Themagnitude of these effects was large; based on my estimates, over a two-decadeperiod, a city in which local industrial coal use grew at a rate that was onestandard deviation above the national average would, as a consequence, have2
experience a reduction in employment growth of 21-26 percentage points, equalto about one-half of the average growth in employment across two-decade periods. These estimates reflect the external effect that coal use in some industriesexerted on other sectors of the local economy. These findings are robust to theinclusion of a wide range of control variables including the initial level of coaluse in each location, the city’s proximity to coal reserves, city features suchas weather, initial city innovation rates, changing local agglomeration forcesoperating through input-output connections or labor market pooling, changesin the share of high-skilled workers in the city, the share of exporting industriesin the city, changes in the average local firm size, etc.To assess the implications of these results for overall urbanization levels,I conduct a simple counterfactual to study the impact of more efficient coaluse. This counterfactual is motivated by the 1871 Coal Commission Report, adetailed 1300 page study of coal use in Britain commissioned by Parliament.The report highlights substantial inefficiencies in industrial coal use and describes how simple low-cost improvements could have substantially reducedindustrial coal use. However, these improvements were not adopted due to thecombination of low coal prices, weak pollution regulation, and the fact thatmost of the impacts of pollution were external to firms. Guided by this report,I consider a counterfactual in which the growth of coal use from 1851-1911 wasreduced by ten percent. My results suggest that the 31 analysis cities wouldhave had an additional 1.5 million residents by 1911 and that their share of theEnglish population would have been higher by four percentage points. Thus,my results suggest that had Britain adopted regulations to improve coal useefficiency the nation would have been substantially more urbanized by theearly 20th century.3
To my knowledge this is the first study to document the effects of industrial pollution on local economic development over the long-run, though Ibuild on previous work such as Kahn (1999).2 This is possible, in part, because of the unique features offered by the historical setting that I consider.First, the cities covered by my study experienced high variation in the levelof local pollution. This variation makes it possible to identify the impacts ofpollution despite the fact that many other factors influence city growth. Second, population mobility was relatively high during this period, which meansthat city population and employment could respond to the effects of pollution.3 Third, regulation was relatively limited. This includes both pollutionregulation and regulations, such as zoning, that often constrain city growth inmodern contexts. Fourth, detailed census data are available which allow meto track city-industry employment consistently across six decades in order tostudy long-run effects.An important feature of the analysis approach that I propose is that itwill capture the effect of local industrial coal use on both the level of cityamenities, which influences the supply of workers in a city, as well as theimpact on the productivity of local firms, which will influence the demand forworkers. Previous work on this topic, such as Williamson (1981b), has focusedonly on the amenity channel. However, a growing body of literature suggests2Kahn (1999) studies the impact of a decline in local manufacturing on local pollutionlevels in rust-belt cities in the U.S., but does not estimate the impact of the pollution declineon local economic development. Another closely related paper is Chay & Greenstone (2005),which looks at the impact of pollution reductions resulting from the Clean Air Act on localhousing values. Two other related papers are Banzhaf & Walsh (2008) and Bayer et al.(2009). The main difference between these previous contributions and the present paper isthat I study long-run effects while focusing on local employment as the main outcome ofinterest.3See Long & Ferrie (2003) and Baines (1985).4
that air pollution can have important effects on productivity.4 The intuitionbehind my approach is that, regardless of whether coal use affects consumeramenities or firm productivity, the implications for employment are the same.Thus, focusing on employment as the outcome of interest allows me to captureboth of these channels. In contrast, these two channels have opposing effectson the urban wage premium. Thus, if the productivity channel is importantthen a small urban wage premium (as found by Williamson (1981b)) can bestill be consistent with large pollution costs. Moreover, the model makes itclear that when pollution affects productivity, the costs of urban pollutioncannot be inferred from the urban wage premium alone. Using a cross-sectionof local wage, rent and price data from 1905, I provide tentative evidencethat the productivity effects of coal use were particularly important duringthe 19th century. This suggests that approaches that ignore this channel maybe missing much of the costs of local pollution.This study reconciles the quantitative estimates of the costs of industrialpollution during the Industrial Revolution with the qualitative historical evidence describing the severity of the pollution problem during this period (e.g.,Brimblecombe (1987), Mosley (2001),and Thorsheim (2006)) as well as withour current understanding of the substantial impacts that air pollution canhave, even at the much lower concentrations experienced in modern developed economies. It also contributes to a growing set of quantitative studiesexamining the historical impact of coal-based air pollution.5This study is also related to a growing literature in urban economics focusing on the consumption value of cities, and in particular, to work that4See, e.g., Graff Zivin & Neidell (2012), Hanna & Oliva (2015), Chang et al. (2014),Chang et al. (2016), Isen et al. (Forthcoming), and Ebenstein et al. (2016).5These include Troesken & Clay (2011), Barreca et al. (2014), Clay et al. (2015), Clayet al. (2016), Heblich et al. (2016), and Beach & Hanlon (2016).5
considers endogenous amenities related to the composition of city residents(Moretti (2004), Diamond (2016)). In contrast, this paper highlights how theindustrial composition of cities can also affect city amenities, through pollution, and introduces an analysis strategy that can be used to measure theimpact of industrial pollution on local employment growth over the long-run.In the next section I describe the empirical setting. Data and measurementare discussed in Section 3, followed by the theory, in Section 4. The analysisis presented in Section 5, while Section 6 concludes.2Empirical settingLandes (1998) describes the Industrial Revolution as composed of three elements: the replacement of human skill by machines, the introduction of engines to convert heat into work, and the substitution of mineral power sources– chiefly in the form of coal – for other power sources. One consequence ofthese changes was rapid growth in coal use by industry, particularly in thesecond half of the 19th century. British coal consumption averaged 65 million tons annually in 1852-1862 and rose to 181 million tons in the 1903-1912period.6 This amounted to 4.3 tons per person in 1911.7 Most of this coal– 60-65 percent – was burned by industry, and coal remained the dominantpower source, by far, throughout this period.8 Because some industries were6These figures are from the U.K. Department of Energy and Climate Change. For furtherdetails, see Appendix A.1.7These figures are in imperial tons per year. For comparison, in 2012 the U.S. consumedabout 2.5 tons of coal per person annually, China consumed about 2.7 tons per person, andAustralia, one of the heaviest users, consumed around 5.8 tons per person. However, todaymost coal use occurs in electricity generation plants outside of urban centers.8Data from Mitchell (1988). Industry here includes both manufacturing and mining. Incontrast, residential coal use accounted for only 17-25 percent of domestic consumption, butattracted more attention because it was particularly important in London. The remainder6
particularly intensive users of coal, and these industries tended to agglomerate,industrial coal use could be highly geographically concentrated.9 Also, beforeelectricity transmission, power had to be generated on-site at factories, whichwere located in urban areas where they could be reached on foot by workers,increasing pollution exposure.The pollution released by coal burning factories in 19th century Britainwas widely recognized and discussed. For example, The Times (Feb. 7, 1882,p. 10)10 wrote,There was nothing more irritating than the unburnt carbon floatingin the air; it fell on the air tubes of the human system, and formeda dark expectoration which was so injurious to the constitution; itgathered on the lungs and there accumulated.While pollution in London was more likely to be experienced by visitors andnoted by the press, coal smoke pollution was particularly severe in the industrial cities of England. For example, describing a visit to Northwest Englandin 1890, Cannon Hardwicke Drummond Rawnsley wrote,.chimneys, solid and square, were belching forth clouds of Erebeandarkness and dirt.The heavens were black with smoke, and thesmother of the mills, to one whose lungs were unaccustomed tobreathing sulphurised air, made itself felt.is composed of use by transportation and utilities. It is worth noting that residential coaluse was more polluting, per ton burned, than industrial coal use. This is because it wasburned less efficiently (at lower temperatures) and released at lower altitudes.9These agglomeration patterns generally dated to the late 18th or early 19th centuryand were often due to geographic factors. For example, the location of the textile industryin the Northwest of England was driven by historical factors, such as the location of waterpower, that were of less importance in the second half of the 19th century (Crafts & Wolf(2014)).10Quoted from Troesken & Clay (2011). See that paper and Thorsheim (2006) for manyother examples.7
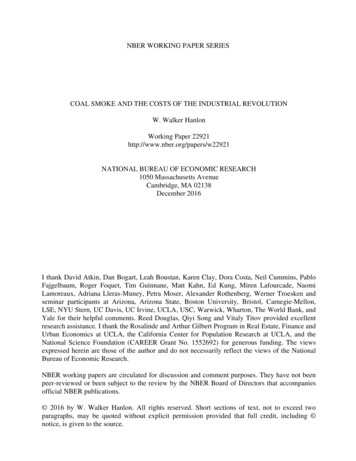
Figure 1 provides an illustration of the impact of industrial pollution inSheffield, perhaps the most polluted of the northern industrial cities. Theseimages come from 1920, after the end of the study period, but are likelyto be similar to the conditions experienced during the late 19th and early20th centuries. The left-hand image was taken on Sunday morning, whenthe factories were at rest, while the right-hand image was taken from thesame vantage point on Monday at noon, when the factories were at work.Residential pollution would have been present at both times, so the contrastbetween these images illustrates the impact that industrial pollution had inthe industrial cities of England.Figure 1: An illustration from Sheffield in 1920Sunday morning – the factories at restMonday at noon – the factories at workThe pictures above were taken from the same vantage point in Sheffield in 1920. Whilethis is after the study period, the levels of pollution it reveals are likely similar to thoseexperienced during the period I study. From William Blake Richmond, “The Smoke Plagueof London”, in London of the Future, Ashton Webb Ed., 1921. Reproduced from InventingPollution, by Peter Thorsheim (2006), Athens: Ohio University Press.While the health effects of air pollution were not fully understood by contemporaries, there was some appreciation for the link between coal-based air8
pollution and poor health.11 Today we know that burning coal releases a variety of pollutants into the atmosphere, including suspended particles of sootand other matter, sulfur dioxide, and carbon dioxide. The release of suspendedparticles is particularly severe when combustion is inefficient, as it often wasin the 19th century. These pollutants have a variety of negative effects on thehuman system which have been documented in a large literature.12Several recent studies have documented the impact of pollution exposureon worker productivity. For example, Graff Zivin & Neidell (2012) show thatozone exposure reduced the productivity of agricultural workers. Using datafrom Mexico City, Hanna & Oliva (2015) show that air pollution can impacthours worked. Chang et al. (2016) shows that day-to-day variation in particulate pollution exposure lowered the productivity of pear packers. Theirestimates suggest that the relatively small reductions in PM2.5 particulatesachieved in the U.S. from 1999-2008 generated 16.5 billion in labor cost savings. Chang et al. (2014) uses evidence from call-center workers in China toshow that the productivity effects of air pollution exposure extend even towhite-collar jobs. In addition, early-life pollution exposure has been linked toa range of negative outcomes, including on cognitive ability and human capital11One illustration of this is the 1867 report of the Sanitary Association by Dr. M.A.Morgan on Manchester (reported by The Times, April 16, 1867), in which stated that,“the chief solid impurity of the air of Manchester is coal smoke, and its mode of action onthe human body is of two kinds – (1), as an irritant to the lungs, producing bronchitis orassisting in the production and maintenance of this disease.and (2), by its sulpherettedhydrogen reducing the tone of the system, and rendering it easily susceptible to zymotic[infectious] diseases.” Beyond the health effects, coal smoke also had a myriad of othervisible consequences. White cloths became stained and went out of style. Visibility wasoften so reduced that it caused traffic accidents. There is even evidence that pollutionhad evolutionary effects. Kettlewell (1955) describes how the Lepidoptera moths, originallywhite, evolved to take on a dark gray color in order to blend into the polluted forests nearthe northern industrial cities.12See Rückerl et al. (2011), Currie (2013) and Graff Zivin & Neidell (2013) for reviews ofliterature on this topic.9
formation ((Ebenstein et al., 2016; Bharadwaj et al., Forthcoming)) and adultearnings (Isen et al. (Forthcoming)).An important feature of this empirical setting is that Britain was a “highlymobile” (Long & Ferrie (2003)) society during this period, with large flowsof population from rural areas as well as Ireland and Scotland into Englishcities.13 This means that, when considering factors that influence city employment or population growth, the marginal mover that we should have inmind was someone outside of the cities who was faced with a decision aboutwhere to migrate. The search for work was the primary driver of these migration flows, though there is also some evidence that pollution levels affectedlocation decisions, both within and across cities.14Another important feature of this setting was the limited level of government regulation, including both pollution regulation and other regulationsthat would have affected city growth. While some steps were taken to regulateindustrial pollution, these efforts often ran up against the laissez faire ideologythat dominated British policy during this period as well as the political powerof mill owners. New pollution regulations were passed, including The SanitaryAct of 1866, The Public Health Act of 1875 , and The Public Health (London) Act of 1891. However, these acts allowed for substantial interpretation,contained important loopholes, and imposed relatively small fines.15 As a re13Baines (1985) suggests that internal migration accounted for roughly 40% of the population growth of British cities during this period. Only one city in the analysis database,Bath, did not experience substantial growth during the study period. Britain already hada well-developed transportation network by 1851 the beginning of the period studied here,including railroad connections to all of the analysis cities, as well as numerous canals andturnpikes.14For example, in the 1880s Robert Holland wrote that, “[t]he rich can leave the sordidcity and make their homes in the beautiful country.the poor cannot do so. They mustbreath the stifling, smoky atmosphere.” Quoted from Thorsheim (2006), p. 44.15One example provided by Thorsheim (2006) is that the acts regulated only “blacksmoke.” Defendants were able to avoid fines by claiming that their smoke was merely “dark10
sult, historical evidence suggests that their effectiveness was limited, thoughthey may have had more impact toward the end of the nineteenth century.16Other regulations affecting city growth, such as zoning laws, were also largelyabsent from this setting, which provides a particular clean opportunity forinvestigating the impact of pollution on city growth.173Data and measurementThe first key piece of data for this study is a measure of local industrial composition. These data come from the Census of Population, which reports theoccupation of each person at each ten-year census interval from 1851-1911 for31 of the largest cities in England.18 The occupational categories reported inthese data generally closely correspond to industries, such as cotton spinneror steel manufacturer.19 To construct consistent series for 1851-1911, I combine the many occupational categories available in each census into a set of 26broad industries, spanning nearly the entire private-sector economy.20Because I am working with fairly aggregated industry categories, almost allbrown.”16See, e.g., Thorsheim (2006) and Fouquet (2012).17For example, no national zoning law existed in England until 1909. There were alsovery few place-based policies of the kind found in many modern economies, and little spatialredistribution of wealth through national taxes.18The set of cities in the database includes all of the English cities for which city-leveloccupation data were reported by the Census for each decade from 1851-1911. These werethe largest cities in England in 1851 with the exception of Plymouth, which is excludedbecause changes to the city border make it impossible to construct a consistent series forthat city. Figure 3 in the Appendix includes a map of these cities. This study uses themost recent version of the database (v2.0) which was updated in March, 2016. The data,additional documentation, and descriptive statistics can be found at http://www.econ.ucla.edu/whanlon under Data Resources.19One unique feature of this data source is that it comes from a full census rather than asample. This is helpful in reducing the influence of sampling and measurement error.20A list of the industries included in the database is available in Appendix A.2.5.11
industries are present in all cities.21 However, the spread of industries acrosscities was far from even. For example, textile producers agglomerated in citiesin Lancashire and Yorkshire, where they could account for as much as halfof all private-sector employment. Cities such as Sheffield, Birmingham andWolverhampton had a disproportionate share of metals industries, while portssuch as Bristol and Liverpool had high shares of transportation and services.The second necessary piece of information for this study is a measure of thecoal intensity of each industry. This information is drawn from the first Censusof Production, which was completed in 1907.22 This Census collected detailedinformation on the amount of coal used in each industry, as well as industryemployment, allowing me to construct a measure of coal use per worker ineach industry.23These data show that coal use intensity varied enormously across industries, a feature that plays a key role in this study. A table describing coal useintensity by industry is available in Appendix A.2.5. The most intensive industrial coal users, such as metal & machinery or earthenware & bricks, used coalto heat material up to high temperatures. These industries used more thanforty tons per worker per year. Textiles, a moderate coal-using industry whichconsumed around ten tons per worker per year, generally used coal to powersteam engines. Other industries, such as apparel or tobacco products, usedvery little coal, less than two tons per worker per year. This large variation incoal use intensity at the industry level, together with the tendency of indus-21The exceptions are a few cities which have no employment in shipbuilding or mining.Observations with no city-industry employment are dropped from the analysis, leaving mewith a slightly unbalanced panel.22While these data come from near the end of the study period, this is the earliest availableconsistent source for this information.23Coal and coke are combined in this study. Coke consumption was small relative to coal.12
tries to agglomerate in particular locations, resulted in substantial variationin the amount of industrial coal use at the city level.I model industrial coal use in cities as determined by city-industry employment (Lict ), the coal use intensity of each industry (θi ), and the nationalefficiency of coal use per worker, ρt :COALct ρtX(Lict θi ) .(1)iEstimates of θi for manufacturing industries are provided by the 1907 Censusof Production, while Census of Population data provide city-industry employment. The ρt term can be calculated by comparing data on industrial coaluse at the national level to the values obtained using data on θi and Lit .24In general, other industries, such as services, were not likely to be major coalusers, so this measure should capture most industrial coal use.25One assumption implicit in this approach is that relative coal use per workeracross industries did not vary too much over time. Another important assumption is that industry coal use does not vary too much across locationsin response to variation in the relative level of wages or coal prices. Put another way, it is important that variation in city coal use due to local industry24P PSpecifically,P P I use the fact that ln(ρt ) ln(COALt ) ln ( c i Lict θi ) . In this equation, the c i Lict θi term can be calculated from the data, while national coal use inindustry is available from Mitchell (1988).25An exception is local utilities, particularly gas, which was a major user of coal. Coalwas used to make gas, which was then pumped to users in the city, where it was burnedfor light or heat. Despite the fact that local utilities used coal, I exclude local utility coaluse from the pollution measure because gas providers may have reduced the amount ofcoal smoke residents were exposed to if the gas replaced more polluting forms of energyuse in homes and offices. Another potential exception is transportation, particularly railtransportation, which used a substantial amount of coal. However, most of this coal wouldhave been burned outside of stations, spreading it though the countryside. This makes itvery difficult to determine the location of pollution related to coal use in the transportationsector. Thus, I also exclude transportation from the local coal use measure.13
composition and differences in industry coal use intensity resulting from technological factors is substantially more important than the variation due todifferences in the local prices of coal or other inputs. The enormous variationin coal use intensity across industries is important for making this a reasonableassumption.One way to check both of these assumptions is to compare estimated levelsof coal use calculated using the method described here to data on local coaluse levels. While such data are generally unavailable, there is information oncounty-level coal use in the 1871 Coal Commission report. Comparing estimates of industrial coal use a
The Industrial Revolution represented a watershed in economic growth, yet there is a long-running debate over the costs that industrialization imposed on the generations that lived through these events. In the early stages of the Industrial Revo