Transcription
Copyright 2008 Stephen Few, Perceptual EdgePage of 11
Dashboards can keep people well informed of what’s going on, but most barely scratch the surface of theirpotential. Most dashboards communicate too little, and what they display, they display poorly. This is primarilya failure of design. To present information in a way that people can rapidly monitor, fully understand, andeffectively respond to, we cannot format the appearance of information nor lay it out on the screen in just “anyol’ way.” Dashboards are usually required to display a great deal of somewhat disparate information in a limitedamount of space (a single screen). It is challenging to squeeze all this information onto the screen withoutending up with a cluttered mess. To avoid this unfortunate outcome, we must follow visual design principlesfor formatting and arranging information on the screen. We must organize information into meaningful groupsand do so in a way that features what’s most important. Even aspects of design that you might assumeare unimportant, such as the positioning and sizing of items on the screen, can dramatically undermine theeffectiveness of a dashboard when visual design principles are ignored.Fortunately, the best practices for dashboard formatting and layout are easy to learn. They are also easyto implement—if you happen to use software that supports the necessary level of formatting and layoutfunctionality and flexibility. It is a sad fact that most dashboard products do not. CenterView from CordaTechnologies, however, is a pleasing exception.To present information in a way that people can rapidly monitor, fully understand, andeffectively respond to, we cannot format the appearance of information nor lay it out on thescreen in just “any ol’ way.”Common Failures in Dashboard Formatting and LayoutI’ll begin by clarifying my use of the terms formatting and layout. Formatting involves anything we do thataffects the visual appearance of a dashboard’s content. Formatting can be applied to a section of text, a tableof data, a graph, an icon, or anything else that appears on the dashboard. Formatting manipulates visualattributes of the things on display, such as their color, size, and thickness, as well as the presence or absenceof components that may or may not be needed, such as gridlines on a graph. For instance, we might want toassign a distinct color to an alert icon and make it bright so it can be used to draw attention to particular itemson a dashboard. Layout includes everything we do to position, group, or in some manner order units of contenton the screen. For example, we might want to place a particular graph in a prominent location to make it standout as important or be the first thing that people notice.When I review the effectiveness of dashboards, which I do quite often—both those that were created bysoftware vendors to promote their products and those created by organizations to do real work—I encountermany of the same formatting and layout problems again and again. Here’s a list of nine of the most commonproblems I come across, which you would do well to avoid: . Positioning content in places that don’t fit its importance2. Positioning content in places that fail to support its use . Including items that serve no useful purpose . Sizing content larger than it deserves . Separating content excessively6. Visually featuring content and other items more than they deserve . Failing to visually link contents and other items that are related8. Visually suggesting links between contents that are not related . Enforcing a rigid symmetrical gridCopyright 2008 Stephen Few, Perceptual EdgePage of 11
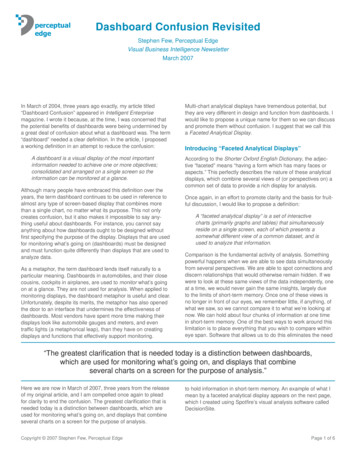
In 2006, I judged a data visualization competition for DM Review magazine. Contestants were asked to createseparate graphical solutions to five business scenarios, one of which involved creating a sales dashboard.I provided the data and left contestants to their own devices to create solutions, letting them know that Iwould evaluate them solely on their ability to communicate the information accurately, clearly, and rapidly.It was interesting to see how differently the contestants envisioned the dashboard solution. For most of thenine dashboard design problems that I’ll cover in this paper, I’ll use dashboard solutions submitted to thiscompetition to illustrate what we ought to avoid.1. Positioning Content in Places that Don’t Fit Its ImportanceWe look at some regions of a computer screen more than others. Prominent screen real estate can be used tofeature important content. This opportunity is wasted when we place is less important content in these valuableregions. The importance of each piece of information that will appear on a dashboard should be weighedrelative to all others and this hierarchy of importance ought to be considered when deciding what goes where.In the following example, this was not done.Placing a legend in the upper left corner of the dashboard—the most expensive real estate available—toexplain what the colors green, orange, and red mean, gives this information prominence it doesn’t deserve.Few people would need to read this legend more than once. Assuming that it must take up permanentresidence on the dashboard, it would be better placed in less prominent location.Copyright 2008 Stephen Few, Perceptual EdgePage of 11
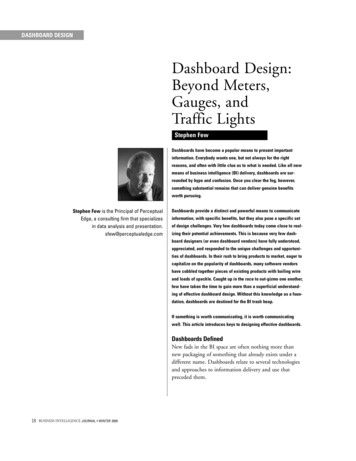
The relative prominence of screen space on a dashboard can be divided into quadrants, as shown in thefollowing illustration. Whenever possible, place information that is considered most important in the upper lefthand region and that which is least important in the lower right hand corner.EmphasizedNeither emphasizednor de-emphasizedNeither emphasizednor de-emphasizedDe-emphasized2. Positioning Content in Places that Fail to Support Its UseSome pieces of information on a dashboard belong together because they are closely related in the minds ofthose who view them. Positioning these pieces of information apart from one another can cause confusion andmake it hard to see related facts holistically. Others pieces of information belong close to one another becausethey need to be compared. Positioning them apart from one another complicates this process. The followingexample illustrates a simple, surprisingly common, but easily avoided example of this problem. Look at the twobar graphs on the right. Now look for their titles. They are located just to the right of the bar graph on the left,much closer to it than to the graphs that they describe. Don’t force people to work this hard to associate itemsthat belong together.Copyright 2008 Stephen Few, Perceptual EdgePage of 11
Sometimes the information on a dashboard is most useful when it is viewed in a particular sequence. Forinstance, a dashboard that is used to monitor processes that consist of sequential steps, usually presentswhat’s going on most effectively when it is arranged in a way that encourages people to view information inthat sequence. Even when the information does not correspond to a sequential process, some facts only makesense when others are known, so they should be arranged to support the construction of understanding, onebuilding upon the other, in this sequence.3. Including Items that Serve No Useful PurposeDashboards are supposed to keep people informed about what’s going on. Their purpose is not to entertain orto provide dashboard developers an opportunity to impress people with their wizardry or artistic talents. Thereis certainly nothing wrong in and of itself with a dashboard being enjoyable to use or beautiful to look at, butthis goal should never override its ability to serve as an effective medium of communication. If the informationdisplayed on a dashboard is important to the people who use it, more than anything else they want to acquirethat information as quickly, clearly, and accurately as possible. Anything we include on a dashboard thatdoesn’t serve this objective undermines it by wasting useful screen space and distracting from the informationpeople rely on to do their jobs.Take a look once again at the dashboard in the section above and notice how little actual information it containscompared to the available space, much of which was given to photos of strangers, the dashboard’s title, andthe cute phrase “everybody on the same page,” which only a member of the marketing department could love.Some of the frequent space wasters and eye distractors that I find on dashboards include:The organization’s logo, splashed boldly acrossthe most prominent real estate on the screenAssuming that the dashboard is used within anorganization, do the people who use it need to bereminded that they work for Company X? Whenyou run an internal meeting, do you spend thefirst few minutes telling people the name of thecompany for which they work? Not likely.Decoration in the form of photographs, abstractart, background images, and so onArt has its place, but not on a dashboard.Decoration that looks cute on day 1 becomesannoying by day 2, because it robs space fromuseful information.Instructions or descriptions displayed as text,which are needed only the first time someoneuses the dashboard and never againMost dashboards are used by the same people dayin and day out. If the dashboard is well designed,minimal instructions are needed on the first day toexplain how to use it. Don’t clutter the dashboardwith text that explains something that must only beexplained once and never again. Place instructionsof this type in a Help document that can be easilyaccessed when it’s needed, perhaps through asmall help button located in some obscure cornerof the dashboard.Copyright 2008 Stephen Few, Perceptual EdgePage of 11
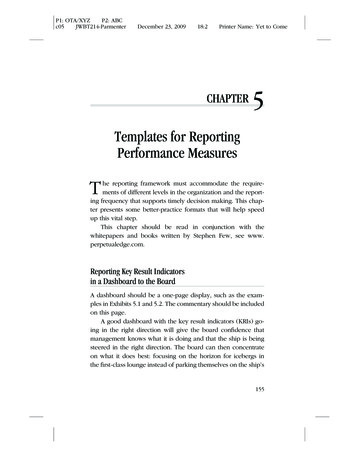
The dashboard below illustrates the last of the three types of unnecessary content mentioned above:instructions that are seldom needed.As with all forms of communication, when people need information, it works best to tell them what theyneed—no more and no less.4. Sizing Content Larger than It DeservesThe size of something on a dashboard serves as a strong visual cue to its importance. If a particular section ofinformation is relatively less important than others, try to give it less space. In the following example, the salesorganization’s seven key metrics occupy the upper left quadrant of the dashboard, which they rightly deserve,but the bar graph of the top customers, which is much less important, has been given the same amount ofspace.Begin by sizing each section of content as needed to be easily seen. Then, when everything has been laid outon the dashboard, adjust the sizes of various sections to visually reinforce their relative importance.Copyright 2008 Stephen Few, Perceptual EdgePage of 11
5. Separating Content ExcessivelyDashboards should be seen more as a whole than a collection of individual parts. People use dashboards toconstruct an overview in their heads—the big picture of what’s going on. We shouldn’t make this difficult byfragmenting the information into little independent pieces. Many dashboards fragment onto separate screenswhat ought to be shown together. Even information that all appears on a single screen is often visuallysegregated unnecessarily. The is commonly done using borders—often quite dark and heavy—drawn aroundeach graph, each cell of a table, and so on. Notice the heavy-handed way the following dashboard has beenseparated into little groups.Besides borders, another way that content is sometimes divided is by using different fill colors in thebackgrounds of various sections. The following example illustrates this practice, which in this case is done togreat and unpleasant visual excess.Copyright 2008 Stephen Few, Perceptual EdgePage of 11
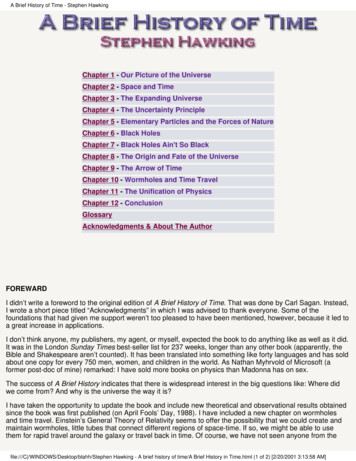
We should only separate sections of content into groups when doing so enforces a meaningful relationshipthat assists people’s understanding, visually joining information that makes most sense when viewed together.When they’re needed, apply visual separators such as borders or fill colors with a gentle hand, making themjust visible enough to do the job and no more.6. Visually Featuring Content and Other Items More than They DeserveI previously mentioned how we should regulate the size of sections of information to suggest their relativeimportance, but visual attributes besides size can be also be used to achieve this effect. For instance, if wepresent most information using relatively soft and neutral colors, we could make particular sections stand outby using bright colors. We could also put a border around a particular section, because all forms of visualenclosure, borders especially, cause content to pop out, when used sparingly.What I’m trying to say is that differences in the visual salience of items on a dashboard—anything visual thatmakes something stand out—should never be arbitrary. Don’t highlight something that doesn’t deserve a highlevel of attention. Notice, when looking at the following example, where your eyes are drawn.No care was taken to balance the salience of items on the dashboard such that what’s most important standsout above the rest. Perhaps your eyes were drawn to the pie charts because they’re so colorful. If so, that’sunfortunate, because other information is more important. If you’re like me, your eyes were powerfully drawnto the red X’s in the three line graphs. The purpose of the X’s is to mark the location of each value alongthe line—something that isn’t even necessary to see the patterns of change through time, and definitely notsomething that deserves to be highlighted.Copyright 2008 Stephen Few, Perceptual EdgePage of 11
I frequently come across dashboards that display nearly everything in a visually salient manner. Bright colors,3-D effects, dark borders, and other visual attributes are turned up to such a high level that my eyes can’tdecide where to look because everything competes for my attention. When everything is yelling, no voicesstand out, and the result is noise that no one wants to hear.When everything is yelling, no voices stand out, and the result is noise that noone wants to hear.7. Failing to Link Content and Other Items that Are RelatedWe can’t always place items next to one another that are related or ought to be compared. In such situations,however, we can make it easy for people to see these connections by visually linking the items, such as byusing common colors or subtle borders. Despite the fact that much is done right in the following dashboard,most everything looks so much the same that items that ought to be grouped together are not linked in anobvious way.The top two rows of bar graphs display the key sales metrics, the third row the products, and the fourth row theregions. Especially because all of these bar graphs look so much alike, something is needed to delineate thesethree groups of objects. Something as simple as gray horizontal lines could have been use to make thesegroups clearly visible and enforce the connections between related items that help people isolate what they’reexamining from the rest when they wish.As much as possible, whenever things share the same meaning or belong together in some way, make therelationship obvious by placing them together, enclosing them together, or giving them a similar appearancethat is unique.Copyright 2008 Stephen Few, Perceptual EdgePage of 11
8. Suggesting Links between Content that Is Not RelatedThis problem is the flipside of the one above. When different items on a dashboard look alike in some way,people tend to see them as related. We should be careful not to suggest relationships that don’t actually existin the data. In the following example, notice the orange and blue colors that appear in all four graphs:(Note: This is the one dashboard example, which I’m using to illustrate poor design practices,that was not submitted as part of the DM Review 2006 Data Visualization Competition. It wasprovided by Corda.)The sameness of these colors suggests shared meaning. These two colors do in fact share the same meaningin three of the graphs—orange represents the Americas and blue represents Europe—but not in lowerright-hand graph, where orange represents “QTD Q/Q Growth” and blue represents “QTD Y/Y Growth.” Thisproblem could have been easily avoided by using different colors in the “Worldwide Units QTD Growth graph.”We can’t always assign a different color to everything on a dashboard that means something different, becausedoing so would often cause the dashboard to become colorful to a visually overwhelming degree. We can workaround this problem, however, by using neutral colors, such as black and various shades of gray, when wedon’t want people to associate the same meanings with every instance of those colors. People tend to assigncommon meanings primarily to colors that stand out as distinct, which would not be the case with black andgrays if they appear frequently throughout a dashboard.9. Enforcing a Rigid Symmetrical GridIn the context of layout, grids are often used to divide a page or screen into specific rectangular regions forspecific purposes. Grids can be quite useful for creating consistency from page to page in a book or screento screen in a computer application or website. While it is useful for most dashboards in an organization tobe consistent in many aspects of their appearance (fonts, colors, the location of the Help button, the actionCopyright 2008 Stephen Few, Perceptual EdgePage 10 of 11
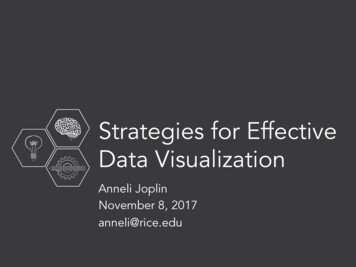
required to access details related to the high-level information that is on display, and so on), a dashboard’slayout ought to be determined by the arrangement and sizing of objects that communicates the informationbest.The dashboard in the section above exhibits the kind of rigid layout that is rarely useful. Everything is forcedinto quadrants of equal size. Many dashboard products force us to divide the screen into columns and rowsof particular sizes, which cannot be altered. The result is a rigid grid into which every item must be placed, theboundaries of which they are never allowed to venture beyond. This doesn’t allow the level of flexibility that isalmost always required to ideally arrange the data. To design dashboards most effectively, we must be able toplace and size items wherever and however needed for people to monitor it rapidly and meaningfully. RalphWaldo Emerson wrote: “A foolish consistency is the hobgoblin of little minds.” When designing dashboards,being forced into a rigid layout is a fine example of a consistency that is indeed foolish.Alignment of items on a dashboard can be used to associate things with one another. Alignment andsymmetry are pleasing to the eye. We find it annoying when things are positioned slightly out of alignmentwith one another when there is no reason that a nice clean line could not have been followed. Misalignmentand asymmetry, on the other hand, can be intentionally used to discourage people from seeing things asconnected, similar, or equal, when they in fact are not. The point is that positioning and sizing items on adashboard should not be arbitrarily forced to conform to rigid standards nor should constancy, alignment, andsymmetry be capriciously ignored. These layout and formatting choices should be intentional and meaningful.The ResultsIf you avoid the dashboard formatting and layout problems that I’ve described and follow the steps that I’vesuggested to correct them, dashboards can tell their stories much more clearly, rapidly, and without distraction.This final sales dashboard example shows the same information that we’ve seen in several of the examplesabove, but in this case, formatting and layout were based on conscious choices to follow best practices ofvisual design.Copyright 2008 Stephen Few, Perceptual EdgePage 11 of 11
Some of the graphical objects in this dashboard might not be familiar to you, but don’t let this distract you fromappreciating the quality of communication that has been achieved through thoughtful formatting and layout.Take the time to review the problems above that I’ve warned you to avoid and notice how big a difference it canmake when you take my warning to heart.By the way, the sales dashboard above appears in my book Information Dashboard Design, but the versionshown here was not created by me. It was developed by the folks at Corda as a reproduction of my design todemonstrate that CenterView is capable of building well-designed dashboards that follow the principles that Iteach.About the AuthorStephen Few has worked for 25 years as an IT innovator, consultant, and teacher. Today, as Principal of theconsultancy Perceptual Edge, Few focuses on data visualization for analyzing and communicating quantitativebusiness information. He provides consulting and training services, writes the monthly Visual BusinessIntelligence Newsletter, speaks frequently at conferences, and teaches in the MBA program at the Universityof California, Berkeley. He is the author of two books: Show Me the Numbers: Designing Tables and Graphs toEnlighten and Information Dashboard Design: The Effective Visual Communication of Data.Copyright 2008 Stephen Few, Perceptual EdgePage 12 of 11
Even aspects of design that you might assume are unimportant, such as the positioning and sizing of items on the screen, can dramatically undermine the effectiveness of a dashboard when visual design principles are ignored. Fortunately, the best practices for dashboard formatting and layout are easy to learn. They are also easy