Transcription
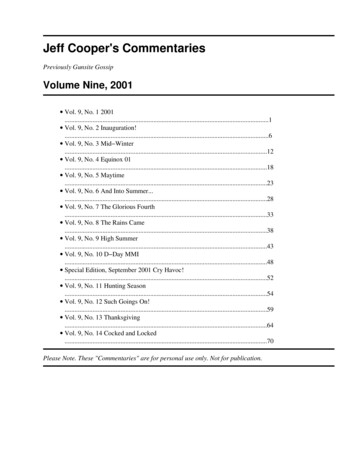
White PaperDate: January 2014By: Jeff ShusterAddressing Glare in Solid‐State LightingAbstract: Glare is a phenomenon caused by a bright light source that inhibits theability to view a task or scene, due to an uncomfortable or even blinding effect on theviewer. Although many metrics have been developed attempting to quantify glare,each has limitations and most are difficult to measure in the field. This paper brieflyexamines several of these methods, provides general recommendations to reduceglare, and assesses an installation of Ephesus Arena lights.IntroductionGlare can be divided into two categories: disability glare and discomfort glare. Disabilityglare is a reduction in visibility due to scattered light in the eye, and is commonly used in thecontext of automotive head lamps. It is not necessarily associated with physical discomfort,only reduced visibility. Figure 1 below shows an illustration of how disability glare impactsthe eye by scattering light and reducing contrast in an image. Tests for disability glaremeasure the ability of a subject to detect an object in the presence of a glare source.Figure 1: Mechanism of Disability Glare 2By contrast, discomfort glare is defined as an annoying or painful sensation when exposedto a bright light in the field of view, without necessarily impairing vision. Discussions of glarein sports lighting generally refer to the discomfort type of glare. Unlike disability glare,discomfort glare is subjective and hasn’t been directly linked to a physiological cause. Thereare a number of different models and variables that are used in quantifying discomfort glare.Measurements of glare are based on measurements of light, so it’s important to understand
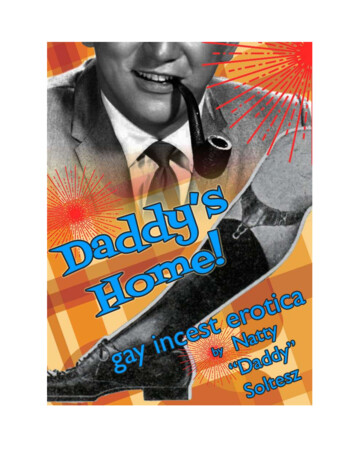
some basics of how light is measured before discussing glare further. The strength of a lightor light source is quantified in terms of both illuminance and luminance. Illuminance is howmuch light (luminous flux) is incident to a surface or area, basically how much light is goinginto an area. It is measured in lux (which is a lumen/m2) or foot-candles by a hand-heldilluminance meter. These meters are relatively inexpensive ( 100) and commonly used toasses lighting levels. In terms of glare, the illuminance is most often measured incident tothe eye.Where illuminance quantifies the light incident upon an area, luminance by contrastquantifies the light emitted from an area. Luminance is a measure of how powerful the lightis (luminous intensity) emitted from a particular area within a solid angle. It is measured inunits of candela per square meter and typically measured using a hand-held luminancemeter, which is more expensive ( 3000) and therefore less common than the illuminancecounterpart. It is also limited by the need to have the source subtend the entire field of viewof the meter for accurate readings, which means at a certain distance away themeasurement is no longer accurate. To bypass this limitation, a digital camera can also beused to measure luminance with the proper settings and calibration1. For a Canon G15digital camera, the field of view of a pixel is 0.017 degrees in the wide angle lens positionand 0.0034 degrees in the telephoto position. This is a much finer resolution that thestandard 1 degree view of a luminance meter making it a much more versatile for fieldmeasurements. In terms of glare, luminance is most often measured directly toward a lightsource from a given viewing location.Methods of Quantifying GlareThe following list provides a brief overview of several methods to quantify disability glare. Asa subjective property with no widely accepted measurement standard, there are additionalmethods not described here, but the methods described below are most readily used toclassify a given lighting situation. The methods of UGR and GR are most useful inconjunction with lighting software, and the GR and luminance measures are more practicalfor measurement in a field application. CIE, Unified Glare Rating (UGR) – this model was developed by the internationalcommission on illumination, CIE, for applications of interior lighting [CIE 117-1995 Discomfort Glare in Interior Lighting]. UGR is based on a measurement of theluminance of a fixture for a specified direction of line of sight.2
Figure 2: Unified Glare Rating3The formula includes terms for background luminance (LB), luminaire luminance (L)summed for all luminaires, the solid angle of the source from the viewer’s position insteradians (ω), and the Guth position index (р). The Guth position index is based ontwo angles: α angle from vertical of the plane containing the source and the line ofsight in degrees and β angle between the line of sight and the line from theobserver to the source. The Guth position index is expressed as9:exp 35.20.31889211.220.26667100.002966310Based on these terms, the formula for UGR is given as:UGR8log. 25LLωpThis produces values that range from 5 to 40, where anything at 10 or below isnegligible and anything above 30 is unacceptably glaring, see table 1. UGR isgenerally known to only be accurate for small source sizes. It is limited to sourcesizes between 0.0003 steradians and 0.1 steradians. This correspondsapproximately to minimum of a 2-inch source (like a standard incandescent bulb)from about 32 feet away up to maximum fixture 3-feet wide from 10 feet away. Thiscalculation is integrated into many photometric software packages, such as AGI32,based on a specified direction. For this reason, it is a good indicator for glare in anindoor planning situation. Due to the complex interaction of angles and the need tomeasure each fixture individually, it is difficult to measure in the field.3
Table 1: UGR Criteria 3UGR Hopkinson’s Criterion10Imperceptible13Just perceptible16Perceptible19Just acceptable22Unacceptable25Just uncomfortable28Uncomfortable CIE, Glare Rating (GR) – this model was developed by the international commissionon illumination, CIE, for applications in outdoor lighting [CIE document 112-1994].Glare rating is calculated based on illuminance on the eye when observing eachpoint in an array of points from a single observer position as shown in Figure 2below.Figure 3: Glare Rating 4The calculation of Glare Rating includes terms for veiling luminance on the eye (LVL)and veiling luminance by the environment (LVE). The use of the term luminance hereis somewhat misleading because it’s calculation relies only on an illuminancemeasurement. Veiling luminance on the eye is a summation across all luminaires ofthe illuminance perpendicular to the line of sight (EEYEi) and divided by a factor of theangle between the viewer’s line of sight and the direction of the light (qi). Veilingluminance by the environment includes the average horizontal illuminance (EHOR,AV),the reflectance (ρ) and the unity solid angle in steradians (Ω). Glare rating is givenas:4
2427 log.10,0.035 ΩThis results in values ranging from 10 to 90, where 10 and below is unnoticeable and90 is considered unbearable, see table 2 below4. For outdoor sports competition, it’srecommended the GR remain below 50. Similar to UGR, this calculation is integratedinto photometric software packages, so is useful to apply in a planning situation foran outdoor field. It should also be noted that the calculation of this value is done froma single observer’s point within the area being lit, so it’s largely dependent on whatpoints are chosen. Due to the difficulty of separately measuring each luminaire,particularly in outdoor sporting venues which have hundreds of lights, this quantity isalso very difficult to capture in the field.Table 2: Glare Rating CriteriaGR102030405060708090 4ClassificationUnnoticeableNoticeableJust AdmissibleDisturbingUnbearableLRC, Discomfort Glare (DG) – The Lighting Research Center (LRC) of RensselaerPolytechnic Institute, has developed their own empirical model to quantify discomfortglare. Through series of studies in both indoor and outdoor scenarios, they hadsubjects rate the level of discomfort glare on the DeBoer scale (see table 3) andstatistically analyzed the results. It’s worth noting that the DeBoer scale works in theopposite direction of the previously mentioned ratings, so the higher the number theless glare is present.5
Table 3: DeBoer ScaleDB987654321ClassificationJust NoticeableSatisfactoryJust PermissibleDisturbingUnbearableIn contrast to the CIE UGR model, the LRC found ratings of discomfort glare weremuch more strongly correlated to the illuminance, rather than the luminance of thesource5. However, this effect is limited to a certain source size – when the sourcewas larger within the field of view, subtending more than 0.3 degrees, they foundluminance carried a greater influence. Their model for discomfort glare uses fourterms: illuminance from the source (EL), luminance of the source (LL), illuminancefrom the area surrounding the source (ES) and ambient illuminance (EA) if the glaresource and the light system it were part of were not installed. Discomfort glare is thengiven as5:log0.5log0.6 logNote the value for surround illuminance, ES, must be non-zero for this expression towork. In correspondence with the LRC, they listed the surround and ambientilluminance in a black room as 0.01 lux. Additionally, they reported about 0.02 lux foroutdoor rural areas, 0.2 lux for suburban areas and 2 lux in urban areas. This valuefor DG is then converted into a rating on the DeBoer scale using the formula:6.66.4 log1.4 log50,000The final term of this equation, containing luminance of the source (LL) is onlyincluded if the source size subtends more than 0.3 degrees in the field of view. At 20feet away, a source of about 1.25 inches or larger would meet this criteria. At 50 feetaway, a source of about 3 inches or larger would meet this criteria. This iscomparatively a more simple calculation to the CIE methods, because it measuresglare from a single source, rather than requiring summing all sources. For fieldmeasurement of an isolated single source, this is a valuable method. However, incertain types of lighting systems where there is a bank or cluster of lights it may beimpractical to turn a single light on or off to take these measurements independent ofthe other lights.6
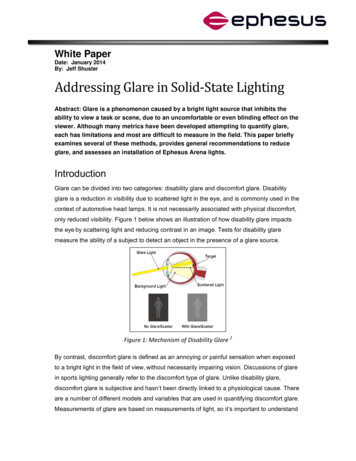
Luminance Criteria – Although the aforementioned methods provide a repeatable,independent measurement of glare, they leave something to be desired when asimple comparative measurement is all that’s required. In some cases of LEDinstallations, it’s enough to know if glare will be better or worse than the currentlighting. To this end, there are a number of criteria that use luminancemeasurements as an indication of glare. Some take a ratio approach, measuringluminance between the task being viewed and the glare source. These haveproposed various ranges of acceptable luminance ratios from 100:1 down to 10:1,but found limited degrees of applicability based on individual perception6.Another study of office environments suggested any luminance above 1500 cd/m2was likely to be a source of glare7. It’s important to acknowledge the lightingrequirements in sporting venues are often up to eight times higher than those of astandard office environment, so this luminance threshold may be overly conservativewhen applied to a sporting venue due to the high surround illuminance. Luminancemeasurements taken from an off-angle, outside the target area of the source, canprovide an indication of the level of light spillage. Research is ongoing to determinean appropriate comparison threshold for sporting venues and similar lightingsystems. Some combination of source luminance and illuminance at the eye may bethe most appropriate for a comparative field measurement. At any rate, thesemeasurements provide a more straightforward way to quickly assess glare in a fieldapplication.Considerations to Reduce GlareReducing the effects of glare involves two primary considerations: light spillage and fixtureposition. Light spillage is a property of the luminaire design and is related to how well theluminaire limits projected light to the intended area. Figure 4 below shows animplementation of four different designs as the manufacturer worked to improve the fixturedesign 8. Often shades, reflectors or special lensing can be incorporated into a design toreduce light projection in an unintended direction, thereby reducing glare. Spillage istypically most concerning when lights aimed vertically emit unintended light in the horizontalplane, causing a bright source in a viewer’s eyes.7
Figure 4: Light Spillage as a result of Luminaire DesignThe other property which influences the amount of glare is the fixture position. In generalfixtures positioned higher from the target area and more directly overhead result in lessdiscomfort glare than fixtures that are lower and further off-center from the targeted area.Figure 5 illustrates this effect for a sports field installation shown with a 50 foot mountingheight and a 90 foot mounting height8. The higher pole shown in the bottom half of the figureallows for better cutoff of light and eliminates spillage into the sky. If the mounting position ofthe luminaire cannot be changed, aiming the center point of the luminaire closer to themounting location can also help to reduce glare. In many cases, this is a competingrequirement with supplying adequate light levels to the target area, so requirements must beprioritized.Figure 5: The Importance of Light Position to Reduce Glare8
Assessment of Glare in an Ephesus InstallationThis section applies the UGR and luminance criteria methods for quantifying glarediscussed earlier to an installation of Ephesus Arena LED luminaires at Ricoh Coliseum inToronto, Canada. As shown in Figure 6, this installation includes a mixture of overheadlights pointed directly downward and a row of side lights angled in toward the ice.Figure 6: Ephesus Arena Lighting in Ricoh Coliseum, TorontoIt’s expected that the lights angled in from the side will contribute most significantly as aglare source, since they are lower and more likely to cross a viewer’s line of sight. The firstevaluation uses a 3D model of the Ricoh Coliseum and calculates the UGR along a 10 x 10horizontal grid, 4 feet above the surface of the ice. AGI32 software was used to perform thisanalysis. Calculation of UGR is based on a specified direction for line of sight, so evaluationwas performed looking both from the left to the right along the length of the ice and from thebottom to the top across the width of the ice. Figure 7 below shows the UGR looking downthe length of the ice. The maximum values are around 20 which is within the acceptablerange listed in Table 1. This viewing angle allows glare to be assessed with minimalcontributions from the side lights. This acceptable result indicates no unintended spillagefrom the overhead lights is causing glare.9
Figure 7: Evaluation of UGR at Ricoh, Left to RightFigure 8 shows the UGR with the line of sight rotated 90 degrees, looking across the widthof the ice. Now the contribution of the angled side lights is worst case and a number ofpoints across the snapshot are in the uncomfortable range (28 or higher). Although resultingin some glare, these sidelights provide several important functions by eliminating shadowsalong the inside edges of the boards and greatly increasing the vertical illuminance. Verticalilluminance is essential for quality television broadcasting. Additionally, the high overalllighting levels of the arena help to minimize the potentially uncomfortable effect, becausethe lights aren’t in stark contrast to a dark surrounding.Figure 8: Evaluation of UGR at Ricoh, Bottom to Top10
A third party evaluation of the Ricoh Coliseum based on luminance criteria was performedby Peter Hiscocks, of Syscomp Electronic Design Limited. Based on the glare criteria of1500 cd/m2 mentioned previously, he assessed luminance from ten positions in the RicohCenter, both from the ice and in the viewing stands. Using a calibrated digital camera withappropriate filters, he was able to capture multiple fixtures in each frame and reportluminance values from each light fixture. A few sample figures from the analysis are copiedin Figure 9 below.Figure 9: Ricoh Luminance AssessmentIt was found the fixtures that were aimed vertically had well controlled spillage and were nota source of glare, like the fixtures in the far left of (a) in Figure 9. The fixtures aimed in atsides of the rink produced luminance readings an order of magnitude higher than thethreshold of 1500 cd/m2, such as those in the center of (b) and (c) in Figure 9. This agreeswith the results from the UGR analysis that these side lights are the most likely culprits forglare in this installation. As viewed down the length of the ice, from behind the goal,luminance values were all below the glare threshold, shown in (d) of Figure 9. Keeping inmind this threshold was suggested primarily for office environments, where typicalhorizontal illuminance values are 30-40 foot-candles versus 150 foot-candles at the RicohCenter, this is a remarkable result.11
ConclusionThere are many approaches to quantifying discomfort glare, but with any approach itremains a subjective measurement. CIE methods of Unified Glare Rating (UGR) and GlareRating (GR) are helpful in planning situations, where software can complete the complexcalculations. The LRC’s method of Discomfort Glare (DG) provides a robust empiricalmodel, but requires measurements of a single light at a time, which may be impractical forfield measurements in a large installation like a sporting venue. Lastly, the luminance criteriamethod provides a practical field measurement, but lacks the inclusion of other potentialcontributing factors, most noticeably illuminance at the eye.Glare results from a combination of both luminaire design, and position. Even the bestdesigns can produce glare if positioned a certain way. Measuring the Ephesus Arenainstallation with both the analytical method of UGR and the more simplistic luminancecriteria indicates the general spillage control of the fixture is very good. This means theelement of glare associated with fixture design is adequate. The greatest likelihood of glarewith an Ephesus fixture is related simply to its aiming position.12
References1)Hiscocks, Peter. Measuring Luminance with a Digital Camera. September 16, 2011.http://www.ee.ryerson.ca/ phiscock/2)Perel, Michael. Headlamp Glare Through the Ages: How to measure it? What to do about it?http://www.cormusa.org/uploads/2013 Grum Lecture PEREL.pdf3)AGI32 WebHelp. Calculations UGR g calculation points/Calculations UGR Concepts.htm4)AGI32 WebHelp. Calculations Glare Rating g calculation points/Calculations Glare RatingConcepts.htm5)Alliance for Solid-State Illumination Systems and Technologies (ASSIST). ASSISTrecommends A Method for Estimating Discomfort Glare from Exterior Lighting Systems.Volume 9, Issue 1. April 2011. iscomfortGlare.pdf6)Linney, Andrew Scott. Maximum Luminances and Luminance Ratios and their Impact onUsers Discomfort Glare Perception and Productivity in Daylit Offices. Thesis, VictoriaUniversity of Wellington, Master of Building Science, ndle/10063/651/thesis.pdf?sequence 17)Osterhaus, W. Recommended Luminance Ratios And Their Applications In The Design OfDaylighting Systems For Offices. Centre for Building Performance Research, School ofArchitecture Victoria University of Wellington, New Zealand. 2002.8)McGowan Broz Engineers/DMD. Understanding Glare, Not All Sports Fixtures Are CreatedEqual. 2001. alHeightsBoards.pdf9)Wonwoo Kim, Jeong Tai Kim. A Formula of the Position Index of a Glare Source in theVisual Field. Deparment of Architectural Engineering, Kyung Hee University, Yongin 46-701,Korea. May 27, 2010.13
By: Jeff Shuster Addressing Glare in Solid‐State Lighting Abstract: Glare is a phenomenon caused by a bright light source that inhibits the ability to view a task or scene, due to an uncomfortable or even blinding effect on the viewer. Although many