Transcription
Proceedings of the World Congress on Engineering 2015 Vol IWCE 2015, July 1 - 3, 2015, London, U.K.Improving Cities Sustainability through the Useof Data Mining in a Context of Big City DataCarlos Costa and Maribel Yasmina SantosAbstract— Nowadays, cities consume more energy to fueltheir day-to-day activities. With the rise of electrical devices weface more challenges associated with energy control anddistribution. Apart from this, we also spend a lot of energytrying to either heating or cooling our homes. This paperillustrates an architecture to extract, load, transform, mine andforecast Big Data. This technological architecture makes use ofa dataset containing electricity and gas consumption of homesdistributed within multiple USA cities and states. The mainpurpose of our work consists in delivering to citizens a newform of self-monitoring their electricity and gas consumption,by comparing them to other homes within their cluster or stateand by forecasting future energy consumptions. Moreover, thearchitecture also delivers to energy providers and cities asmarter overview of the energy landscape. This work usessimulated data from United States of America along withHadoop, WEKA and Tableau to store and process Big Data, toproduce clusters and time series forecasts, and to visualizeinformation, respectively. The results reveal that, using thisarchitecture, it is possible to produce accurate clusters ofhomes based on their energy consumption and it is alsopossible to forecast future electricity consumptions with a smallmargin of error.Index Terms— Big Data, Clustering, City Sustainability,Smart City, Time Series Forecasting.UI. INTRODUCTIONrban centers are growing and they seem to be the firstchoice for modern living, based on the fact that morethan half of the population is living in urban environments[1]. With this phenomenon, various problems arise andcities need to adapt themselves to this trend.In the last years we started hearing on a new concept, theconcept of Smart Cities. Governments are facing more costson labor, transportation, infrastructures, energy, and manyother basic needs. Furthermore, citizens are behaving likenatural consumers of government services and are nowdemanding more, regardless of the existing constraints [2].Here is where Big Data comes along. Cities and theircitizens generate vast amounts of data, with multiple degreesof complexity, at different speeds, from various sources, thatdoes not conform to traditional technologies. This lead us toManuscript received March 11, 2015; revised March 31, 2015. Thiswork was supported by FCT – Fundação para a Ciência e Tecnologia,within the Project Scope: UID/CEC/00319/2013 and funded by the SusCityproject, MITP-TB/CS/0026/2013.Carlos Costa is with ALGORITMI Research Centre, University ofMinho, Campus de Azurém, 4800-058 Guimarães, Portugal (correspondingauthor, phone: 351-253-510308; fax: 351-253-510300; e-mail:a61555@alunos.uminho.pt).Maribel Yasmina Santos is with ALGORITMI Research Centre,University of Minho, Campus de Azurém, 4800-058 Guimarães, Portugal(e-mail: maribel@dsi.uminho.pt).the general definition of Big Data [3]–[5].The emerging need to make cities smarter, associatedwith the relatively recent concept of Big Data and thepossibilities it brings, constitute the motivational basis forthe development of this Big Data analytics architecture. It isable to process data from a city and, as we shalldemonstrate, provide intelligent services, both for citizensand for the government or other stakeholders, through theuse of data mining techniques such as clustering and timeseries forecasting [6]. Clustering is used to identify groupsof homogeneous homes, with similar patterns in terms ofenergy consumption, enabling comparison and ranking,while time series forecasting is used to foresee futureconsumptions. The CRISP-DM model is used to conduct thedata mining process, going through the phases of businessunderstanding, data understanding, data preparation,modeling and evaluation [7].The data used to validate the architecture is the “EPLUSTMY2 residential base” dataset [8], containing 238 files.Each file represents one year of electricity and gas hourlyconsumption, from a simulated home in a certain city inUSA. Information about all the USA states was alsoextracted, containing all the USA state abbreviations,names, population and land area.It is expected that the proposed architecture adequatelysupport the intelligent monitoring and forecasting service,delivering refined visual data analyses. To validate theobtained results, the intra-cluster similarity (within clustersum of squared errors) is considered, besides cluster variety,as well as a small error rate for the time series forecasting.This document is structured as follows: Section IIsummarizes related work and describes the ways in whichthis work contributes to the state-of-the-art in this field.Section III illustrates the proposed technologicalarchitecture and gives an overview of the used dataset;Section IV describes the data preparation and miningprocess, including clustering and time series forecasting;Section V presents the data analysis and visualization, inorder to redefine the energy bill and improve energyconsumption monitoring. Finally, Section VI concludes withsome remarks about the undertaken work and someguidelines of future work.II. RELATED WORKWithin the scientific community there are alreadyavailable some approaches to forecast energy consumption.Some of the works are mainly related with the energy price[9]–[11], while others address the research around energyloads [12], [13]. The common practice around these relatedworks seems to be the mining of clusters before applyingforecasting models. According to Alzate and Sinn [12], they(revised on 1 March 2016)ISBN: 978-988-19253-4-3ISSN: 2078-0958 (Print); ISSN: 2078-0966 (Online)WCE 2015
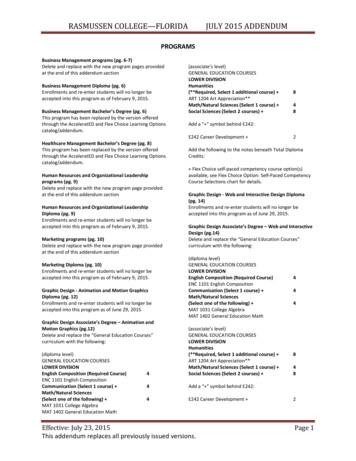
Proceedings of the World Congress on Engineering 2015 Vol IWCE 2015, July 1 - 3, 2015, London, U.K.have achieved a 20% improvement in forecasting accuracy,using clustering before applying a forecaster.Regardless of the used clustering techniques, such as KMeans [9], [11], Subtractive Clustering [10], KernelSpectral Clustering [12] or Partial Clustering [13], as well asforecasting techniques, such as Neural Networks [11],Support Vector Machines [9], Adaptive Neuro-FuzzyInference System [10], PARX [12] or Fuzzy Inference [13],there seems to be a general common approach: use ofclustering to improve efficiency of the forecasting model,either by adapting a model for each cluster or by usingclustering as a feature extraction technique. These relatedworks focus their results on improving data miningefficiency with state-of-the-art techniques, and in generalthe results show that the outcome is satisfactory. However,they are mainly focused on the data mining process andresults, discarding not only the nature of the real world datathat requires new storage and processing technologies butalso the importance of the possible technologicaldeployment, in order to deliver new services to citizens.Other related works already describe the smart meter dataas Big Data, presenting some methods to visualizeinformation and extract knowledge [14], [15]. Apart fromthat, there are some works being developed in order to studythe importance of the storage and processing infrastructure[15]–[17], highlighting non-relational databases andHadoop.This work aims to demonstrate how we can process therecorded energy data through a technological Big Dataanalytics architecture, using clustering and time seriesforecasting techniques, not only to select the adequateforecasting models (Linear Regression, Neural Network,Support Vector Machines or Decision Tree) for each cluster,but also to enrich the visual analysis and final smart service,delivering a reinvented energy bill to citizens and a newform of monitoring and targeting energy consumption togovernments and energy providers. Consequently, thepresented results are focused not only on data miningsuccess, but also on how we can change the consumer andprovider experience, by delivering reinvented ways ofpresenting energy consumption. As we also aim to achieve asmall clustering and forecasting error, this work makes useof Big Data technologies to validate the possibledeployment in a real world application scenario and presentsthe final results in a rich visual analysis, in order to surpassthe gap between a successful data mining application and aSmart City service.fly” and store the results on HIVE. Finally, we are able toperform visual data analytics using Tableau.In order to understand the dataset used in this work, itsschema will be presented, as well as how all the 238 fileswere verified, extracted and stored in Hadoop.Each file in this dataset contains data from a simulatedhome, with average characteristics, like 3 bedrooms and 1 or2 bathrooms, taking into consideration the environment andclimate in which it is inserted. There is one file per city inUSA, representing the average hourly consumption of ahome within that city. Fig. 2 helps in understanding theschema and content of the files.Fig. 1. Technological architecture overview.Some classes of attributes can be identified: generalvalues of energy (electricity facility, gas facility);heating/cooling (electricity heating, gas heating, electricitycooling, electricity HVAC fans, electricity HVAC,electricity fans, gas water heating); lights (electricity interiorlights, electricity exterior lights); interior equipment(electricity appl interior equipment, electricity misc interiorequipment). HVAC stands for “heating, ventilating and airconditioning”, APPL means “appliances” and MISC means“miscellaneous”.III. DATA AND ARCHITECTURE OVERVIEWAll the introduced steps and technologies proposed in thiswork can be abstracted in a technological architecture thatcan be seen in Fig. 1, in order to understand what could be astarting point for future implementations of similar services.The architecture makes use of multiple Hadoopcomponents, such as: Hadoop Distributed File System(HDFS) to store raw files; PIG to process scripts in order toaggregate data; HBase to temporarily store PIG results;HIVE to act as a data warehouse, containing the final datasetto originate the visual analysis. Talend Open Studio for BigData is responsible for all the data flow processes, directingdata from HDFS and HBase to the local file storage and viceversa. Then, WEKA was used to build clustering andforecasting models. Talend Open Studio for Big Data usesthe WEKA’s Java library to integrate the models “on theFig. 2. Original dataset schema.As can be seen in Fig. 2, the state and city information isembedded in the file name, requiring an additionalprocessing effort for extracting these labels and storing theminside the file, for later analysis.Working with Big Data requires to consider somecharacteristics the data might have: volume, variety,velocity, veracity and value [18]. In our demonstration case,taking into account that it is a proof-of-concept running onlyin one machine, the data had a considerable volume (238files as mentioned, containing more than 8760 rows each,(revised on 1 March 2016)ISBN: 978-988-19253-4-3ISSN: 2078-0958 (Print); ISSN: 2078-0966 (Online)WCE 2015
Proceedings of the World Congress on Engineering 2015 Vol IWCE 2015, July 1 - 3, 2015, London, U.K.totaling more than 550 megabytes). Apart from that, in areal scenario, these data will come from various sensorsnetworks and will be refreshed on an hourly basis. Thisdataset was used to test the architecture and intelligentservice, because it brings with it the veracity of thesimulation process [8] and the valuable information that canbe extracted using data mining and visualization.data, the float values were rounded to the nearest integer,due to data presentation purposes (Fig. 4).IV. DATA PREPARATION AND MININGAt this point is important to recall that Big Data quality isone of the most challenging steps, mainly due to its volume[19]. In this demonstration case, and after storing all 238files in a comprehensive platform like Hadoop, aftermerging all the file in a unique one, containing all theavailable data, we were able to analyze data quality usingTalend Open Studio for Data Quality. The data did notpresented major flaws to consider in future transformationssteps, mainly because it is simulated data that is notinfluenced by manual inserted problems. In a real worldapplication it is also expected that the data do not presentmajor flaws, due to the fact that it is extracted from sensors,using autonomous methods. Some files presented the value0 in gas consumption. Later in this document it is explainedhow it will affect the development process.The Data Mining task integrated a clustering exercise inorder to segment homes by their electricity and gasconsumption and a time series forecasting exercise toforecast future electricity consumptions. Combining thesetwo techniques we deliver a method to compare a home’shistoric and forecasted consumption with other homes in itscluster and to compare consumptions between clusters.A. ClusteringTo identify clusters from the dataset, a less detaileddataset was needed, namely, data grouped by state and city.To accomplish this, a grouping operation was performedusing PIG, a high-level language embedded in Hadoopdesignated to perform data analysis.In a general overview, all the 238 files were loaded, theenergy dataset was joined with the file containing all statesinformation from USA and all the data was grouped by stateand city, calculating the sum of all grouped rows (Fig. 3).Fig. 4. Clean, construct and format data for clustering purposes.As previously illustrated, all the attributes were includedin data extraction and cleansing process. After doing somefurther analysis we maintained only the generalconsumptions on electricity and gas attributes, opting toexclude from the clustering process all the detailedconsumptions (heating/cooling, lights and interiorequipment). This decision was made after verifying thedispersion of the data, as some detailed consumptions didnot present a significant level of dispersion. Apart from this,the general consumptions and the more detailed ones arecorrelated, and highly correlated attributes tend to influencesome cluster techniques [20].In this study, the clustering process is undertaken usingthe K-means algorithm, which requires the specification ofan input parameter, k, representing the number of clusters.Once there is no indication of the appropriate number ofclusters for this dataset, all the available data was iterativelyused to produce clusters, incrementing the number ofclusters to produce and recording each intra-clustersimilarity error.K-means is a well-known clustering model that partitionsa dataset into k groups, selecting the cluster centers anditeratively refining them [21]. This was the only chosenmodel due to the simplicity to evaluate the results, using theintra-cluster similarity (within cluster sum of squarederrors). The K-means model was built using WEKA’sdefault parameters, changing only the number of clusters toproduce, and using the Euclidean as distance function. TheFig. 5 shows the intra-cluster similarity for each clusteringtrial, each one with a different number of clusters.Fig. 3. PIG script for generating aggregated consumptions by state andcity.The results consist of annual energy consumption by stateand city and were stored in HBase that acted as our stagingarea.Because the data quality analysis demonstrated that thereare not any null or blank values, only zeros were replaced bythe global mean by state of the data used in the clusteringprocess, previously stored in HBase (Fig. 4).As far as constructing new data, the more detailedattributes of electricity consumption were aggregated inthree categories: heating/cooling, lights and interiorequipment. All other attributes remain the same. To formatFig. 5. Intra-cluster similarity for each clustering trial.Using the L method in which the “knee is found in anumber of clusters vs. clustering evaluation metric graph”[22], we are able to identify that 5 seems to be the idealnumber of clusters for this dataset.The model synthesis is shown in Fig. 6, pointing thecentroids of the identified clusters and the number of citiesin each one of them. The clustering model is built using theconsumption of electricity and gas, grouped by state andcity, as previously explained.(revised on 1 March 2016)ISBN: 978-988-19253-4-3ISSN: 2078-0958 (Print); ISSN: 2078-0966 (Online)WCE 2015
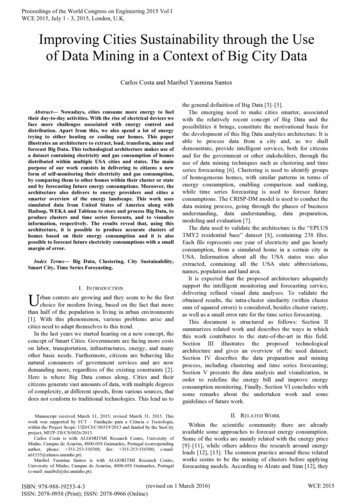
Proceedings of the World Congress on Engineering 2015 Vol IWCE 2015, July 1 - 3, 2015, London, U.K.Fig. 6. Clustering model synthesis.B. Time series forecastingFor the time series forecasting process, the results fromthe clustering process are used as input for a file containingthe state name, state abbreviation, city name and clusternumber, which result was joined with the originalconsumption dataset (Fig. 2). Another PIG script was codedto process that step and group the result by cluster numberand timestamp (day and hour). This gives us the hourlyconsumption of each cluster during the entire year.Regarding the time granularity, and as the datasetcontained one year of energy consumption, not allowing forany seasonality analysis, the chosen time granularity was perweek, being able to predict the next weeks of energyconsumption, offering high value for monitoring andplanning. After this process, the dataset to use in theforecasting process includes the following attributes: clusternumber, week and electricity and gas consumptions.Before starting the forecasting process, and as the firstand last weeks of the dataset did not offer the full 7 days, wechoose to discard them, improving the variance of the timeseries.Previously in the clustering process, the detailed attributeshad to be removed, leaving only the general electricity andgas attributes. However, because we are now dealing withtime series, we have to remember that some values of gasconsumption were zero, causing one of the clusters to havezero as center. Besides that, we observed that another clusterpresents serious declines in gas consumption. Due to thesetwo facts, this work will only do forecasts of electricityconsumption.Testing time series forecasting using WEKA is verysimilar to other traditional data mining techniques, likeclassification or regression. To evaluate models the holdoutmethod was used, leaving 20% of the dataset for testingpurposes. There were 3 different metrics: Mean AbsoluteError (MAE); Root Mean Squared Error; DirectionAccuracy.Four models were built and assessed (Linear Regression,Multilayer Perceptron, SMOReg and M5P tree), for each ofthe five clusters, using WEKA’s default parameters. Themaximum lag was set to 12 weeks and the number of timeunits to forecast was set to 8 weeks, meaning that the modelwill mainly look at the previous 12 weeks to forecast thenext 8. Fig. 7 shows the obtained results.Fig. 7. Electricity forecasting evaluation.The obtained measures indicate that the chosen modelsbehave really well, taking into consideration that the errorsare measured in kilowatts/hour (kw/h). This means that foreach cluster, there is at least one model that can forecast thenext 8 weeks of electricity consumption with a MeanAbsolute Error (MAE) less than 16.8 kw/h, except for thecluster 2, whose lowest observed MAE is around 46.Moreover, there are models capable of forecast with a MAEof 6.7 kw/h (Fig. 8). Taking into consideration that valuesfluctuate between 120 and 412 kw/h, these tests revealsatisfactory results.Fig. 8. Example of a tested model with a low MAE.The clustered dataset was tested with all 4 models, withthe goal of finding the best forecaster for each cluster and itscorresponding cities. The underlying model of the 2nd, 3rd,4th and 5th clusters is proven to be the M5P tree, while forthe 1st cluster is the Multilayer Perceptron, as can be seen inFig. 7. Consequently, a home will inherit the forecaster of itscluster. For example, if a New York home is in cluster 3, theforecaster that will be used to predict the electricityconsumption will be the M5P tree.As can be concluded, the model that successively provesto be the most suitable is the M5P tree, a decision treewhose leaves are linear models, as shown in Fig. 9.Fig. 9. M5P tree model for cluster 5.Next section presents the analysis and visualization of theprediction models in a Smart City context.V. DATA ANALYSIS AND VISUALIZATION: REINVENTINGTHE ENERGY BILLThis section shows how the models that served asforecasters for each cluster are used to forecast data fromhomes within the corresponding cluster. This wasaccomplished by the integration of WEKA’s Java libraryinto Talend Open Studio for Big Data, allowing, for eachhome, to have not only historic data, but also forecasteddata.At this point all the historic, clustered and forecasted datawere in HDFS, and it was necessary to give back somestructure to it, forming a perfectly fitted dataset for analysisand visualization. All relevant attributes were joined in aHIVE table (Fig. 10), intended to store data in a structuredform, which is suitable for visual analysis. The Hive tableincludes: State abbreviation - abbreviation of the USA statename; State name - name of the USA state; City - name ofthe USA city; Cluster - cluster number that the respectivehome belongs; Model - model used to forecast data from therespective home; Electricity - home’s electricityconsumption in that week; Electricity cluster avg - averageelectricity consumed by all homes in that cluster on thatweek; Gas - home’s gas consumption in that week; Gascluster avg - average gas consumed by all homes in thatcluster on that week; Week - number of the week. Starts in(revised on 1 March 2016)ISBN: 978-988-19253-4-3ISSN: 2078-0958 (Print); ISSN: 2078-0966 (Online)WCE 2015
Proceedings of the World Congress on Engineering 2015 Vol IWCE 2015, July 1 - 3, 2015, London, U.K.week 2, ends on week 60. Weeks 53 to 60 contain forecastedvalues; Predicted - flag pointing forecasted or historic data.Fig. 10. Final dataset's sample for visual analysis.Since the system is capable of processing energyconsumption data and it is also capable of clustering andforecasting it, new perspectives on how to give feedback tohomes can emerge. Fig. 11 shows a visual data analysis forone home in New York City. The analysis begins comparingthe New York home against the cluster in which it isinserted, presenting the average energy consumptions. Then,the line chart overlaps the home electricity consumption(dark blue line) with the cluster consumption (light blueline), containing not only historic data but also predictedvalues (dark orange line for the home and light orange linefor the cluster), resulted from the application of the timeseries forecasting model. Besides that, it is also possible torank homes by their energy consumption, comparing acertain home to others within its cluster. That ranking can beillustrated in a geographical map. The last chart in Fig. 11shows a heat map, with the aim of comparing the home inNew York with other homes in the same USA state.The analysis described above exemplifies how innovativeand intelligent Smart Cities services can be, and in thisparticular case, how clustering and time series forecastingcan be joined to form a visual analysis, that contributessignificantly for citizens to have a more controlledconsumption experience, monitoring historical and predicteddata and comparing their home with others in their cluster orstate.Traditional energy bills do not give a clear overview ofour energy consumption. They, of course, tell us how manyenergy we spent in a certain period, but if we want to makeour cities smarter and put architectures like this in real worldapplications the energy bill could: Tell how our homecompares to our cluster average, and how it will compare inthe future if we keep spending energy the way we did;Illustrate in a geographical map what is our home’s energyranking, using historical or predicted data; Show us how wecompare to homes in the same state, on a weekly basis.These are only some of the possible examples.Another perspective that this study provides on data isuseful for energy providers and the government. In today’sworld, governments are having difficulties in managingresources, and energy is one of them. Fig. 11 shown areinvented energy bill, while in Fig. 12 a new form ofmonitoring and targeting energy can be seen, with the abilityto compare clusters average values and observe predictedchanges in the clusters energy ranking.Apart from that, the electricity and gas trend ofconsumption can also be analyzed on a weekly basis and aninter cluster comparison can be established, comparing eachcluster consumption and their respective evolution fromprevious weeks.Smart cities government can manage their resourcesmuch more easily, and energy providers can target anddistribute energy based on a more panoramic view, such asthe aggregation by clustering. Apart from that, they canpredict how much energy will be needed during the next twomonths and how clusters ranking will change. All of thesetechniques lead them to a richer decision making process.Fig. 12. New form of monitoring and targeting energy consumption.Fig. 11. Reinvented energy bill.(revised on 1 March 2016)ISBN: 978-988-19253-4-3ISSN: 2078-0958 (Print); ISSN: 2078-0966 (Online)WCE 2015
Proceedings of the World Congress on Engineering 2015 Vol IWCE 2015, July 1 - 3, 2015, London, U.K.VI. CONCLUSIONThis paper presented a Big Data analytics architecture,contemplating data storage, processing, mining andvisualization.The architecture presented in this paper is adequate tosupport the storage and processing of all data. However, thisis a high-level presentation of the same, and some variablesare not contemplated yet, such as the infrastructure to runthe Hadoop cluster, the ways of extracting data for otherapplications like mobile apps or Open Data Platforms, andsecurity concerns.The data mining components of the architecture showedinteresting results, since a rich clusters variety was achieved,as the different electricity and gas consumptions averages ofeach cluster demonstrated. Also, K-means algorithm wasable to achieve a small intra-cluster similarity. Apart fromthis, such a low error rate on almost every tested forecasterwas a successful outcome. Finally, the visual data analysismerged all the results in a refined user experience, in orderto successfully validate the architecture and its underlyingenergy monitoring service.For future work it is worth noting the variables that arenot yet contemplated in this technological architecture, suchas the infrastructure required to run the Hadoop cluster,integration with mobile apps or Open Data Platforms, andsecurity concerns. Also the fact that this work does notconsider the seasonality of the consumption and this shouldbe integrated in future works. To accomplish that, a datasetwith multiple years of consumption needs to be used.[15][16][17][18][19][20][21][22]Y. Simmhan, S. Aman, A. Kumbhare, R. Liu, S. Stevens, Q. Zhou,and V. Prasanna, “Cloud-Based Software Platform for Big DataAnalytics in Smart Grids,” Comput. Sci. Eng., vol. 15, no. 4, pp. 38–47, Jul. 2013.M. Arenas-Martínez, S. Herrero-Lopez, A. Sanchez, J. R. Williams,P. Roth, P. Hofmann, and A. Zeier, “A Comparative Study of DataStorage and Processing Architectures for the Smart Grid,” in 2010First IEEE International Conference on Smart GridCommunications (SmartGridComm), 2010, pp. 285–290.M. Mayilvaganan and M. Sabitha, “A cloud-based architecture forBig-Data analytics in smart grid: A proposal,” in 2013 IEEEInternational Conference on Computational Intelligence andComputing Research (ICCIC), 2013, pp. 1–4.P. Chandarana and M. Vijayalakshmi, “Big Data analyticsframeworks,” in 2014 International Conference on Circuits, Systems,Communication and Information Technology Applications(CSCITA), 2014, pp. 430–434.M. Paryasto, A. Alamsyah, B. Rahardjo, and Kuspriyanto, “Big-datasecurity management issues,” in 2014 2nd International Conferenceon Information and Communication Technology (ICoICT), 2014, pp.59–63.E. Mooi and M. Sarstedt, “Cluster Analysis,” in A Concise Guide toMarket Research, Springer Berlin Heidelberg, 2011, pp. 237–284.K. Wagstaff, C. Cardie, S. Rogers, and S. Schroedl, “Constrained Kmeans Clustering with Background Knowledge,” in In ICML, 2001,pp. 577–584.S. Salvador and P. Chan, “Determining the number tationalgorithms,” in 16th IEEE International Conference on Tools withArtificial Intelligence, 2004. ICTAI 2004, 2004, pp. 576–584.This paper was modified in February 28, 2016, to updatesupporting [10][11][12][13][14]I. Vilajosana, J. Llosa, B. Martinez, M. Domingo-Prieto, A. Angles,and X. Vilajosana, “Bootstrapping smart cities through a selfsustainable model based on big data flows,” IEEE Commun. Mag.,vol. 51, no. 6, pp. 128–134, Jun. 2013.J. Hedlund, “The Smart City: Using IT to Make Cities MoreLivable.” Dec-2013.M. Chen, S. Mao, and Y. Liu, “Big Data: A Survey,” Mob. Netw.Appl., vol. 19, no. 2, pp. 171–209, Apr. 2014.K. Krishnan, Data Warehousing in the Age of Big Data, 1st ed. SanFrancisco, CA, USA: Morgan Kaufmann Publishers Inc., 2013.P. Zikopoulos and C. Eaton, Understanding Big Data: Analytics forEnterprise Class Hadoop and Streaming Data, 1st ed. McGraw-HillOsborne Media, 2011.J. Gama, Knowledge Discovery from Data Streams. 2010.P. Chapman, J. Clinton, R. Kerber, T. Khabaza, T. Reinartz, C.Shearer, and R. Wirth, “CRISP-DM 1.0: Step-by-step data miningguide.” 2000.N. Clark, “Commercial and Residential Hourly Load Profiles for allTMY3 Locations in the United States,” Catalog, 2013. .Y. Xie, H. Zheng, and L.-Z. Zhang, “Electricity price forecasting byclustering-LSSVM,” in Power En
Talend Open Studio for Data Quality. The data did not presented major flaws to consider in future transformations steps, mainly because it is simulated data that is not influenced by manual inserted problems. In a real world application it is also e