Transcription
MD Consult - Effect of hyperventilation on cerebral blood flow in traumatic head injury: Clinical relevance and monitoring correlates - Critical Care Medicine - Medical JournalGeneric EditionHelp Newsletter Create Account (Why Create an Account?) Log in ExitHomeBooksJournalsThe ClinicsJournals / MEDLINESearchPatient EducationGuidelinesImagesNewsCMESearchforLast NameFirst InitialDrugsMIAuthor:Journal Name:Date Range: 2006 to CurrentOR Date:Article Type:Ex. Mar 2002AllSubject Age: AllYou are here: Home Journals Critical Care Medicine Effect of hyperventilation on cerebral blood flow.Email to Colleague PrintVersionCloseAbstractCritical Care Medicine - Volume 30, Issue 9 (September 2002) - Copyright 2002 Lippincott Williams & Wilkins - About This JournalFull TextFEATURE ARTICLESYear Books Year Book of Critical Care Medicine Year Book of Emergency Medicine About the Year BooksFull Text Contents Frontmatter Introduction MATERIALS AND METHODS Subjects.Clinical Protocols.PET.Image Analysis.Estimation of Critically Hypoperfused andHyperperfused Brain Volumes.CO2 Reactivity. Statistical Analysis. RESULTS Baseline Physiology, Blood Flows, and the Burdenof Hypoperfusion.Effect of Hyperventilation on Global Physiology inPatients.Effect of Hyperventilation on HypoBV andHyperBV.Paco2 Thresholds for Critical Cerebral Hypoperfusion.Global Monitors of Oxygen Delivery. DISCUSSION Effect of hyperventilation on cerebral blood flow in traumatic head injury: Clinical relevanceand monitoring correlatesEffect of hyperventilation on cerebral blood flow in traumatic head injury: Clinical relevanceand monitoring correlatesJonathan P. Coles, FRCA;Pawan S. Minhas, FRCS;Tim D. Fryer, PhD;Peter Smielewski, PhD;Franklin Aigbirihio, PhD;Tim Donovan, BSc;Stephen P. M. J. Downey, MSc;Guy Williams, PhD;Dot Chatfield, BSc;Julian C. Matthews, PhD;Arun K. Gupta, FRCA;T. Adrian Carpenter, PhD;John C. Clark, DSc;John D. Pickard, FRCS;David K. Menon, PhDFrom the Division of Anaesthesia (JPC, DC, AKG, DKM), the Department of Neurosurgery (PSM, JDP), and the WolfsonBrain Imaging Centre (JPC, PSM, TDF, PS, FA, TD, SPMJD, GW, JCM, TAC, JCC, JDP, DKM), University of Cambridge,Addenbrooke’s Hospital, Cambridge, UK.Supported, in part, by the Medical Research Council, a Technology Foresight Award from the UK Government, and by aRoyal College of Anaesthetists/British Journal of Anesthesia project grant. Dr. Coles was funded by a Research TrainingFellowship from the Addenbrooke’s Charities and is currently a Wellcome Research Training Fellow. Dr. Minhas wassupported by an MRC Clinical Research Training Fellowship, and Ms. Chatfield was supported by a grant from the Fund forAddenbrooke’s.Address requests for reprints to: Jonathan P. Coles, FRCA, Box 93, Addenbrooke’s Hospital, Cambridge, CB2 2QQ, UK. Email: jpc44@wbic.cam.ac.ukMethodologic Issues.Clinical /article/body/96613048-5/jorg journal&source MI&sp 12571118&sid 713179473/N/305899/1.html?issn 0090-3493 (1 of 11) [6/6/2008 5:44:14 PM]
MD Consult - Effect of hyperventilation on cerebral blood flow in traumatic head injury: Clinical relevance and monitoring correlates - Critical Care Medicine - Medical Journal REFERENCESHyperventilation increases the volume of severely hypoperfused tissue within theinjured brain, despite improvements in cerebral perfusion pressure andintracranial pressure.Find Similar ArticlesObjective:To investigate the effect of hyperventilation on cerebral blood flow in traumatic brain injury.Design:A prospective interventional study.Setting:A specialist neurocritical care unit.Patients:Fourteen healthy volunteers and 33 patients within 7 days of closed head injury.Interventions:All subjects underwent positron emission tomography imaging of cerebral blood flow. In patients, Paco2 was reduced from 36 1 to 29 1 torr (4.8 0.1to 3.9 0.1 kPa) and measurements repeated. Jugular venous saturation (Sjvo2 ) and arteriovenous oxygen content differences (AVDO2 ) were monitoredin 25 patients and values related to positron emission tomography variables.Measurements and Main Results:The volumes of critically hypoperfused and hyperperfused brain (HypoBV and HyperBV, in milliliters) were calculated based on thresholds of 10 and 55mL·100g 1 ·min 1 , respectively. Whereas baseline HypoBV was significantly higher in patients (p .05), baseline HyperBV was similar to values inhealthy volunteers. Hyperventilation resulted in increases in cerebral perfusion pressure (p .0001) and reductions in intracranial pressure (p .001),whereas Sjvo2 ( 50%) and AVDO2 ( 9 mL/mL) did not exceed global ischemic thresholds. However, despite these beneficial effects, hyperventilationshifted the cerebral blood flow distribution curve toward the hypoperfused range, with a decrease in global cerebral blood flow (31 1 to 23 1 mL·100g 1 ·min 1 ; p .0001) and an increase in HypoBV (22 [1–141] to 51 [2–428] mL; p .0001). Hyperventilation-induced increases in HypoBV were apparentlynonlinear, with a threshold value between 34 and 38 torr (4.5–5 kPa).Conclusions:Hyperventilation increases the volume of severely hypoperfused tissue within the injured brain, despite improvements in cerebral perfusion pressureand intracranial pressure. Significant hyperperfusion is uncommon, even at a time when conventional clinical management includes a role for modesthyperventilation. These reductions in regional cerebral perfusion are not associated with ischemia, as defined by global monitors of oxygenation, butmay represent regions of potentially ischemic brain tissue.Key Words: head injury; positron emission tomography; cerebral blood flow; ischemia; cerebral oxygenation; hyperventilationIntroductionReductions in Paco2 result in cerebral vasoconstriction and a reduction in cerebral blood volume ( [1] ). Consequently, hyperventilation has been extensively used inthe past for the control of intracranial hypertension in patients with traumatic brain injury (TBI) ( [2] [3] [4] ). However, these reductions in cerebral blood volume areassociated with reductions in cerebral blood flow (CBF) ( [1] [5] ). Increasing evidence suggests the presence of early cerebral hypoperfusion (and possibly ischemia)in patients with TBI ( [6] [7] [8] ), and there are concerns that hyperventilation-induced reductions in CBF may precipitate or worsen ischemia ( [2] [9] [10] [11] [12] ) andaffect outcome ( [13] ). It has been suggested that the risk of such ischemia may be reduced by bedside measurement of CBF and indices of adequacy of CBF ( [2][6] [9] [14] [15] ). These include oxygen saturation in jugular venous blood (Sjvo2 ) and arteriovenous differences in oxygen content (AVDO2 ). CBF values of 20mL·100g 1 ·min 1 ( [6] [7] [16] [17] ), Sjvo2 values of 50% ( [18] [19] ), and AVDO2 of 9 mL/mL ( [9] [18] [20] [21] ) suggest significant ischemia. Whereas in comparison,CBF in excess of the normal range ( 55 mL·100g 1 ·min 1 ) ( [9] [14] [21] [22] ), AVDO2 values of 4 mL/mL ( [9] [14] [18] [21] [22] ), and Sjvo2 of 75% ( [18] ) suggesthyperemia. In these circumstances, hyperventilation may reduce the extent or severity of hyperemia and help to normalize pathophysiology. Although theseendpoints are commonly used as part of clinical protocols and in research studies, their relevance is questioned by studies that have used stable xenon-enhancedradiographic computed tomography (xenon CT) to demonstrate marked heterogeneity in regional CBF ( [7] [10] ) and cerebrovascular CO2 reactivity following 613048-5/jorg journal&source MI&sp 12571118&sid 713179473/N/305899/1.html?issn 0090-3493 (2 of 11) [6/6/2008 5:44:14 PM]
MD Consult - Effect of hyperventilation on cerebral blood flow in traumatic head injury: Clinical relevance and monitoring correlates - Critical Care Medicine - Medical Journal( [10] ).These data raise the possibility that global measures of CBF adequacy (Sjvo2 , AVDO2 ) may miss critical regional hypoperfusion and potential ischemia. We havedirectly addressed this issue by mapping regional CBF in patients with severe head injury using oxygen-15 positron emission tomography (PET) at normocapnia andfollowing hyperventilation. These three dimensional data sets not only provide information regarding mean CBF and its relation to global bedside monitors ofcerebrovascular adequacy, but they also allow volumetric estimates of cerebral hypoperfusion. This has not been possible using xenon CT because imaginginvolves acquisition of data from a limited number of slices, which therefore limits coverage of the brain. We have sought to refine our understanding of howhyperventilation affects the injured brain and to emphasize the difficulty in detecting regional hypoperfusion and potentially ischemic brain tissue by using globalmonitors of cerebrovascular adequacy.MATERIALS AND METHODSSubjects.PET studies were undertaken on 14 healthy volunteers and 33 patients within 7 days of head injury. Patients had a median (range) postresuscitation Glasgow ComaScale score (GCS) of 8 (3–13) at presentation, but all subsequently developed elevation in intracranial pressure (ICP) severe enough to require mechanicalventilation for its control (Table 1). In 25 of these subjects, simultaneous measurement of Sjvo2 and AVDO2 were available.SexAge, mean (range), yrsHealthy VolunteersPatients2 women, 12 men7 women, 26 men44 (29–59)Postresuscitation GCS, median (range)32 (16–78)8 (3–13)Intracranial lesionsExtradural hematoma7Subdural hematoma8Hemorrhagic contusion and/or traumaticsubarachnoid hemorrhageDiffuse axonal injurySurgical evacuation of mass lesion a28112Second-tier therapies aExternal CSF drainage4Decompressive craniectomy10Hypothermia, 34 C5Barbiturate coma2Extracranial injuries (%)20 (61)Interval between injury and PET imagingWithin 24 hrs4Days 2–421Days 5–78Favorable outcome at 6 mos (%)18 (55)GCS, Glasgow Coma Scale; CSF, cerebrospinal fluid; PET, positron emission tomography.aPatient management is detailed before PET imaging.All volunteers provided informed consent for studies, and assent was obtained from the next of kin for all patient studies. All studies were approved by the LocalResearch Ethics Committee at Addenbrooke’s Hospital, Cambridge, UK, and by the Administration of Radioactive Substances Advisory Committee of the UnitedKingdom. All studies were performed in accordance with the Declaration of Helsinki as revised in Edinburgh in October 2000.Clinical Protocols.All head-injured patients were managed with protocol-driven therapy aimed at maintaining ICP at 20 mm Hg and cerebral perfusion pressure (CPP) of 70 mm 48-5/jorg journal&source MI&sp 12571118&sid 713179473/N/305899/1.html?issn 0090-3493 (3 of 11) [6/6/2008 5:44:14 PM]
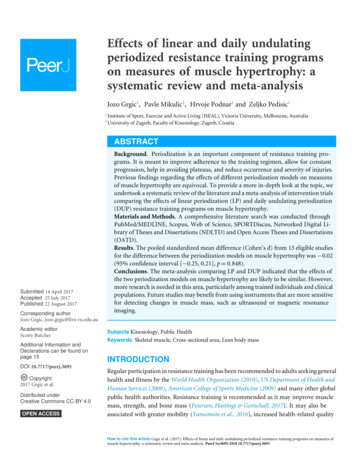
MD Consult - Effect of hyperventilation on cerebral blood flow in traumatic head injury: Clinical relevance and monitoring correlates - Critical Care Medicine - Medical Journalas described by Menon ( [23] ). Graded interventions used for CPP and ICP control included sedation (propofol up to 8 mg·kg 1 ·hr 1 and fentanyl, 1–2 μg·kg 1 ·hr 1 )and neuromuscular blockade, surgery for space-occupying lesions, drainage of cerebrospinal fluid, vasoactive agents for CPP augmentation, osmotic diuretics, mildhyperventilation (to 34 torr [4.5 kPa]), mild to moderate hypothermia (33–36 C), decompressive craniectomy, and barbiturate coma. In addition, a fiberoptic rightjugular bulb catheter (Baxter, Medford, MA) was inserted and its position confirmed radiologically. Samples of arterial and jugular venous blood were drawn forsimultaneous measurement of arterial blood gases and Sjvo2 and calculation of AVDO2 . Using protocol-driven therapy ( [23] ), Sjvo2 was continuously measured andmaintained above 50%, with regular calibration and measurement of AVDO2 .In healthy volunteers, we monitored heart rate, mean arterial pressure, pulse oximetry, and arterial blood gases to ensure physiologic stability during PET imaging. Incalculating CPP in healthy volunteers, we assumed an ICP of 10 mm Hg.PET.PET studies were undertaken on a General Electric Advance scanner (GE Medical Systems, Milwaukee, WI). Following a 10-min transmission scan using tworotating germanium-68/gallium-68 rods, performed to correct subsequent emission scans for photon attenuation, emission data were acquired in three-dimensionalmode during the last 10 mins of a 20-min steady-state infusion of 800 MBq of H2 15 O. Images were reconstructed using the PROMIS three-dimensional filtered backprojection algorithm ( [24] ), with corrections applied for attenuation, scatter, randoms, and dead time. The emission data were coregistered to anatomy usingmagnetic resonance or spiral CT images. Parametric maps of CBF were calculated from steady-state radioactivity concentrations in tissue (PET) and arterial blood(discrete samples) using previously published methods ( [25] ) and with a volume of distribution value set to 1.0.The clinical protocols used in our patients are detailed elsewhere ( [23] ). Briefly, patients were managed with sedation and neuromuscular blockade, receivedboluses of 20% mannitol for acute intracranial hypertension, and were treated with volume supplementation and vasoactive agents (dopamine, norepinephrine, orboth) for hemodynamic augmentation. Hyperthermia was treated vigorously, and mild hypothermia (35–36 C) was commonly employed to assist ICP control.Patients who received surgical intervention (cerebrospinal fluid drainage or decompressive craniectomy) or second-tier medical therapies (barbiturate coma ormoderate hypothermia [33–34 C]) before PET imaging are specified in Table 1. Whereas hemodynamic stability was ensured during PET studies by titrating fluidsand vasoactive agents, sedative infusions were left unchanged. It is important to emphasize that no other material changes in management occurred on the day ofthe PET study in any of the patients, thus ensuring stable physiology during the hypocapnic challenge.Following measurement of baseline Sjvo2 and AVDO2 and acquisition of PET images at a Paco2 of approximately 35–40 torr (5 kPa), minute ventilatory volume wasincreased to achieve a Paco2 reduction to about 30 torr (4 kPa). If Paco2 levels fell to 25 torr (3.3 kPa) or Sjvo2 fell to 50%, the extent of hyperventilation wasmodulated. Following a 10-min period of stable arterial blood gas measurement, PET imaging was repeated as described above, and Sjvo2 and AVDO2 weremeasured.Image Analysis.Images were analyzed using custom-designed automated software (PETAN 2000) incorporating elements of several software packages, including StatisticalParametric Mapping (SPM99, Wellcome Department of Cognitive Neurology, London, UK), Matlab 5.2 (MathWorks, Natick, MD), Analyze 2.5 (AnalyzeDirect,Lenexa, KS), and registration by multiresolution optimization of mutual information (mpr, Department of Radiologic Sciences, Guys Hospital, London, UK ( [26] [27] )).Individual anatomic images were edited manually to extract a template that identified brain tissue voxels and excluded extracranial tissue, cerebrospinal fluid, andextra-axial hematomas. This individual brain template was applied to the corresponding median filtered (3 3 in transaxial planes), spatially coregistered PETimages. These final images of perfusion within the injured brain were quantified using a voxel-based method. Voxels in whole-brain CBF images were binned from 0to 100 mL·100g 1 ·min 1 in divisions of 5 mL·100g 1 ·min 1 , and a frequency histogram of CBF distribution was constructed (Fig. 1). An individual brain imagetypically consisted of 50–60,000 voxels, each of which had a nominal volume of approximately 25 mm3 .Figure 1. Cerebral blood flow (CBF) histogram from a single patient, showing the distribution of the numberof voxels in each CBF bin. The hypoperfused brain volume (HypoBV) and hyperperfused brain volume(HyperBV) were calculated as the volume of voxels with CBF values outside critical CBF thresholds ( 10mL·100g 1 ·min 1 and 55 mL·100g 1 ·min 1 , respectively).Estimation of Critically Hypoperfused and Hyperperfused Brain Volumes.We defined a threshold for critical hypoperfusion, and the volume of voxels with blood flow below this threshold was calculated at relative normocapnia and athypocapnia following hyperventilation. Our chosen threshold was comparable with that defined for short-term ischemia predictive of metabolic failure and infarction( [17] [28] ) but lower than that quoted in the field of head injury and subarachnoid hemorrhage using xenon-133 clearance ( [6] [7] ) and xenon CT imaging ( [8] [16] ).We selected a lower value to examine those regions with severe reductions in CBF that were most likely to be representative of critical ischemia. We chose a cutoffvalue of 10 mL·100g 1 ·min 1 for two reasons. This value approximates to both experimental data ( [17] [28] ) and the PET literature in cerebrovascular disease ( [29][30] [31] ) that defines CBF thresholds in terms of subsequent tissue viability. This value was also concordant with a calculated threshold based on the lower 95%confidence interval of our data in healthy volunteers.Whereas eventual infarction provides a hard outcome event that enables the detection of critical CBF thresholds for ischemia, no parallel exists for robustidentification of hyperemia. Evidence within the literature is sparse, but several publications suggest a value in excess of the normal range ( 55 mL·100g 1 ·min 1 )( [9] [14] [21] [22] ), and choice of this figure was underpinned by the finding that the upper 95% confidence interval of our data in healthy volunteers was 55 mL·100g 1·min 1 . However, a true definition of regional hyperemia would require measurement of regional tissue metabolism and CBF. Regional oxygen y/96613048-5/jorg journal&source MI&sp 12571118&sid 713179473/N/305899/1.html?issn 0090-3493 (4 of 11) [6/6/2008 5:44:14 PM]
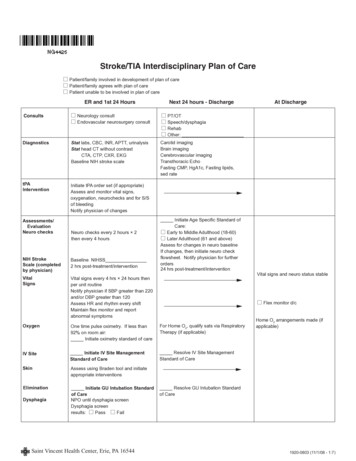
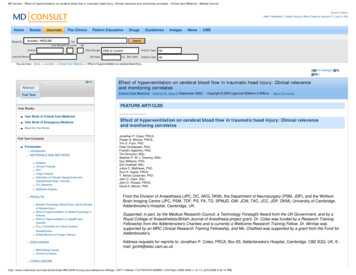
MD Consult - Effect of hyperventilation on cerebral blood flow in traumatic head injury: Clinical relevance and monitoring correlates - Critical Care Medicine - Medical Journal(CMRO2 ) can be measured using triple-oxygen PET (with mapping of CBF, cerebral blood volume, CMRO2 , and oxygen extraction fraction), but it is not widelyavailable within units treating head-injured patients. A technique employing CBF thresholds (such as xenon CT) is not only generally available, but it candemonstrate significant increases in CBF from control values that represent clinically important evidence of hyperemia. Application of these thresholds to CBFhistograms allowed calculation of the extent of critical hypoperfusion (HypoBV) and hyperperfusion (HyperBV) in our patients (Fig. 1).CO2 Reactivity.Global CO2 reactivity was expressed both as an absolute CBF change (mL·100g 1 ·min 1 ·torr 1 ) and as a percentage change from baseline (%/torr).Statistical Analysis.Statistical analysis was undertaken using Statview (Version 5, 1998, SAS Institute, Cary, NC). Data are expressed and displayed as mean se or as median (range),unless otherwise stated. Global- and voxel-based PET data from patient groups and healthy volunteers were compared using two-tailed unpaired and paired t-testsor Mann-Whitney U test and Wilcoxon’s rank-sum test as appropriate. The effect of hyperventilation on clinical monitoring and the global monitors of oxygenationwas compared using two-tailed paired t-tests. Relationships between PET measures of CBF and Paco2 , Sjvo2 , and AVDO2 were explored using linear regression,polynomial fitting, and nonparametric methods (Spearman’s rank correlation test) to take account of nonlinear relationships between variables. A p value of .05 wasconsidered significant.RESULTSBaseline Physiology, Blood Flows, and the Burden of Hypoperfusion.Baseline Paco2 for patients was lower than for healthy volunteers (36 1 vs. 42 1 torr [4.8 0.1 vs. 5.6 0.1 kPa]; p .0001, unpaired t-test). In addition, CPP wassignificantly lower in patients than healthy volunteers (77 2 vs. 89 2 mm Hg; p .001, unpaired t-test).Global CBF (calculated as the average of all brain voxels) was similar for patients imaged at normocapnic baseline and healthy volunteers (30.3 1.2 vs. 31.4 1.1mL·100g 1 ·min 1 ). The mean CBF distribution histogram for all patients was similar to healthy volunteers (Fig. 2). However, data from individual patients showedmarked heterogeneity (Fig. 3a). Many patients had CBF distributions suggestive of critical hypoperfusion.Figure 2. Mean se cerebral blood flow (CBF) histograms from 14 volunteers (white) and 33 patients atnormocapnia (gray) and hypocapnia (black).Figure 3. Individual patient CBF histograms. (a) Cerebral blood flow (CBF) histograms from patients atnormocapnia (gray) compared with the mean 95% confidence interval for healthy volunteers (black). (b) CBFhistograms from patients at hypocapnia (gray) compared with the mean 95% confidence interval for healthyvolunteers (black).Although several patients showed abnormally high Sjvo2 and low AVDO2 , hyperperfusion was far less commonly observed on PET images. Only five patientsshowed CBF distribution curves with a high number of voxels in the hyperperfused range (i.e., exceeding 95% confidence intervals for normal volunteer curves).These five subjects were all imaged between the second and third day following injury. Patients had a significantly greater HypoBV when compared with healthyvolunteers (22 [1–141] vs. 8 [2–32] mL; p .05, Mann Whitney U Test). There was substantial variability between subjects. Large HypoBV figures were not restrictedto patients within the first 24 hrs of head injury, with HypoBV as high as 141 mL (9% of total brain tissue) observed in a patient imaged on day 7 following injury (Fig.4). Baseline HyperBV in patients was not significantly different from values in healthy volunteers (23 [0–384] vs. 23 [1–174] mL).Figure 4. Effect of hyperventilation on the burden of hypoperfusion. Radiographic computed tomography(left) and gray scale positron emission tomographic imaging of cerebral blood flow obtained from a 31-yr-oldman 7 days after injury at relative normocapnia (middle), Paco2 35 torr (4.7 kPa), and hypocapnia (right), 26 torr (3.5 kPa).Voxels with a cerebral blood flow of 10 mL·100g 1 ·min 1 are shaded in black. Note the right frontal contusion and smallparietal subdural hematoma. Baseline ICP was 21 mm Hg and baseline CPP was 74 mm Hg. Baseline Sjvo2 values of 70%and AVDO2 of 3.7 mL/dL are consistent with hyperemia and support the use of hyperventilation for ICP control.Hyperventilation did result in a reduction in ICP to 17 mm Hg and an increase in CPP to 76 mm Hg, with maintenance 48-5/jorg journal&source MI&sp 12571118&sid 713179473/N/305899/1.html?issn 0090-3493 (5 of 11) [6/6/2008 5:44:14 PM]
MD Consult - Effect of hyperventilation on cerebral blood flow in traumatic head injury: Clinical relevance and monitoring correlates - Critical Care Medicine - Medical JournalSjvo2 and AVDO2 within desirable ranges (58% and 5.5 mL/mL respectively). However, despite these Sjvo2 and AVDO2figures, baseline HypoBV was 141 mL and increased to 428 mL with hyperventilation. These increases were observed inboth perilesional and normal regions of brain tissue.Effect of Hyperventilation on Global Physiology in Patients.A reduction of Paco2 from 36 1 to 29 1 torr (4.8 0.1 kPa to 3.9 0.1 kPa) led to a significant and consistent reduction in global CBF (31 1 to 23 1 mL·100g 1·min 1 ; p .0001, paired t-test). This reduction in blood flow occurred despite a fall in ICP from 19.5 1.4 to 16.5 1.2 mm Hg and an increase in CPP from 77 2to 83 2 mm Hg (p .001 and p .0001, respectively, paired t-test). Sjvo2 was reduced from 72 2% to 60 2% and AVDO2 was increased from 3.7 0.2 to 5.6 0.3 mL/mL (p .0001, paired t-test). In no subject did Sjvo2 or AVDO2 reach ischemic thresholds ( 50% and 9 mL/mL). The mean (range) relative global CO2reactivity for CBF was 1 (0.3–1.8) mL·100g 1 ·min 1 ·torr 1 (3.3 [1–5.4] %/torr).Effect of Hyperventilation on HypoBV and HyperBV.When compared with normocapnic baseline values, the HypoBV was significantly elevated following hyperventilation (from 22 [1–141] to 51 [2–428] mL; p .0001,Wilcoxon’s signed-rank test), with individual values as high as 428 mL (or 28% of total brain volume). The HyperBV was significantly reduced followinghyperventilation (23 [0–384] to 1 [0–197] mL; p .0001, Wilcoxon’s signed-rank test). Hypoperfused voxels were commonly observed adjacent to contusions orintracranial hematomas, but also within regions of the brain with no apparent lesions on CT imaging (Fig. 4). In contrast, the few “ischemic” voxels that wereobserved in volunteers were usually the consequence of partial volume effects at ventricular or cortical margins and were no more than 3% of the total brain volume.CBF histograms constructed from data obtained at hypocapnia were shifted toward the left when compared with normocapnic data and healthy volunteers, with agreater proportion of brain voxels within the critically hypoperfused range (Fig. 3).Paco2 Thresholds for Critical Cerebral Hypoperfusion.Global CBF was clearly related to Paco2 (Fig. 5), although there was marked heterogeneity in individual responses. Importantly, only in one subject didhyperventilation result in a small reduction in HypoBV, and in no subject was there an increase in global CBF (Fig. 6). HypoBV was dependent on Paco2 (Fig. 7a), butthis relationship was highly variable between subjects (Fig. 7b) and was clearly nonlinear, with the data suggesting a possible threshold value between 34 and 38torr (4.5–5 kPa). However, within the range of Paco2 values studied, the magnitude of Paco2 reduction (ΔPaco2 ) did not predict the extent of change in CBF orHypoBV (ΔCBF and ΔHypoBV) (Fig. 6).Figure 5. Relationship of positron emission tomographic–derived global cerebral blood flow (CBF) to Paco2 inpatients imaged at baseline and following hyperventilation. The 95% confidence interval for global CBF inhealthy volunteers is shown in hatched gray.Figure 6. Relationship of measures of hypoperfusion to Paco2 . Bivariate plot of changes in Paco2 (delta Paco2 ) vs.changes in hypoperfused brain volume (delta HypoBV) (a) and changes in cerebral blood flow (delta CBF) (b)after hyperventilation in patients.Figure 7. Paco2 thresholds for cerebral hypoperfusion. (a) Plot of hypoperfused brain volume (HypoBV) vs. Paco2in healthy volunteers (white), normocapnic baseline (light gray), and posthyperventilation (dark gray). (b)Relationship of HypoBV to Paco2 in patients imaged at baseline and after hyperventilation. The 95% confidenceinterval for HypoBV in healthy volunteers is shown in hatched gray.Global Monitors of Oxygen Delivery.A clear relationship between global monitors and PET-derived summary measures (CBF, HypoBV, and HyperBV) was demonstrable within individual subjects (Fig.8, Fig. 9). However, the magnitude of changes in Sjvo2 and AVDO2 (ΔSjvo2 and ΔAVDO2 ) did not predict the extent of change in CBF, HypoBV, or HyperBV (ΔCBF,ΔHypoBV, or ΔHyperBV) across the study population. Importantly, although Sjvo2 and AVDO2 reflected changes in global CBF, conventional thresholds based 48-5/jorg journal&source MI&sp 12571118&sid 713179473/N/305899/1.html?issn 0090-3493 (6 of 11) [6/6/2008 5:44:14 PM]
MD Consult - Effect of hyperventilation on cerebral blood flow in traumatic head injury: Clinical relevance and monitoring correlates - Critical Care Medicine - Medical Journalthese bedside monitors performed poorly at identifying patients in whom critical regional hypoperfusion was large or was significantly increased by hyperventilation.We could demonstrate no level of Sjvo2 or AVDO2 that excluded a significant HypoBV while discriminating patients with large HyperBV values (Fig. 9). Indeed, manysubjects showed clinically significant increases in HypoBV with hyperventilation, whereas Sjvo2 and AVDO2 remained at 50% and 9 mL/mL, respectively (figure 4,figure 9, a and b).Figure 8. Relationship of positron emission tomographic–derived global cerebral blood flow (CBF) to Sjvo2 (a)and AVDO2 (b) in 25 subjects imaged at baseline and after hyperventilation. The 95% confidence interval forglobal CBF in healthy volunteers is shown in hatched gray. The ischemic and hyperemic thresholds based onSjvo2 and AVDO2 monitoring are displayed with black dashed lines.Figure 9. Relationship of critically hypoperfused (HypoBV) and hyperperfused (HyperBV) brain volume toSjvo2 and AVDO2 (a–d, respectively) in 25 subjects imaged at baseline and after hyperventilation. The 95%confidence intervals for HypoBV and HyperBV in healthy volunteers are shown in hatched gray. Theischemic and hyperemic thresholds based on Sjvo2 and AVDO2 monitoring are displayed with black dashed lines.DISCUSSIONWe have shown that moderate hypocapnia ( 34 torr [4.5 kPa]) can significantly reduce global CBF and result in significant increases in the volume of criticallyhypoperfused tissue in the injured brain. These increases are observed in the face of apparently beneficial changes in ICP and CPP. The extent of reduction in Paco2seems less important than the actual value achieved, with an apparent threshold value of about 34 torr (4.5 kPa) for significant increases in HypoBV. Thesereductions in regional cerebral perfusion are not associated with ischemia, as defined by global monitors of oxygenation, but may represent regions of tissue at riskof ischemic injury. Although global monitors of brain oxygenation generally correlate significantly to global (i.e., averaged) CBF, they perform poorly at detectingregional hypoperfusion, even when the integrated volume of such hy
A specialist neurocritical care unit. Patients: Fourteen healthy volunteers and 33 patients within 7 days of closed head injury. Interventions: All subjects underwent positron emission tomography imaging of cerebral blood flow. In patients, Paco2 was reduced from 36 1 to 29 1 tor