Transcription
International Review of Research in Open and Distributed LearningVolume 18, Number 4June – 2017Open Educational Resources and Student CourseOutcomes: A Multilevel AnalysisJessie Winitzky-Stephens and Jason PickavanceSalt Lake Community CollegeAbstractSalt Lake Community College (SLCC) is Utah’s largest open enrollment college, and as an institution, isconcerned about the expense associated with attaining a degree. All students face challenges in paying fortheir education, but SLCC students tend to have fewer resources to dedicate to school than students at otherinstitutions in the state. While faculty and administrators have little control over the rising cost of tuition,they are able to offer students open educational resources (OER) to cut down on textbook costs. Salt LakeCommunity College’s OER initiative was implemented in Summer 2014, and has since expanded to include125 sections in Spring 2016. We examine OER’s impact on three measures of student success: course grade,likelihood of passing, and likelihood of withdrawing. We use a multilevel modeling (MLM) approach inorder to control for student, instructor, and course effects, and found no difference between courses usingOER and traditional textbooks for continuing students. For new students, there is evidence that OERincreases average grade. However, student-level differences such as demographic background andeducational experience have a far greater impact on course grade and likelihood of passing or withdrawingthan an instructor’s use of an OER text. Future research should focus on longer-term impacts of OER onretention, completion, and transfer.Keywords: open educational resources, textbooks, multilevel modeling, post-secondary educationIntroductionThe Salt Lake Community College (SLCC) open educational resource (OER) initiative began approximatelythree years ago with the pilot of two Math courses using MyOpenMath. The work was supported by ProjectKaleidoscope, a Next-Generation Learning Challenge grant-funded project aimed at developing OER-basedgeneral education courses. Since then, the initiative has grown from its humble beginnings of a few pilotsacross a handful of disciplines, to one of the most robust educational initiatives at the College. In the Spring2016 semester, we ran 200 OER-based courses. In the Fall 2016 semester, we jumped up to 569 OERsections, and we have over 600 scheduled for the Spring 2017 semester. Our numbers make us one of thelargest single-college OER initiatives in the country. Because these OER courses represent relatively durablecommitments to open content in high-enrollment general education areas, we anticipate our numbersholding steady in the coming academic years.
Open Educational Resources and Student Course Outcomes: A Multilevel AnalysisWinitzky-Stephens and PickavanceMuch of the recent attention on OER has been focused on open degree pathways or so-called Z-degrees(Tepe, 2015). Colleges like Tidewater Community College that have built entirely open degree pathwayshave, indeed, achieved something significant. However, SLCC intentionally adopted a different strategy.Instead of developing OER vertically (a degree), they decided to develop OER horizontally by flipping entiregateway and general education courses open. The goal was to cast a wide OER net across many 1000-levelcourses. The strategy has worked. OER is now an almost inescapable reality for any transfer student atSLCC. Courses built around open content represent well over half of the available sections in what is knownas our general education core of English, Math, and American Institutions (mandated by the Utah Systemof Higher Education). These are requirements all transfer students must fulfill, and unlike the generaleducation distribution areas, students have fewer choices in how they fulfill these requirements. Courseslike History 1700: U.S. History (our most popular American Institutions course) are completely open. Overhalf of English 1010: Intro to Writing and English 2010: Intermediate Writing are open. And Math 1030:Quantitative Reasoning (one of the most popular general education math course for non-STEM majors) isalso completely open.Community colleges are ideal environments for OER because open content is so consistent with thecommunity college mission of open access education. Indeed, community colleges are the original openeducation. The current paper represents the first systematic attempt to understand immediate studentoutcomes of SLCC’s OER initiative. Because the scope of this initiative is so broad, we are able to make asignificant contribution to the understanding of OER’s overall impact.Literature ReviewThere is a paucity of empirical research to undergird the hopeful claims of OER champions. As noted byHilton (2016), only nine studies examining the effect of OER on student learning outcomes had beenpublished as of his writing. Of the seven that reported statistical significance, six reported no difference orfavored OER. While this lends some evidence in support of the use of OER, many of the studies lackstatistical rigor. As research into OER is in its infancy, this is to be expected.To date, only two studies have utilized randomization in their research designs. Lovett, Meyer, and Thille(2008) compared the Open Learning Initiative (OLI) statistics course at Carnegie Mellon University withthe traditional face-to-face lecture course. The OLI course operated under an accelerated model, withstudents expected to complete all modules within eight weeks. It included not only an open textbook, butan entire online course packaged with lectures, homework, and assessments. Students had the opportunityto meet with an instructor twice weekly to ask questions and work through problems. In this way, OLIblended online instruction with face-to-face instruction in a hybrid format. Of 68 volunteers, 22 wererandomly placed into the OLI course, while the remaining students took the traditional statistics course.The study found students in the accelerated OLI course “experienced a much more effective and efficientlearning experience in that they showed equal or better learning gain in half the time” (Lovett, Meyer, &Thille 2008, p. 14; emphasis in original).36
Open Educational Resources and Student Course Outcomes: A Multilevel AnalysisWinitzky-Stephens and PickavanceBowen, Chingos, Lack, and Nygren (2014) expanded the analysis to six higher education institutions. Theyreplicated the method used by Lovett et al. (2008) and randomized 605 participants into either a traditionalstatistics course or the hybrid OLI course. They were also able to include student-level controls fordemographic and educational background. They found no significant difference between these treatmentand control groups.While the two studies to utilize randomization are important, it is worth noting that they examined studentperformance in a hybrid OER course, as compared to a traditional course employing a commercial text.Whatever differences were observed may be the result of instructional modality, rather than the OERtextbook per se.Feldstein et al. (2012) compared the pass/fail rate in OER and traditional courses and found no difference.However, all sections of each course were either OER or traditional, so no direct comparison could be made.In addition, no student- or instructor-level controls were included to account for individual variation.Hilton and Laman (2012) performed a similar analysis, but were able to account for the effect of the courseitself and that of the instructor. They did this by including data from the same instructors from the previoussemester, before OER was implemented. The results strongly favored OER: average course grades and finalexam scores were higher in OER sections, and students were less likely to drop. However, significance wasnot discussed, so we have no way of knowing if these differences are causal or if they simply representrandom variation.Fischer, Hilton, Robinson, and Wiley (2015) utilized propensity score matching in an effort to mimic anexperimental design. They paired students enrolled in OER courses with students in traditional courses onthe basis of age, gender, and ethnicity. Matching on these three demographic characteristics rendered the“treatment” (OER) and “control” (traditional) groups more similar to one another and eliminated some ofthe variability introduced by students making individual enrollment choices. The authors examined coursecompletion, passing, course grade, and enrollment intensity for 15 courses. Each course had both OER andtraditional sections, and the analysis was done for separately for each course. This resulted in 45 distinctregression analyses. In the majority of analyses, the authors found no significant difference between OERand traditional sections. When differences did appear, they tended to favor OER.Propensity score matching is a powerful technique. However, age, gender, and ethnicity are not the onlyindividual characteristics that may lead to a decision to enroll in an OER versus traditional course. Otherdemographic variables that may account for these differences are socioeconomic status, parents’ education,parental status, and employment status, among others. In addition, educational experience and academicability are likely important factors to take into account. Thus, matching is not preferable to truerandomization, but it is a close approximation.In the only study identified by Hilton (2016) as controlling for both student and instructor variables, Allen,Guzman-Alvarez, Molinaro, and Larsen (2015) examined the effect of using an OER text in several sectionsof a chemistry course. Instructors taught at least two sections of the course, assigning some sections thetraditional text and some sections the OER text. In this way, the instructor effect could be minimized. To37
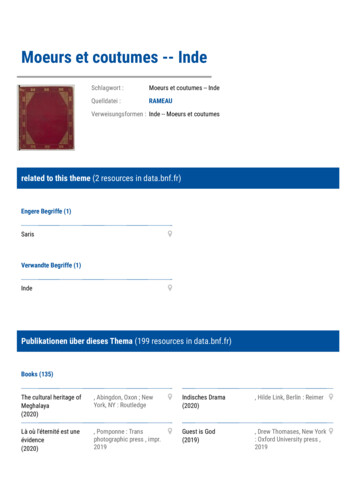
Open Educational Resources and Student Course Outcomes: A Multilevel AnalysisWinitzky-Stephens and Pickavancecontrol for differences between students, the researchers administered study-habit and attitudequestionnaires. While this was not a true experiment, every effort was made to control for individualvariation. The authors found no significant difference in student learning outcomes between OER andtraditional sections.Taken together, these results are promising. It appears that OER can deliver comparable results for studentsas traditional textbooks, but at no cost. However, more research is needed across multiple contexts tofurther investigate the connection between the use of OER and student learning. The current studycontributes to this literature by applying a rigorous multilevel methodology to a larger sample of studentsover a longer period of time.Data and MethodDataThe OER initiative began in earnest at Salt Lake Community College in Summer 2014. As we wanted acomparison group, we pulled course-level data from each semester between Fall 2012 and Spring 2016.Courses were included if at least one section had been taught using an OER text during this period. Thisresulted in 37 courses over a wide range of general education subjects, each with both traditional and OERsections. Figure 1 lists each of these micsEducationEnglishGeographyCourse22811135, 1200, 1210, 1280, 21201010,140010502010102020101000, 1300, 1400, 1700, 1780, 1800, 2920HistoryMathPolitical SciencePsychologySociologyWriting1700920, 950, 990, 1010, 1030, 1050, 1060, 1100, 1210, 1220, 20101100, 230010101010900Figure 1. Courses included in the dataset.Every section and every semester of each course is included in the dataset, netting 34,146 enrollments over11 semesters. We also included background characteristics for each student enrolled in these courses: age,gender, race, new student status, former concurrent status, accumulated credits, and overall GPA at time38
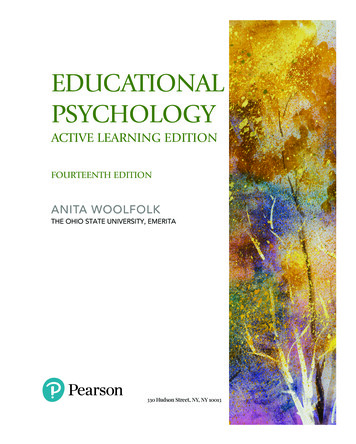
Open Educational Resources and Student Course Outcomes: A Multilevel AnalysisWinitzky-Stephens and Pickavanceof enrollment. It should be noted that students will be duplicated in this dataset if they took more than oneof the selected courses, or if they retook a single course. Thus, a single row represents not a student, but acourse enrollment. There were 23,430 unique student ID numbers in the dataset. This means roughly 30%were duplicates. While this scenario is not ideal from the standpoint of classical regression, the multilevelmodelling technique we employ can easily account for this duplication.While there were no OER courses taught at SLCC prior to Summer 2014, we included these semesters inthe analysis because several courses transitioned completely to OER after this point. Thus, for severalcourses, there would be no traditional course for comparison. After inspecting the data closely, we foundthere were some slight demographic changes over this time period: the average proportion of men enrolledbetween Fall 2012 and Spring 2014 was 52%; after this point it was 49%. Similarly, the average proportionof white students declined from 69% to 67%. There was a concomitant increase in the proportion ofHispanic students from 15% to 17%. There was essentially no change in age, overall GPA, or proportion offormer concurrent (dual enrollment) students. The differences we observed are small, and we conclude thatpre-Summer 2014 is comparable to later semesters.The data come from institutional sources. Staff from the Office of Institutional Research pulled data fromBanner tables during Fall semester 2016. In addition, staff from the Office of Educational Initiatives keepdetailed records of which instructors in which sections choose to employ OER in their classrooms.Because all data were drawn from our in-house student information system (Banner), missing data wasrare. The only variable with a significant amount of missing data was GPA. As students in their first semesterin college have not had time to accrue a GPA history, nearly all of the missing data in the GPA field is fornew students. Missing data accounts for 17% of GPA observations. When we attempted a multipleimputation technique, modeling GPA using demographic characteristics, substantive changes to our mainfindings resulted. This indicates poor modeling of the missing data, perhaps due to its non-random nature:only and all new students were missing this field. To ameliorate this issue, we divided the dataset into twogroups—new and continuing students—and modeled them separately.MethodThis analysis utilizes a multilevel approach. Multilevel modeling (MLM), also known as hierarchical linearmodeling, is an extension of regression analysis that enables us to include indicators at different levels ofanalysis and define the structure of the relationship between variables as hierarchical. For example, aresearcher interested in how 5th graders in the United States perform on a standardized test recognizes thatperformance can be influenced by differences at the individual, classroom, school, district, and state level.Using MLM, they can structure their analysis in such a way that students are nested within classrooms,classrooms are nested within schools, schools are nested within districts, and districts are nested withinstates (see Figure 2). Multilevel modeling allows us to take into account variation from the micro- to themeso- to the macro-level. For a fuller treatment of this methodology, see Woltman, Feldstain, MacKay, andRocchi (2012), Gelman and Hill (2007), and Gelman (2006).39
Open Educational Resources and Student Course Outcomes: A Multilevel AnalysisWinitzky-Stephens and PickavanceFigure 2. MLM illustration.For the purposes of the current analysis, we have three levels, which are modeled as random effects:student, instructor, and course. At the student level, we can control for demographic characteristics such asage, gender, and race, as well as past performance such as accumulated credits and overall GPA. We alsoinclude student as a random effect because each student may enroll in more than one course. The effect ofindividual instructors can be captured at the next level, along with instructors’ choice to assign an OER ortraditional text. At the class level, we can control for the effect of individual course, course level(development education, 1000- or 2000-level), and subject (e.g., Math, Writing, English, Biology).Multilevel modeling is an appropriate analytical tool for these data because, though we are not interestedin group effects, students are nested within instructors and courses, and thus do not constitute independentobservations.Model assumptions for the MLM methodology mirror those for OLS. First, variables must have a linearrelationship, though there are variants of MLM that can deal with nonlinearity. Second, error terms arenormally distributed at each level of the model. Third, we assume populations variances are equal. The finalassumption for classical regression is that of independent observations. In this, MLM differs slightly, as itis designed to handle situations in which observations are correlated with one another by virtue of theirbeing nested. However, MLM does require errors to be uncorrelated at different levels. Regressiondiagnostics and postestimation demonstrate the data meet these assumptions. Though residuals were notperfectly normally distributed, Gelman and Hill (2007) argue this methodology is quite robust, and “thenormality or otherwise of residuals doesn’t affect the parameter estimates in multilevel modes” (p. 46). Weuse Stata/IC version 14.2 to perform all analyses, using the mixed command for the continuous dependentvariable, and melogit for the binary dependent variables.40
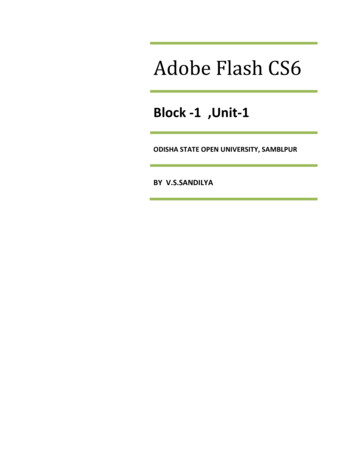
Open Educational Resources and Student Course Outcomes: A Multilevel AnalysisWinitzky-Stephens and PickavanceLevelStudent(Level 1)Instructor(Level 2)Course(Level 3)VariablesAgeGenderRaceNew studentFormer concurrentAccumulated credits (continuing students)Overall GPA (continuing students)OERCourse level (Dev Ed., 1000, 2000)Subject (Math, Biology)Figure 3. Independent variables included in analysis.Dependent VariablesWe use three measures of student success: course grade, pass/fail, and withdraw. These are modeled at thestudent level. Thus, we can understand individual outcomes while taking into account larger factors suchas OER use in the classroom. While longer-term consequences of OER, such as completion and transfer,would be illuminating, these data are not available at this early juncture.Course grade is reported on a standard letter scale, which we converted to numeric (“A” 4, “A-“ 3.7,“B ” 3.3, etc.) for ease of analysis. Grades of “W”, “I”, and “AU” were coded as 0. The pass/fail is a dummyvariable, created from course grade. Pass was set equal to 1, and defined as C- or above. As with numericgrade, “W,” “I,” and “AU” were coded as 0. Finally, withdraw was also constructed as a dummy variable,with “W” observations equal to 1 and all others equal to 0.Independent VariablesOur main independent variable is the use of an OER text in the classroom. This is a dummy variable, codedas 1 if an instructor chose to use OER, and 0 if an instructor used a traditional text.In order to isolate the effect of OER use on student success, we included several controls. This studycontains three levels of analysis. Student, course, and instructor are modeled as random effects. This meansall other variables are nested within them. The majority of independent variables are measured at thestudent level. In order to account for basic demographic differences between students, we included age,gender, and race. Age is an interval variable, so did not require any manipulation. Gender is coded as adummy variable (1 Male), and race is simplified as white (1) and underrepresented minority (0). Weincluded Hispanic as a dummy variable in some models, but the effect was small. We also attempted toaccount for student ability by including former concurrent status (dummy). For continuing students, wealso controlled for earned credits and overall GPA.We also felt it was important to control for the level of the course. Developmental education courses (0900level) were coded as 1; freshman-level (1000) courses were coded as 2; sophomore-level (2000) courseswere coded as 3. Finally, we included dummy variables for math and biology courses. These courses tendto pose greater difficulty for students, with lower pass rates and lower average course grades. As the first41
Open Educational Resources and Student Course Outcomes: A Multilevel AnalysisWinitzky-Stephens and Pickavanceinstructors to employ OER at our institution were math teachers, this could have a strong impact on theperception of OER outcomes.ResultsDescriptiveWhile our dataset is quite large, encompassing more than 34,000 enrollments over 11 semesters, it is notexperimental in design. Figure 4 shows the number of enrollments in each section of each course bysemester. While OER started out quite slowly in Summer 2014, it has grown such that the majority ofsections of the selected courses are taught using an OER text.SemesterFall 2012Spring 2013Summer 2013Fall 2013Spring 2014Summer 2014Fall 2014Spring 2015Summer 2015Fall 2015Spring 2016OverallEnrollment 313,5762262,620 1,2508556751,951 2,3941,070 2,91226,5387,588Figure 4. Enrollments included in dataset.Figures 5 and 6 list the independent and dependent variables used in the analysis, as well as descriptivestatistics for each. As we modeled new and continuing students separately, we display these tablesseparately as well. As a group, continuing students tend to be older, are more likely to be female, white, andformer concurrent. They also tend to earn higher grades (2.39 vs. 2.12) and pass at a higher rate (76% vs.66%).42
Open Educational Resources and Student Course Outcomes: A Multilevel AnalysisWinitzky-Stephens and PickavanceContinuing ntGPAAccumulatedcreditsOERCourse ,302Mean25.0830.4960.6970.1610.330Std. 290.22401000001311411Figure 5. Table of descriptive statistics – Continuing students.New ntOERCourse ean23.5040.5340.6480.1720.019Std. .22101000001311411Figure 6. Table of descriptive statistics – New students.As can be observed in the table of correlations below, OER is not significantly correlated with the threemeasures of course success. Instead we see the importance of student-level characteristics suchdemographic and academic background, as well course-level indicators such as subject.43
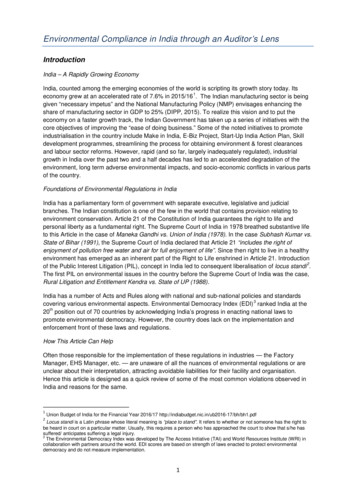
Open Educational Resources and Student Course Outcomes: A Multilevel AnalysisWinitzky-Stephens and PickavanceGra d e Pa s sGr a d ePa ssWAgeMa leW h iteHisp a n icNe w stu d e n tFor m e r con cu r r e n tCr e d itsGPAOERCou r se le ve lMATHBIOLWAg eMa 0.018*0.047*0.018*0.002Wh ite His p a n ic Ne ws tu d e n tFo rm e rCre d its GPAc o n c u rre n 60*OERCo u rs e MATHle v e 5*0.094*0.025*1.0000.006 1.0000.044* -0.061* 1.0000.069* 0.075* -0.422*-0.003 0.011* 0.036*1.000-0.184**p 0.05Figure 7. Table of correlations (pairwise).An initial examination of the data (see Figure 8) uncovers few significant differences between coursesemploying OER and traditional texts. Overall, OER and non-OER courses are statistically indistinguishablein independent samples t-tests (average course grade) and z-tests for proportions (pass and withdrawrates). However, OER courses had lower pass rates in their first semester of implementation, higherwithdraw rates in the second semester, and lower average course grades in the first two semesters. Theyquickly caught up and are now comparable. In fact, average grades in OER courses were significantly higherthan those in their traditional counterparts in Fall 2015.SemesterSummer 2014Fall 2014Spring 2015Summer 2015Fall 2015Spring 2016Average 82.582.272.40**2.362.32Pass 72%74%Withdraw ll2.3774%5%2.3674%6%* p 0.05** p 0.01Figure 8. Average grade, Pass, and Withdraw rates for traditional and OER courses, Summer 2014-Spring16.There are several possible explanations for the poorer outcomes in Summer and Fall 2014. It may be thecase that the OER initiative was experiencing growing pains, and that it took a few semesters for teachersto adjust their pedagogy to this new instructional resource. Examining the data more closely however, weobserved that the only OER subjects on offer at these early stages were math courses (see Appendix). In44
Open Educational Resources and Student Course Outcomes: A Multilevel AnalysisWinitzky-Stephens and Pickavancegeneral, students tend to struggle more in math, and academic outcome measures are typically lower inthese courses, as compared to other subjects. The differences we observe may be more a reflection of thedifficulty of the course than the effect of OER per se. Because all early OER courses were in math, we wereunable to test this hypothesis. Removing math courses and replicating the analysis eliminates the OERcomparison group altogether, rendering t- and z-tests impossible.Multilevel ModelsThe confounding effect of subject matter illustrates the need for a model that can take such variation intoaccount. Using MLM, we can control for course subject, course level, the idiosyncrasies of individualinstructors, and the background of individual students.Figures 9 and 10 show the results of multilevel analyses of final grade and logistic MLM analyses of passand withdraw rates. For continuing students, use of OER is not a significant factor for any of the threedependent variable. Instead, course-level and student-level variables are more important in predictingstudent success: some 75% of the variability in student success can be attributed to differences betweenstudents, and not from instructor or course differences.As we anticipated, math and biology courses tend to be more difficult. On average, students received lowergrades in these courses. In addition, students tended receive lower grades in 1000- and 2000- level courses.Students who were older, white, former concurrent, and had earned fewer credits were more likely to earna higher grade.For a student’s likelihood of receiving a C- or above, former concurrent status, race, and overall GPA weresignificant at the student level. The math dummy variable remained important, but the biology dummy lostsignificance. The direction of the coefficients was consistent for that of numeric grade.Continuing StudentsLevelVariableGradeCoefficientsPassLevel 3:CourseCourse 0.0744AgeFormer concurrentMaleWhiteAccumulated creditsOverall .2139**-0.0761-0.02730.0017-0.6394**Level 2:InstructorLevel 1:StudentWithdraw* p 0.05** p 0.01Figure 9. Results – Continuing students.45
Open Educational Resources and Student Course Outcomes: A Multilevel AnalysisWinitzky-Stephens and PickavanceFor new students, OER has a slight positive impact of course grade, suggesting OER is of particularimportance to first-time college students. Course level and the math dummy variable are significant andnegative, as for continuing students. Older students, women, and white students tend to earn higher grades.For likelihood of passing, none of the course- or instructor-level variables are significant. Age, gender, andrace remain, and in the same direction as the first model. Finally, men are more likely to withdraw from acourse, as are former concurrent students, and those enrolled in higher-level courses (i.e., 1000- and 2000level).New Level 3:CourseCourse geFormer 20*-0.1366Level 2:InstructorLevel 1:Student* p 0.05** p 0.01Figure 10. Results – New students.DiscussionMultilevel models examining three measures of student success demonstrated no significant differencebetween courses using OER and traditional textbooks for continuing students, and a small benefit for newstudents. Controlling for instructor-, course-, and student-level variables showed individual differenceshave a far greater impact on students’ numeric grade and likelihood of passing or withdrawing than aninstructor’s use of an OER text.There is some evidence that OER can be of particular benefit to new students. While it has no effect onlikelihood of passing or withdrawing from a course, it is associated with an increase in course grade of0.1367: small, but not insignificant. It is unclear whethe
across a handful of disciplines, to one of the most robust educational initiatives at the College. In the Spring 2016 semester, we ran 200 OER-based courses. In the Fall 2016 semester, we jumped up to 569 OER sections, and we have over 600 scheduled for the Spri