Transcription
Final ReportEvaluation of Photo Red Light Enforcement Programin the City of Miami BeachPrepared for:Prepared by:Priyanka Alluri, Ph.D., P.E., Assistant ProfessorAngela Kitali, Graduate Research AssistantFabio Soto, Graduate Research AssistantFlorida International UniversityDept. of Civil & Environmental Engg.10555 West Flagler Street, EC 3628Miami, FL 33174December 2018
DISCLAIMERThe opinions, findings, and conclusions expressed in this publication are those of the authors andnot necessarily those of the City of Miami Beach.ii
ACKNOWLEDGMENTSThis research was funded by the City of Miami Beach. The authors are grateful to Dr. LeslieRosenfeld, Chief Learning and Development Officer, Organization Development PerformanceInitiatives, City of Miami Beach for her guidance and support throughout the project. A specialthanks is due to the City of Miami Beach Police Department and the City of Miami BeachTransportation Department for providing the required data. The authors are also thankful to Mr.Hector Vargas and Ms. Liana Roque, undergraduate research assistants at Florida InternationalUniversity for assisting with the data collection.iii
TABLE OF CONTENTSDISCLAIMER . iiACKNOWLEDGMENTS . iiiLIST OF FIGURES . vLIST OF TABLES . viLIST OF ACRONYMS/ABBREVIATIONS . vii1. INTRODUCTION . 12. RESEARCH OBJECTIVE . 23. LITERATURE REVIEW . 24. STUDY DATA . 44.1 Treatment and Non-treatment Intersections . 44.2 Crash Data. 64.3 Traffic Volume. 104.4 Intersection Characteristics . 105. METHODOLOGY . 115.1 Descriptive Statistics . 115.1.1 Washington Ave and 17th Street. 115.1.2 41st St. and Prairie Ave . 135.1.3 Alton Rd and Chase Ave . 155.1.4 Indian Creek Dr and W 63rd Street . 175.1.5 Indian Creek Dr and 71st Street . 195.1.6 Washington Ave and Dade Blvd . 215.1.7 Pine Tree Blvd and 23rd Street . 235.1.8 Indian Creek Dr and Abbott Ave . 255.2 Statistical Models . 275.2.1 Data Variables Considered. 275.2.2 Poisson-gamma Model . 295.2.3 Model Results and Discussion . 306. REFLECTION . 346.1 Target Crash Type and Target Crash Severity . 346.2 General Crash Trend . 346.3 Safety Performance of Non-treatment Intersections . 367. SUMMARY . 407.1 Simple Before-and-after Crash Data Analysis . 407.1.1 Four-legged Intersections . 407.1.2 Three-legged Intersections . 407.1.3 Safety Performance of Intersections with No RLCs . 417.2 FB Before-and-after Analysis . 41REFERENCES . 42iv
LIST OF FIGURESFigure 1: Map of Treatment and Non-Treatment Intersections .5Figure 2: Aerial View of Washington Ave and 17th St. Intersection .12Figure 3: Overview of Target Crashes at Washington Ave and 17th St Intersection .12Figure 4: Washington Ave and 17th St Intersection - Overview of Target Crashes at Approacheswith RLCs .12Figure 5: Aerial View of W 41st St and Prairie Ave Intersection .14Figure 6: Overview of Target Crashes at W 41st St and Prairie Ave Intersection .14Figure 7: W 41st St and Prairie Ave Intersection - Overview of Target Crashes at Approach withRLC.14Figure 8: Aerial View of Alton Rd and Chase Ave Intersection .16Figure 9: Overview of Target Crashes at Alton Rd and Chase Ave Intersection .16Figure 10: Alton Rd and Chase Ave Intersection - Overview of Target Crashes at Approach withRLC.16Figure 11: Aerial View of Indian Creek Dr and W 63rd St. Intersection .18Figure 12: Overview of Target Crashes at Indian Creek Dr and W 63rd St. Intersection .18Figure 13: Indian Creek Dr and W 63rd St. Intersection - Overview of Target Crashes at Approachwith RLC.18Figure 14: Aerial View of Indian Creek Dr and 71st St. Intersection.20Figure 15: Overview of Target Crashes at Indian Creek Dr and 71st St. Intersection.20Figure 16: Indian Creek Dr and 71st St. Intersection - Overview of Target Crashes at Approachwith RLC.20Figure 17: Aerial View of Washington Ave and Dade Blvd Intersection .22Figure 18: Overview of Target Crashes at Washington Ave and Dade Blvd. Intersection .22Figure 19: Washington Ave and Dade Blvd. Intersection - Overview of Target Crashes atApproach with RLC .22Figure 20: Aerial View of Pine Tree Blvd and 23rd St. Intersection .24Figure 21: Overview of Target Crashes at Pine Tree Blvd and 23rd St. Intersection .24Figure 22: Pine Tree Blvd and 23rd St. Intersection - Overview of Target Crashes at Approachwith RLC.24Figure 23: Aerial View of Indian Creek Dr and Abbott Ave Intersection .26Figure 24: Overview of Target Crashes at Indian Creek Dr and Abbott Ave Intersection .26Figure 25: Indian Creek Dr and Abbott Ave Intersection - Overview of Target Crashes atApproach with RLC .26Figure 26: Percent of Fatal and Severe Injury Crashes by Target Crash Type .34Figure 27: Annual Crash Trend .35Figure 28: Target Crashes by Crash Type at Comparison Intersections .37Figure 29: Target Crashes at Intersections Far Away from the Treatment Sites .39v
LIST OF TABLESTable 1: Summary of Recent Literature on the Safety Impacts of RLCs . 3Table 2: Treatment and Non-treatment Intersections. 6Table 3: Descriptive Statistics of Crashes at Treatment and Non-treatment Intersections . 9Table 4: Descriptive Statistics of the Data Used in the full Bayes Models . 29Table 5: Model Results for Different Target Crash Types . 32Table 6: Model Results for Different Target Crash Severities . 33vi
LIST OF RLCRLRRTMSBWBAnnual Average Daily TrafficBayesian Credible IntervalDepartment of Highway Safety and Motor Vehicles (Florida)East BoundFull BayesFlorida Department of TransportationNorth BoundProperty Damage OnlyPhoto Red LightRed Light CameraRed-light RunningRegression-to-the-meanSouth BoundWest Boundvii
EVALUATION OF PHOTO RED LIGHT ENFORCEMENT PROGRAMThis report summarizes the key findings of the safety evaluation of the Photo Red Light (PRL)Enforcement Program in the City of Miami Beach, Florida. The report is structured as follows. Section 1 presents a brief introduction on the usage of red light cameras (RLCs) to improvesafety at signalized intersections. Section 2 presents the study objective. Section 3 shows the results of the most recent studies on the safety effectiveness of RLCs. Section 4 discusses the data used in this study and the data collection efforts. Section 5 presents the methodology adopted to evaluate the safety performance of the PRLenforcement program in the City of Miami Beach. Section 6 reflects on the main findings from the study. Section 7 summarizes this research effort.1. INTRODUCTIONIntersection-related crashes represent approximately 40% of all crashes (Decina et al., 2007). Assuch, intersection safety is a serious problem in the United States. Many of the crashes at signalizedintersections can be attributed to red-light running (RLR), which “involves a driver entering anintersection after the traffic signal has turned red” (City of Fort Lauderdale, n.d.). The followingcrash types are commonly attributed to RLR: angle, left-turn, right-turn, and head-on crashes.These crashes are often severe and result in fatalities. For example, in 2015, on average, two peopleare killed every day due to RLR. From 2011 to 2015, 719 people died each year on an averagefrom RLR crashes. In 2014, about 126,000 people were injured in RLR crashes. The estimatedeconomic losses exceed 4 Billion annually (ATSOL, 2018). Interestingly, in RLR crashes, it wasnot the drivers who run red lights who sustain fatal injuries, but the occupants of other vehicles,pedestrians, and bicyclists who were hit by drivers who run red lights (IIHS-HLDI, 2016). In 2010,61 people were killed in RLR crashes in Florida, making it the third deadliest state in the nationfor RLR crashes (City of Miami Springs, n.d.).Over the last decade, photo red light (PRL) cameras have been increasingly deployed to reducethe occurrence of RLR crashes. This automated enforcement method is used to discourage redlight runners and decrease intersection crashes. Red light cameras (RLCs) are automated systemsthat photograph vehicles entering intersections after the traffic signals have turned red. Thephotographic evidence captured by the cameras allow camera operators to determine whether ornot a ticket should be issued to the violating vehicle. In Florida, RLR tickets usually cost 158,but drivers could pay up to 262 if they fail to pay for the offence after the first notification (FloridaOnline Traffic School, 2018).1
2. RESEARCH OBJECTIVEThe main objective of this study was to evaluate the safety effectiveness of the PRL EnforcementProgram in the City of Miami Beach, Florida. The safety effectiveness of the RLCs was measuredusing the simple before-and-after analysis and the full Bayes before-and-after evaluation approach.The full Bayes method was implemented to take into account the regression-to-the-mean (RTM)phenomenon, which is observed due to the natural variability of crash data, to also consider thechanges in traffic volume, geometric characteristics and driver behavior over time.3. LITERATURE REVIEWTable 1 summarizes recent studies that focused on the safety effectiveness of RLCs. The literaturereview revealed that most studies have compared data for the “before installation” and “afterinstallation” periods for treatment and non-treatment intersections to quantify the safetyeffectiveness of RLCs. While most studies determined that signalized intersections equipped withRLCs experienced a considerably large reduction in RLR crash types and injuries, some studiesdetermined that RLCs contribute only to a small reduction in crashes. Additionally, these studiesfound that RLCs have some negative safety impacts, i.e., they tend to increase specific crash types,such as rear-end and sideswipe collisions, by both number and severity. Understanding themethodology and findings of previous studies allowed the research team to adopt a methodologyto overcome the past flaws and difficulties, such as, the RTM effect, and identify the right type ofcrashes to be evaluated.2
Table 1: Summary of Recent Literature on the Safety Impacts of RLCsReferenceNumber of StudyIntersectionsKo et al. (2017) Treatment Sites: 48 Comparison Sites:Not AvailableLlau et al. (2015) Treatment Sites: 20 Comparison Sites: 40Claros et al.(2017) Treatment Sites: 24 Comparison Sites: 35 Treatment Sites: 25Ahmed andAbdel-Aty (2014) Comparison Sites:Not AvailableShin andWashington(2007) Treatment Sites: 24 Comparison Sites: 13Study ResultsMethod After the RLC activation: 37% crash reduction inall RLR crash types. After the RLC deactivation: 20% increase in allRLR crash types. 19% and 24% reduction in total injury, and RLRrelated injury crashes. 40% increase in rear-end crashes. 12% reduction in angle crashes. 10.5% increase in rear-end crashes. Crash cost benefit of 47,000 per site per year. Angle and left-turn crashes decreased by 24% and26% for all severity and fatal and injury crashes,respectively, at approaches with RLCs. Rear-end crashes increased by 32% and 41% for allseverity level and fatal crashes. Angle crashes decreased by 20% and left-turncrashes decreased by 45% at target approaches. Rear-end crashes increased by 41%. Similar results were found for non-targetapproaches, indicating a high spillover effect.Before-after(EB approach)Study PeriodCity, State2008 - 2014Houston, TXBefore-after usingcomparison group(EB approach)2008 – 2012Miami-DadeCounty, FLBefore-after(EB approach)2006 – 2011MissouriBefore-after(EB approach)2006 – 2011OrangeCounty, FLBefore-after(Simple, withtraffic flowcorrection, usingcomparison group,& EB approach)1998 – 2003;1990 – 2003Phoenix andScottsdale, AZ Treatment Sites: 32 Significant increase in sideswipe and rear-endBefore-aftercrashes.1997 – 2010 Charlotte, NC Comparison Sites:(EB approach)Not Available Significant reduction in total crashes.Note: treatment sites are the signalized intersections with RLCs; while comparison (i.e., non-treatment) sites are the signalized intersections with no RLCs.Pulugurtha andOtturu (2013)3
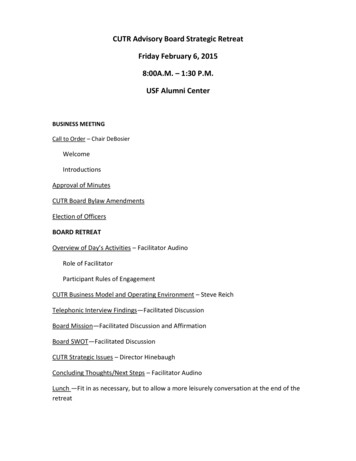
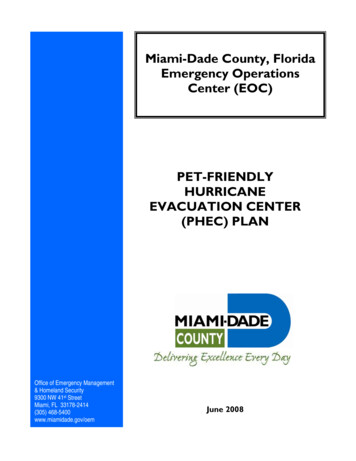
4. STUDY DATAThe study area included a total of 28 signalized intersections in the City of Miami Beach, Florida.The intersections were divided into two categories: signalized intersections with RLCs, termed as “treatment intersections”; andsignalized intersections without RLCs, termed as “non-treatment intersections”.As the name implies, treatment intersections are locations where RLCs were installed. On the otherhand, non-treatment intersections, also known as comparison intersections, are those intersectionsthat have similar traffic volume, roadway geometrics, and other site characteristics as the treatmentintersections, but without the RLCs. These sites were manually selected after an extensive reviewof the City of Miami Beach’s roadway network.Figures 1(a) and 1(b) show the map of the treatment and non-treatment intersections, respectively.A total of nine signalized intersections were identified as “treatment intersections”. Of these nine,six are four-legged and the remaining three are three-legged intersections. A total of 19 signalizedintersections were identified as “non-treatment intersections”, 14 of which are four-legged, andthe remaining five are three-legged signalized intersections.The following data were included in the analysis: crash data, traffic volume, roadway geometriccharacteristics, and traffic control features. Note that these data were required for both treatmentand non-treatment intersections. The following subsections discuss these data in detail.4.1 Treatment and Non-treatment IntersectionsA total of ten red-light cameras are operational at nine signalized intersections in the City of MiamiBeach, as listed in Table 2 and shown in Figure 1(a). For all the intersections, Table 2 includes thenumber of intersection legs (i.e., three-legged or four-legged), and the major road and minor roadnames. For the treatment intersections, the table provides information on the RLC installation dateand the approach with the RLC.Due to the long period of construction activity, the intersection where Alton Road meets 17thStreet was not included in the study. Temporary traffic controls, such as concrete barriers andtraffic cones, tend to affect traffic patterns, traffic volumes, and the occurrence of crashes.Therefore, this intersection is expected to have an unusual crash frequency that cannot beassociated with the operation of RLCs. The rest of the intersections (i.e., both treatment and nontreatment intersections) were manually reviewed to identify any major construction activity thatmight have taken place during the study period. However, no significant construction activity wasfound at the rest of the intersections. The review was also done to make sure that there were noother countermeasures during the study period other than the RLCs.4
(a) Treatment Intersections(b) Non-treatment IntersectionsFigure 1: Map of Treatment and Non-Treatment Intersections5
Table 2: Treatment and Non-treatment sIntersection TypeItemMajor RoadMinor RoadthDate of OperationApproach with RLC123*456789Washington AveWashington AveAlton Road41st St.Alton RoadIndian Creek Dr71st St.Washington AvePinetree Blvd17 St.17th St.17th St.Prairie AveChase AveW 63rd St.Indian Creek DrDade Blvd.23rd n Creek DrAbbott tions11Dade BlvdPrairie Ave125th St.Alton Road13Arthur Godfrey Rd.Meridian Ave14Alton Road16th St.15Alton Road11th St.16Alton Road8th St.1717th St.James Ave18Alton RoadW 47th St.19Washington Ave16th St.Not ApplicableNot Applicable2041st St.Indian Creek Dr215th St.Collins Ave22Collins Ave16th St.23Collins Ave23rd St.rd2463 St.Pine Tree Dr25West Ave17th St.26Pine Tree DrSheridan Ave27Washington15th St.28Pine Tree DrW 47th St.29West Avenue11th St.* This location experienced major construction during the study period. Hence, it is not included in the analysis.4.2 Crash DataThe analysis was based on five years of crash data. Since the RLCs were installed in April 2010,crash data from two years before the RLC installation (i.e., 2008-2009), and three years after theRLC installation (i.e., 2011-2013) were included in the analysis.Signal Four Analytics, a statewide interactive web-based geospatial crash analytical tooldeveloped by and hosted at the University of Florida, GeoPlan Center, was used to identify andextract crash data. All crashes that occurred within 300 ft from the center of the intersection wereidentified, and the police crash reports of all these crashes were downloaded and reviewed.As is evident from the literature, RLCs impact only specific (and not all) crash types, commonlyknown as target crashes. The following crash types were considered to be associated with RLRand the operation of RLCs.6
Angle (side impact)Right-turn (vehicle turning)Left-turn (vehicle turning)Rear-endSideswipeThe police reports of all crashes that occurred within 300 ft of the intersections were manuallyreviewed to identify intersection-related crashes and target crashes. The number of crashesextracted from Signal Four Analytics was 2,419. Of this total, only 1,080 target crashes wereincluded in the analysis. A total of 389 target crashes were found to have occurred at treatmentsites, and 691 target crashes were found to have occurred at non-treatment sites, during both thebefore and the after periods. Table 3 provides a summary of all observed crash frequencies fortreatment and non-treatment intersections. In addition to crash type, crash severity was alsoconsidered in the analysis. Crashes were categorized into property damage only (PDO), andfatal/injury crashes. Note that all injury severity levels (i.e., incapacitating, non-incapacitating, andpossible injury) were grouped in the fatal/injury crash category.The following information was collected while reviewing the police reports: The approach the crash occurredo Major approacho Minor approacho Middle of the intersectiono Not sure The crash occurred on the approach with a red light camera? (applicable only fortreatment intersections)o Yeso Noo Not sure Manner of collisiono Rear-endo Angle/left-turn/right-turno Head-on/front-to-fronto Sideswipeo Backed intoo Fixed objecto Othero Not sure 1st vehicle maneuver actiono Going straighto Making a left-turno Making a U-turno Making a right-turn7
o Not sureo Other 2nd vehicle maneuver actiono Going straighto Making a left-turno Making a U-turno Making a right-turno Not sureo Other Crash involving driveway/on-street parkingo Yeso Noo Not sure Crash involving a pedestrian/bicyclistso Yeso Noo Not sure Crash involving a distracted drivero Yeso Noo Not sureTo evaluate the direct impact of RLCs on crash frequency and severity, target crashes wereexcluded when one of the following conditions were present: Adverse weather conditionDistractionDriving under the influence (DUI)Crashes related to emergency vehicles responding in emergency circumstancesSicknessSleep deprivation/fatigueTable 3 provides the descriptive statistics of crashes at each of the treatment and non-treatmentintersections.8
Table 3: Descriptive Statistics of Crashes at Treatment and Non-treatment 3-leggedTreatmentBefore-periodAfter-periodTarget Crashes by Crash Target CrashesTarget Crashes by Crash Target CrashesInt.MajorMinorTypeby SeverityTypeby TargetAngle/Angle/CrashesCrashesRear- SideFatal &Rear- SideFatal &CrashesCrashesLeft-turn/PDOLeft-turn/PDOend swipeInjuryend swipeInjuryRight-turnRight-turn1 Washington Ave17th St.91.54.512315273.31.72.36.01.318.07.32 Washington Ave17th St.91.54.512315273.31.72.36.01.318.07.33* Alton Road17th St.3.598164.520.5497.74.78.7 19.02.052.721.14 41st St.Prairie Ave0.53.50.540.54.5211.34.70.05.01.013.065 Alton RoadChase Ave131.550.55.5160.04.71.04.31.314.75.76 Indian Creek DrW 63rd St.1.553.5911019.51.03.72.76.31.025.07.47 71st St.Indian Creek Dr3.5 11.54 16.52.51923.52.78.33.3 11.03.318.714.38 Washington AveDade Blvd.1.521.54.50.55102.71.00.73.31.010.34.49 Pine Tree Blvd23rd St.1.511.5404120.70.01.31.70.37.3210 Indian Creek DrAbbott Ave12.51.5415130.31.01.32.30.311.32.611 Dade Blvd.Prairie Ave1.51.513.50.5462.01.00.32.70.75.73.312 5th St.Alton Road2 35.58 39.5645.555.52.0 26.09.7 31.76.051.337.713 Arthur Godfrey Rd. Meridian Ave1.5718.519.511.50.75.00.04.31.39.05.714 Alton Road16th St.4.546.51411528.53.33.33.08.31.325.09.615 Alton Road11th St.2326.50.5793.03.01.75.32.315.07.716 Alton Road8th St.46.58.51631925.55.35.33.0 12.01.720.013.617 17th St.James Ave2.51021.53.55.51.00.72.03.70.06.73.718 Alton RoadW 47th St.0.51.50.52.502.54.50.71.00.32.00.04.0219 Washington Ave16th St.1.587142.516.532.51.33.33.36.31.721.07.920 41st St.Indian Creek Dr0.54.52617240.34.03.77.70.325.7821 5th St.Collins Ave3.521.56.50.5726.50.30.72.33.00.316.33.322 Collins Ave16th St.02231419.50.70.72.02.70.719.03.423 Collins Ave23rd St.1.51130.53.5202.01.72.04.31.325.35.724 63rd St.Pine Tree Dr0.510.520210.50.30.00.71.00.09.0125 West Ave17th St.1.52.51.54.515.58.50.31.70.32.00.34.72.326 Pine Tree DrSheridan Ave01.501.501.540.70.70.31.30.34.51.727 Washington Ave15th St.11.5020.52.520.50.31.00.31.30.319.71.628 Pine Tree DrW 47th St.0.51010.51.570.31.30.01.30.36.71.629 West Avenue11th St.03.50.53.50.545.51.01.30.71.02.04.73* This location experienced major construction during the study period, and is not included in the analysis.Note: all the crashes are per year. Total target crashes include angle/left-turn/right-turn, sideswipe, and rear-end crashes. There is an approximation error of 0.1 in total target crashes.9
4.3 Traffic VolumeTraffic volume data is included in traffic safety models because it is proven to be the maincontributor to what is called crash exposure, i.e., as traffic volume increases there is a higherlikelihood for crashes to occur.AADT were collected from the Florida Department of Transportation (FDOT) Traffic Onlinewebsite, a web-based mapping application that provides traffic count site locations and historicaltraffic count data. It is managed by the FDOT Transportation Data and Analytics Office. AADTdata were collected for every year of analysis, 2008, 2009, 2011, 2012, and 2013. However, it isimportant to note that traffic counts are not available for all years and all roads due to high datacollection costs. As such, the research team made reasonable assumptions to estimate missingtraffic counts. For the missing data, AADT was obtained from parallel roads with similar roadwaygeometric characteristics, and AADT for the missing years was extrapolated assuming that trafficvolume increased by 3% each year.4.4 Intersection CharacteristicsRoadway geometric characteristics and traffic control features often influence the occurrence andseverity of crashes at signalized intersections. Including these data in the analysis helps understandthe relationship, if any, between the RLR behavior and the characteristics of the intersections. Thefollowing roadway geometric characteristics and traffic control features were collected for each ofthe study intersection: Roadway Geometric Characteristicso Number of through laneso Approaches with left-turn laneso Approaches
EVALUATION OF PHOTO RED LIGHT ENFORCEMENT PROGRAM This report summarizes the key findings of the safety evaluation of the Photo Red Light (PRL) Enforcement Program in the City of Miami Beach, Florida. The report is structured as follows. Section 1 presents a brief introduction on the usag